Originally published in KDnuggets: 21 Must-Know Data Science Interview Questions and Answers
KDnuggetsより正式に和訳を書くことの許可を得ました。
Gregory-san thank you for the approval
一つ目、二つ目、三つ目に続き、今回はデータサイエンスの面接において答えられないといけない質問21種類の四つ目の質問です。
4.Explain what precision and recall are. How do they relate to the ROC curve?
和訳すると「適合率と再現率が何なのか説明し、ROC曲線とどのような関係にあるか答えなさい」となります。
原文
Imagine there are 100 positive cases among 10,000 cases. You want to predict which ones are positive, and you pick 200 to have a better chance of catching many of the 100 positive cases. You record the IDs of your predictions, and when you get the actual results you sum up how many times you were right or wrong. There are four ways of being right or wrong:
10000ケースあったとして、その中の100ケースがポジティブケースだとします。どれがポジティブケースかを当てたく、200ケースをポジティブとして選択したとします。200ケースすべての当たり外れを記録します。その場合、4種類の当たりと外れのパターンが存在します。
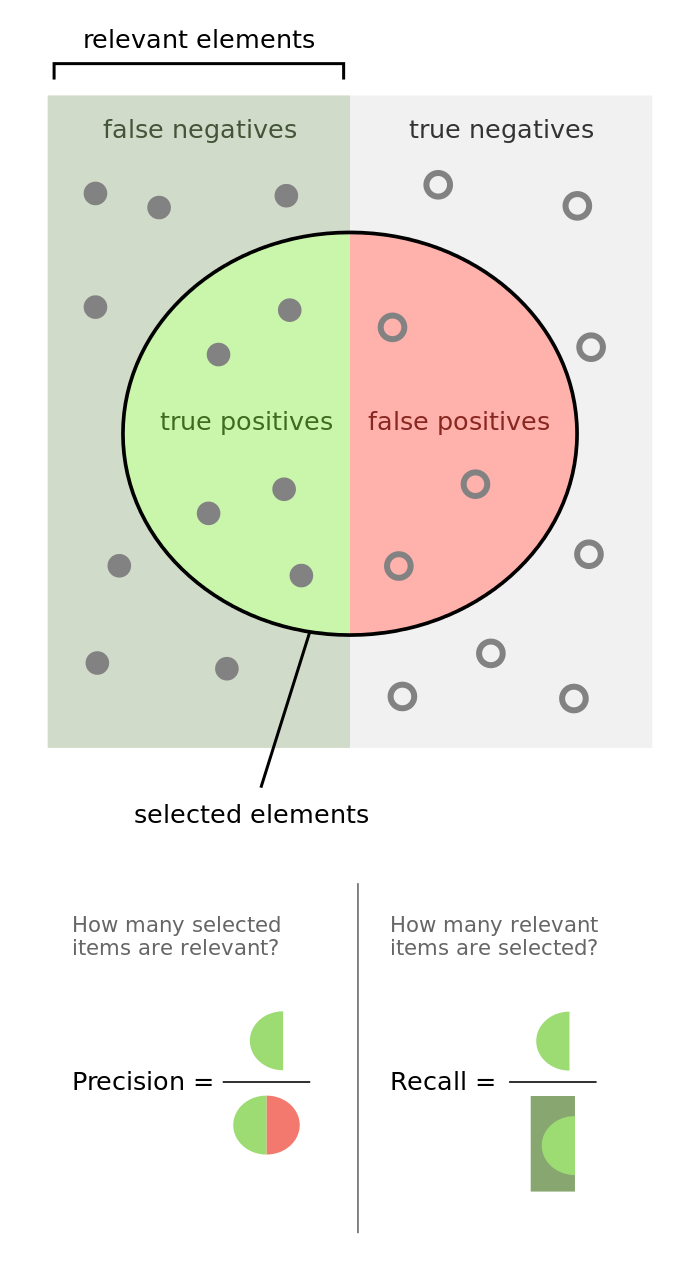
- TN / True Negative: ケースはネガティブで、予想もネガティブだった。
- TP / True Positive: ケースはポジティブで、予想もポジティブだった。
- FN / False Negative: ケースはポジティブで、予想はネガティブだった。
- FP / False Positive: ケースはネガティブで、予想はポジティブだった。
原文
Now you count how many of the 10,000 cases fall in each bucket, say:
今回の予測の結果が以下だとします。
| ネガティブと予測 | ポジティブと予測 | |
|---|---|---|
| ネガティブケース | TN:9760 | FP:140 |
| ポジティブケース | FN:40 | TP:60 |
追加で三つの質問があります。
原文
What percent of your predictions were correct?
You answer: the "accuracy" was (9,760+60) out of 10,000 = 98.2%
Q.予測の何パーセントが正しかったか?
A.正解率は
$$\frac{TN+TP}{TN+TP+FN+FP} \times 100 = \frac{9760+60}{9760+60+40+140} \times 100 = 98.2$$
98.2%となります。
原文
What percent of the positive cases did you catch?
You answer: the "recall" was 60 out of 100 = 60%
Q.ポジティブケースを何%捉えられたか?
A.再現率は
$$\frac{TP}{TP+FN} \times 100 =\frac{60}{60+40} \times 100=60$$
60%となります。
原文
What percent of positive predictions were correct?
You answer: the "precision" was 60 out of 200 = 30%
Q.ポジティブと予測した内の何%が合っていたか?
A.適合率は
$$\frac{TP}{TP+FP} \times 100 =\frac{60}{60+140} \times 100=30$$
30%となります。
原文
See also a very good explanation of Precision and recall in Wikipedia.
Wikipediaの適合率と再現率の説明がよいと紹介されています。
原文
ROC curve represents a relation between sensitivity (RECALL) and specificity(NOT PRECISION) and is commonly used to measure the performance of binary classifiers.
ROC曲線は感度(再現率と同義)と特異度(適合率ではない)の関係性を表現し、 一般的に二項分類モデルのパフォーマンス測定に利用されます。
原文
However, when dealing with highly skewed datasets, Precision-Recall (PR) curves give a more representative picture of performance. See also this Quora answer: What is the difference between a ROC curve and a precision-recall curve?.
ただ、歪んだ分布を持つデータセットに対しては、Precision-Recall curve(PR曲線)のほうがよりパフォーマンスをうまく表現できます。
Quoraより
Particularly, if true negative is not much valuable to the problem, or negative examples are abundant. Then, PR-curve is typically more appropriate. For example, if the class is highly imbalanced and positive samples are very rare, then use PR-curve.One example may be fraud detection, where non-fraud sample may be 10000 and fraud sample may be below 100.In other cases, ROC curve will be more helpful.
TNの値が大きくなりやすい場合や、ネガティブケースが豊富な場合には、PR曲線が一般的に適しています。例えば、偏りが大きく、ポジティブケースが稀な場合にはPR曲線を使用します。一つの例として、不正検知の場合には、不正でないサンプルは10000あったとしても不正のサンプルは100以下という場合があります。ほかの場合にはROC曲線がより有用です。
Let’s take an example of fraud detection problem where there are 100 frauds out of 2 million samples.
Algorithm 1: 90 relevant out of 100 identified
Algorithm 2: 90 relevant out of 1000 identified
200万サンプルの中に不正が100あるとします。
アルゴリズム1は100件から90を正しく見つけ出し、
アルゴリズム2は1000件から90を正しく見つけ出しました。
Evidently, algorithm 1 is more preferable because it identified less number of false positive.
In the context of ROC curve,
Algorithm 1: TPR=90/100=0.9, FPR= 10/1,999,900=0.00000500025
Algorithm 2: TPR=90/100=0.9, FPR=910/1,999,900=0.00045502275
The FPR difference is 0.0004500225
明らかにFPが少なく、アルゴリズム1が好ましいものとなります。
ただ、ROC曲線では、FPRの差が0.0004500225しか出てきません。
For PR, Curve
Algorithm 1: precision=0.9, recall=0.9
Algorithm 2: Precision=90/1000=0.09, recall= 0.9
Precision difference= 0.81
PR曲線の場合には、Precisionの差が0.81とでます。
The difference is more apparent in PR curve
このケースではPR曲線のほうがより違いをはっきりと表現することができます。
まとめ
TP、FP、TN、FNと適合率、再現率など分析でこんがりやすい用語の整理となっています。用語は覚えるしかないですが、ROC曲線とPR曲線の使い分けの違いが具体例を持って紹介されているのがポイントかと思います。