初めに
この記事では、shap.DeepExplainerを使用してMultiModal Modelを可視化する方法についてまとめています。
MultiModalかつRegression予測モデルを用いたshap可視化方法について記載する記事が少なかったので、自分で検討して見ました。少しでも役立てられれば幸いです。
実際にMultiModalなモデルを作成する。
テーブルデータ、画像、テキストを入力として、regression予測をするモデルを構築します。
model.py
from tensorflow import keras
from tensorflow.keras.layers import (
    Conv2D,
    Dense,
    Flatten,
)


class MultiModelModel(keras.Model):
    def __init__(self, metadata):
        inputs = []
        context_inputs = []
        for name, vocab in metadata.context_columns.items():
            context_inputs.append(keras.layers.Input(shape=(len(vocab),), name=name))
        concatenate_context = keras.layers.Concatenate(name="concatenate_context_layer")(context_inputs)


        text_input = keras.layers.Input(shape=(metadata.text_len,), name=metadata.text_column)
        densed_text = Dense(10, activation="relu", name="dense_text")(text_input)

        image_input = keras.layers.Input(shape=metadata.image_size, name=metadata.image_column)
        conved_img = Conv2D(filters=3, kernel_size=(3, 3), name="conv_1")(image_input)
        flatten_img = Flatten(name="flatten_image")(conved_img)
        densed_img = keras.layers.Dense(10, activation="relu", name="img_dense_1")(flatten_img)

        concatenated = keras.layers.Concatenate(name="concatenate_layer")([concatenate_context] + [densed_img] + [densed_text])

        x = keras.layers.Dense(3, activation="relu", name="dense_1")(concatenated)

        output = keras.layers.Dense(1, name="output")(x)

        super(MultiModelModel, self).__init__(
            inputs=context_inputs + [image_input] +  [text_input], outputs=output
        )
上記のモデルを可視化した図が下記となります。
学習用のデータを構築する
train_data.py
from typing import Any, Dict, Tuple
from transformers import BertJapaneseTokenizer
from tensorflow.keras.datasets import mnist
import numpy as np

def create_mock_dataset() -> Tuple[Dict[str, np.ndarray], np.ndarray]:
    """Create mock traine data"""
    features = {}

    # Text mock data
    max_length = 10
    test_text = "吾輩は猫である" # textはあえて全て同じにしてshap_valueの評価が0となるのかを見る。
    tokenizer = BertJapaneseTokenizer.from_pretrained("cl-tohoku/bert-base-japanese-whole-word-masking") # Textを前処理しておく
    tokenized = tokenizer(test_text, max_length=max_length, padding="max_length")
    features["text"] = np.array([tokenized["input_ids"]]*100)

    # Image mock data
    (train_X, train_y), (test_X, test_y) = mnist.load_data()
    trainX = train_X.reshape((train_X.shape[0], 28, 28, 1))
    img = trainX[0:100]

    # Contextual mock data
    features["context_1"] = np.random.randint(0, 2, (100, 3)) # contextualのvalueはランダムにして相関をなくす。
    features["context_2"] = np.random.randint(0, 2, (100, 3))
    features["context_3"] = np.random.randint(0, 2, (100, 3))
    features["image"] = img

    # y mock data
    # categoricalではなく今回はregressionのshapを検討したい。あまり意味はないが適当に100をかけた数値をyとする。
    y = train_y[0:100]*100

    return features, y
modelを学習させる
# Create mock data
train_x, train_y = create_mock_dataset()

model.fit(train_x, train_y, epochs=20, batch_size=20)
shapの値を計算する
# shapで使用するようにデータを整える
train_mock_data_for_shap = [train_x["context_1"], train_x["context_2"], train_x["context_3"], train_x["image"], train_x["text"]]

# setup shap explainer
explainer = shap.DeepExplainer(model = model, data = train_mock_data_for_shap)

# check_additivityでエラーが出てますが、出力の値にそこまで誤差はなさそうなので今回は無視します。
shap_values = explainer.shap_values(train_mock_data_for_shap, check_additivity=False)


# Flatten shap_values
# shapの値はモデルの入力のshapeに合わせて出力される。
context_1_value = shap_values[0][0]
context_2_value = shap_values[0][1]
context_3_value = shap_values[0][2]
image_value = shap_values[0][3]
text_value = shap_values[0][4]
flatten_image_value = []
for i in range(len(image_value)):
    tmp = image_value[i, :, :,]
    tmp = np.ravel(tmp)
    flatten_image_value.append(tmp)

flatten_image_value = np.array(flatten_image_value)

# 全てのshap valueをflattenにしてまとめる。
concat_shap_value = np.concatenate((context_1_value, context_2_value, context_3_value, flatten_image_value, text_value), axis=1)


# convert base_value from tf.Tensor to float
# shap値を可視化する際に必要になる。shap値学習時に使用したデータの平均予測値となる。
base_value = float(explainer.expected_value[0].numpy())
print(base_value) # 315.7513427734375


# 可視化する際に使うshapの対応名前
shap_feature_nameslist = []

for i in range(context_1_value.shape[1]):
    shap_feature_nameslist.append(f"context_one_{i}")

for i in range(context_2_value.shape[1]):
    shap_feature_nameslist.append(f"context_two_{i}")

for i in range(context_3_value.shape[1]):
    shap_feature_nameslist.append(f"context_three_{i}")

for i in range(image_value.shape[1] * image_value.shape[2]):
    shap_feature_nameslist.append(f"img_{i}")

for i in range(text_value.shape[1]):
    shap_feature_nameslist.append(f"text_{i}")
可視化
可視化する準備は整ったので色々と可視化して見ていきたいと思います。
force_plot
# This does not show feature name because of too many features
# 可視化する特徴量が多すぎて特徴量の名前が表示されてませんが、とりあえず可視化できてそう。
shap.force_plot(
    base_value, concat_shap_value[0, :],
    feature_names=shap_feature_nameslist,
    matplotlib=True,
    link="identity"
)
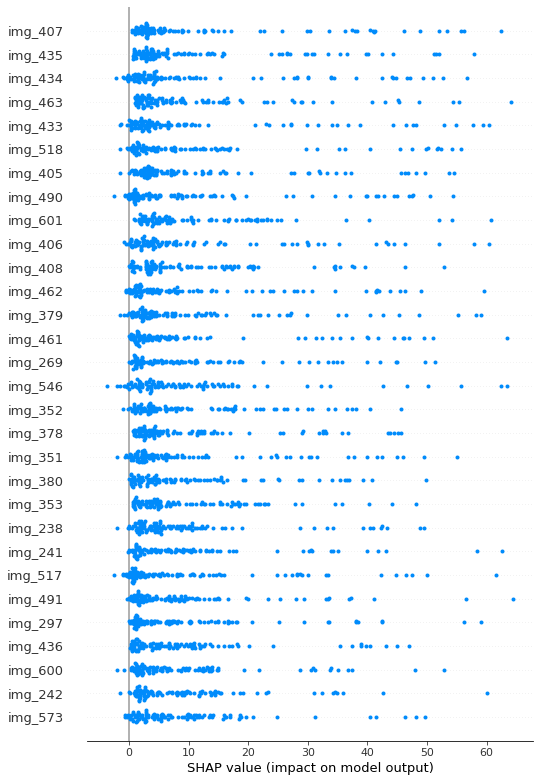
summary_plot
# 今回の予測では画像データを重視して見ていたことが確認できる。
shap.summary_plot(
    shap_values=concat_shap_value,
    feature_names=shap_feature_nameslist,
    max_display=30
)
Contextual shap valueの検証
# 簡単な検証だが、contextはランダムな値を使ったのでshap値も画像に比べて低いことがわかる。
print(f"context_1: {np.median(context_1_value)}")
print(f"context_2: {np.median(context_2_value)}")
print(f"context_3: {np.median(context_3_value)}")

print(f"image: {np.median(image_value)}")

# context_1: 0.0020842847516178153
# context_2: -0.0009403099172050133
# context_3: 0.002673752688569948
# image: 0.015288334805518389
Textual shap valueの検証
# テキストは同じものを入れたのでshapの値が全て0になっているのを確認
is_all_zero = not np.any(text_value)
print(is_all_zero) # True
モデルが画像のどこを見ているかを可視化
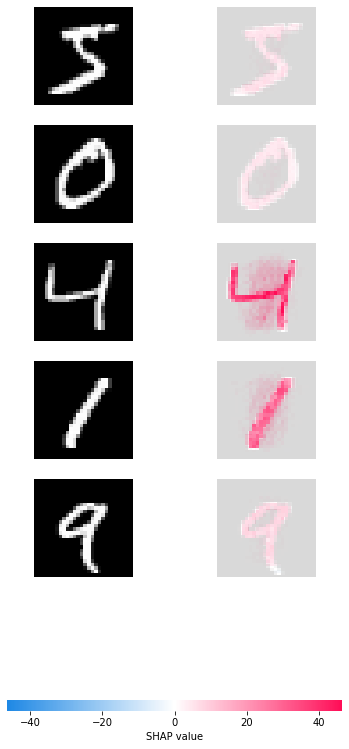
いくつかの画像にshap_valueを重ねて可視化してみます。
想定通り、数字の画像ピクセル部分のshapが高くなっている。
# 先頭の5件を可視化する。
head_img_shap_value = image_value[0:5]
img_dataset = train_x["image"][0:5]
img_dataset = img_dataset.astype(float) # convert int to float type

shap.image_plot(head_img_shap_value, img_dataset)
まとめ
モデルを可視化する技術はとても役立ちますが、まだまだ知見がまとまっておらず実際にビジネス流用を考えたときに苦労します。こちらの記事が少しでも役立てば幸いです。


