概要
Mermaidでプリザンターにダイアグラム・チャートを表示させてみます。Mermaidを使うメリットなどについては以下の記事で詳しく紹介されていますので、興味のある方はそちらをご参照ください。
試した環境
プリザンター 1.3.25.3
Mermaid v9.2.2
OS: Windows10
DB: SQL Server
事前準備
プリザンターでは拡張HTMLという機能で外部スクリプトを読み込むことができるので、以下の手順でMermaidが使えるようにします。
- 以下のテキストファイルを作成して配置します。
\web\pleasanter\Implem.Pleasanter\App_Data\Parameters\ExtendedHtmls\HtmlBodyBottom.html
<script src="https://cdn.jsdelivr.net/npm/mermaid/dist/mermaid.min.js"></script> <script>mermaid.initialize({startOnLoad:true});</script> - IISを再起動します。
これでMermaidを使用する準備ができました!
スクリプトの設定
今回は、Mermaidの公式サイトで紹介されているダイアグラム・チャートを表示してみます。プリザンターでフォルダを作成し、フォルダの管理画面からスクリプトに以下の各内容を設定することでダイアグラム・チャートが表示されます。
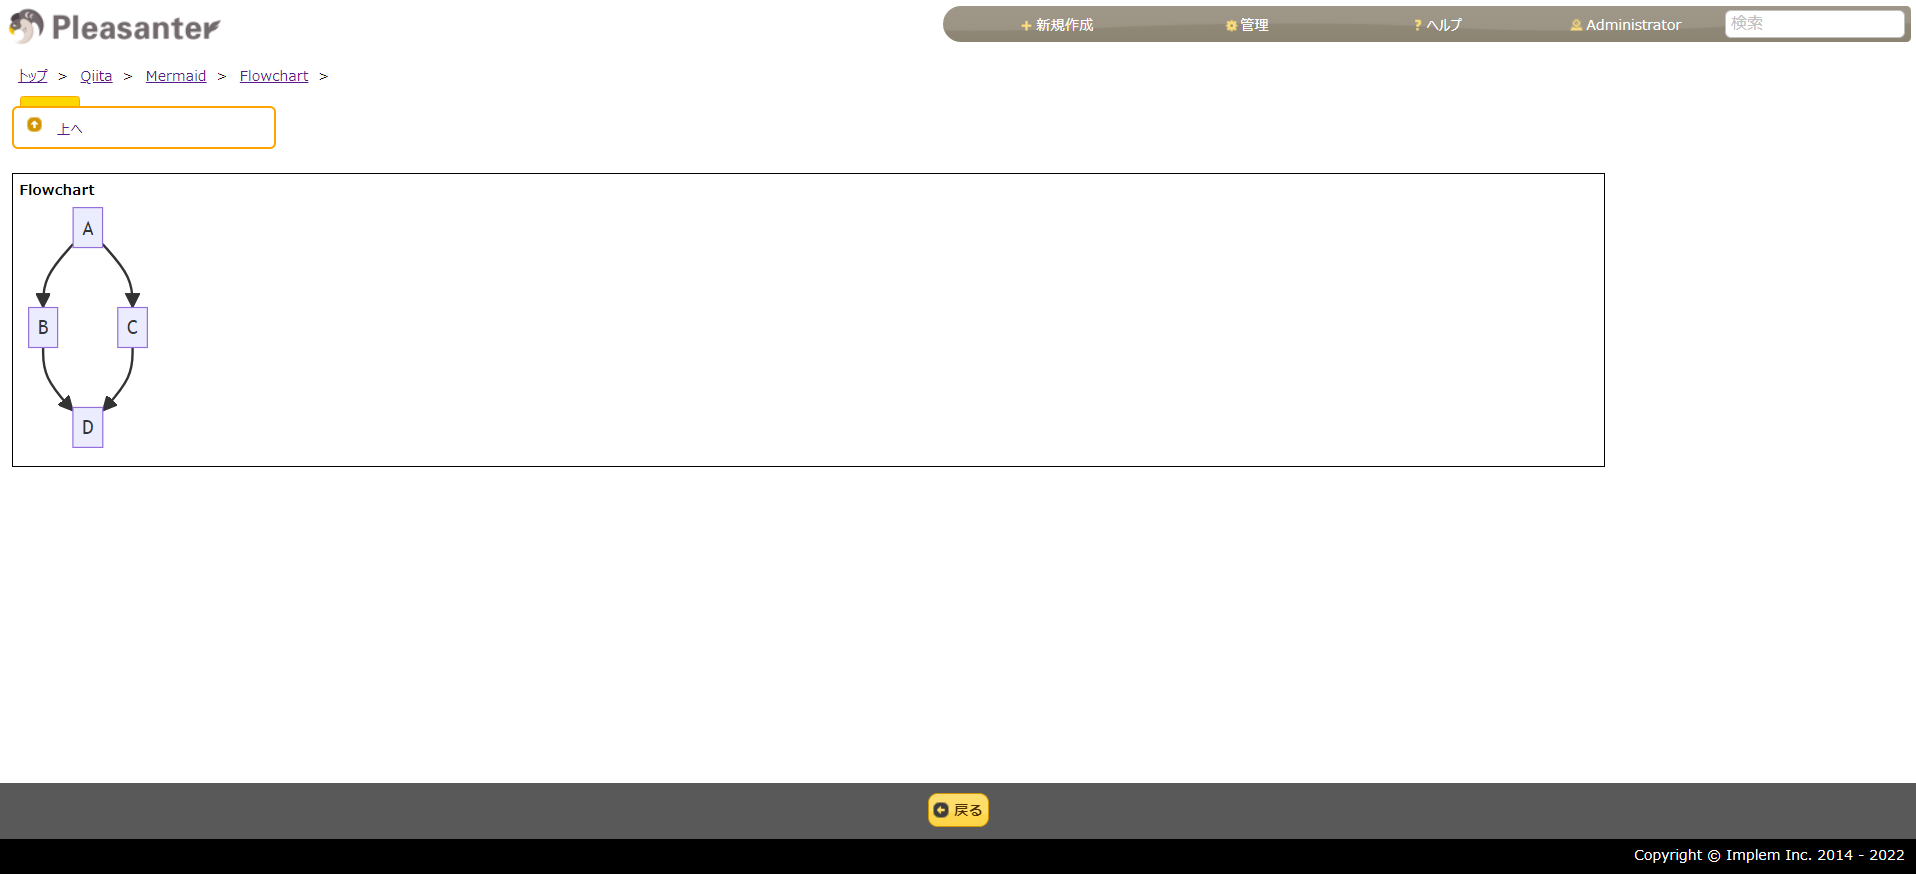
フローチャート
$p.events.on_grid_load = function () {
    $("#SiteMenu").after('<div id="table_menu" style="display:inline-block;vertical-align:top"></div>');
    $('#table_menu').css("width","calc(100% - 250px)").css("padding","0px 0px").css("margin-top","10px");
    html = '<div style="margin-bottom:30px;white-space: pre-line;border:1px solid black; padding:5px;">';
    html += '<span style="font-weight:bold">Flowchart</span><br/>';
    html += '<div class="mermaid">';
    html += `
        graph TD;
            A-->B;
            A-->C;
            B-->D;
            C-->D;
    `;
    html += '</div>';
    $('#table_menu').prepend(html);
}
結果
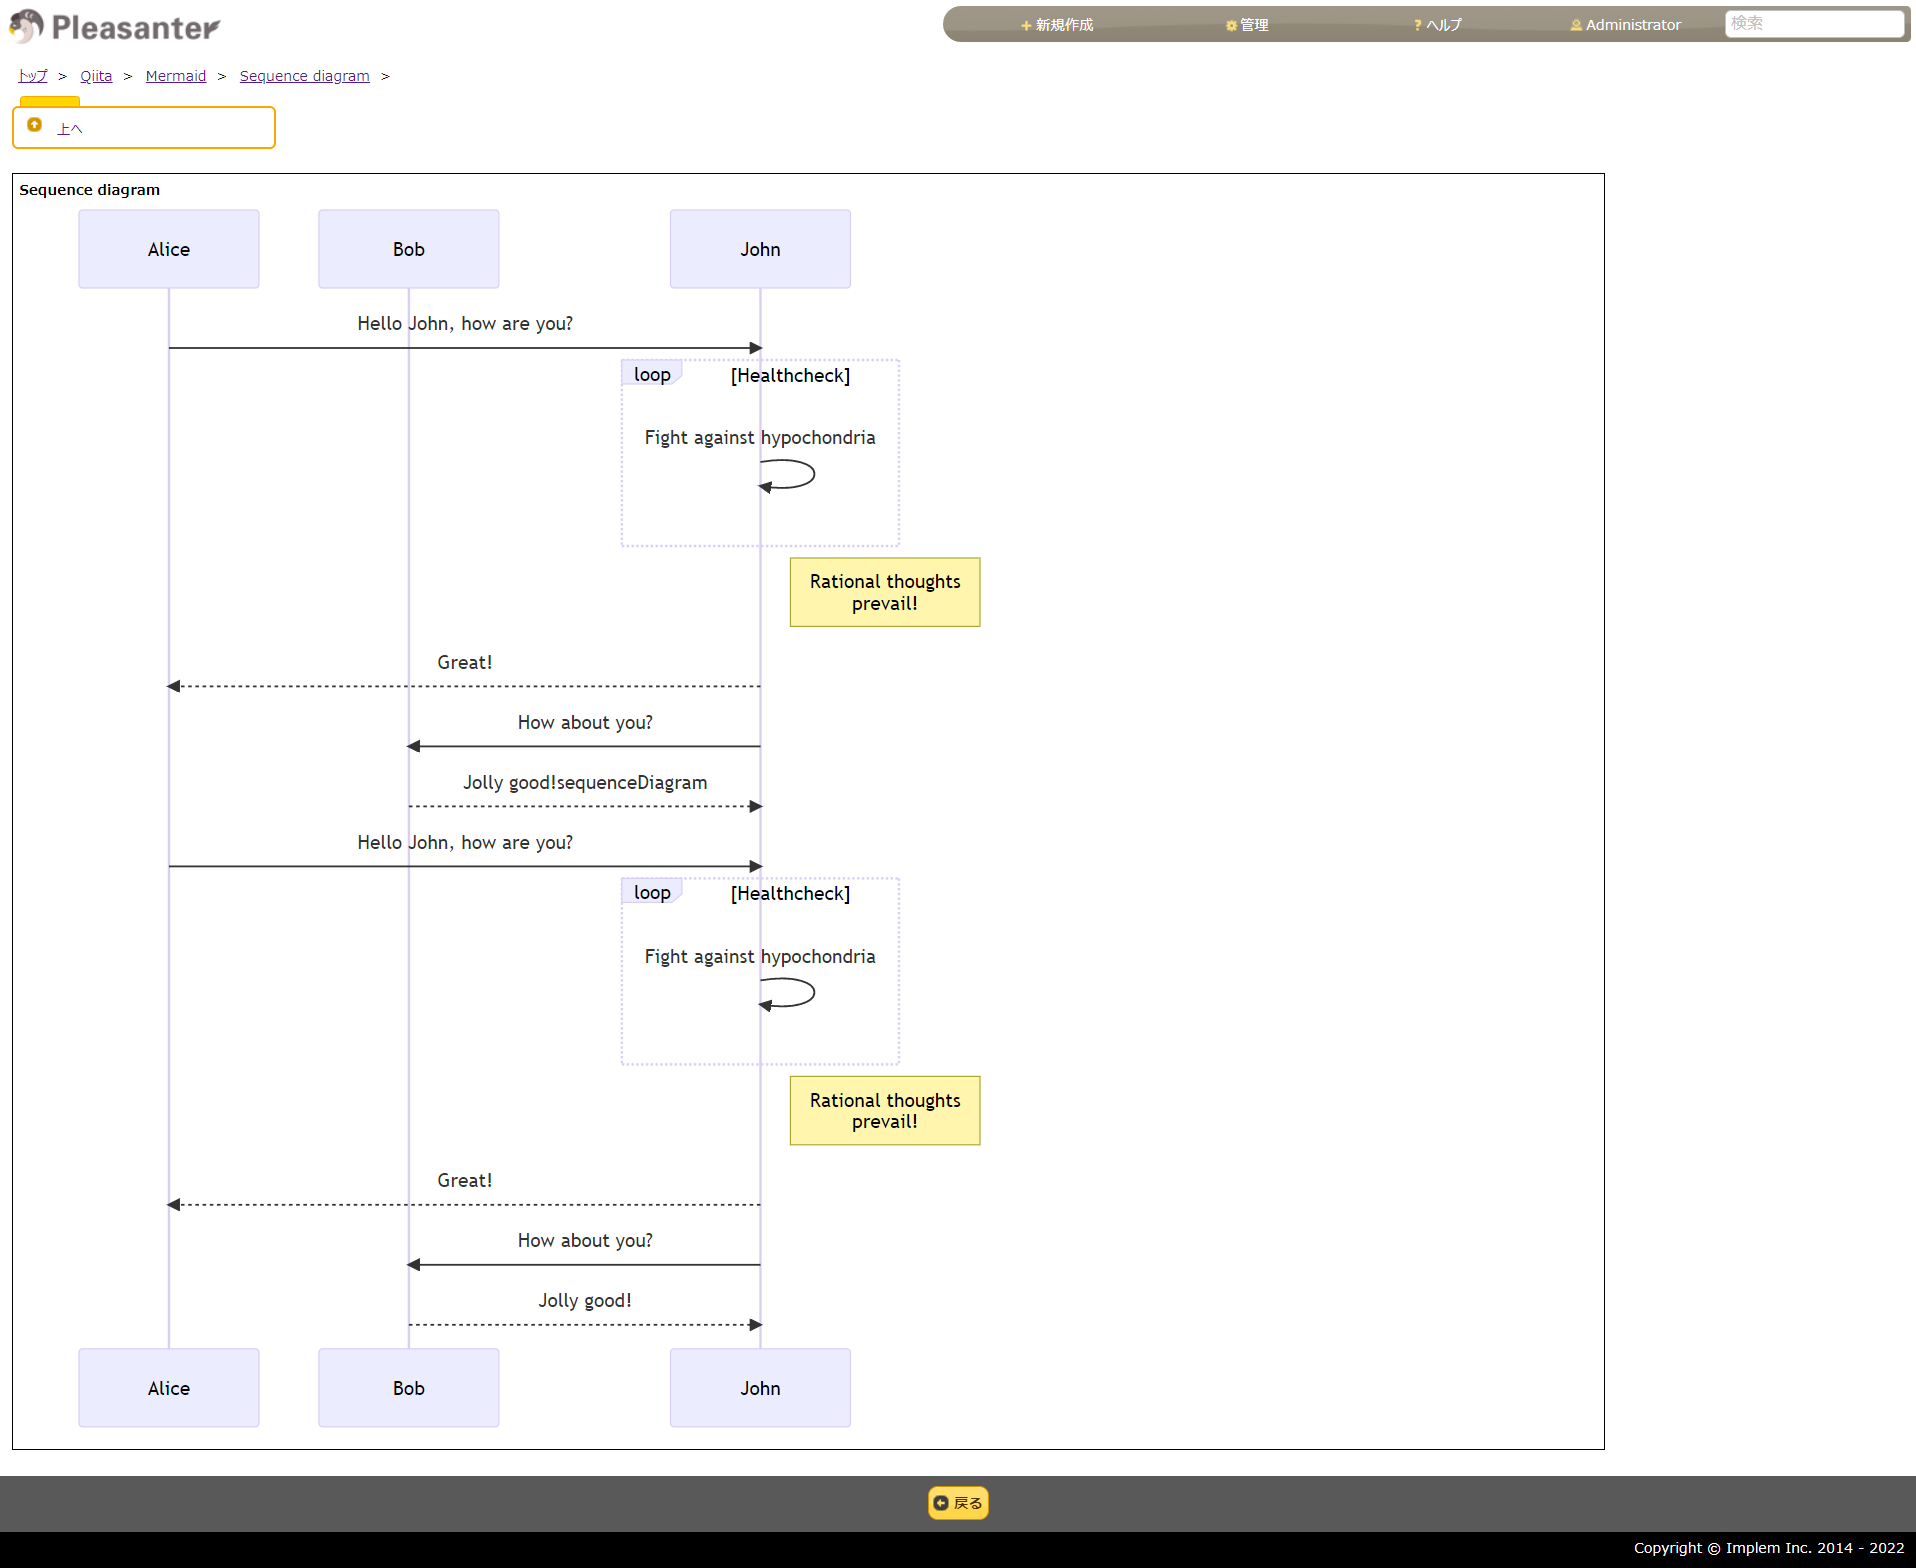
シーケンス図
$p.events.on_grid_load = function () {
    $("#SiteMenu").after('<div id="table_menu" style="display:inline-block;vertical-align:top"></div>');
    $('#table_menu').css("width","calc(100% - 250px)").css("padding","0px 0px").css("margin-top","10px");
    html = '<div style="margin-bottom:30px;white-space: pre-line;border:1px solid black; padding:5px;">';
    html += '<span style="font-weight:bold">Sequence diagram</span><br/>';
    html += '<div class="mermaid">';
    html += `
        sequenceDiagram
            participant Alice
            participant Bob
            Alice->>John: Hello John, how are you?
            loop Healthcheck
                John->>John: Fight against hypochondria
            end
            Note right of John: Rational thoughts <br/>prevail!
            John-->>Alice: Great!
            John->>Bob: How about you?
            Bob-->>John: Jolly good!sequenceDiagram
            participant Alice
            participant Bob
            Alice->>John: Hello John, how are you?
            loop Healthcheck
                John->>John: Fight against hypochondria
            end
            Note right of John: Rational thoughts <br/>prevail!
            John-->>Alice: Great!
            John->>Bob: How about you?
            Bob-->>John: Jolly good!
    `;
    html += '</div>';
    $('#table_menu').prepend(html);
}
結果
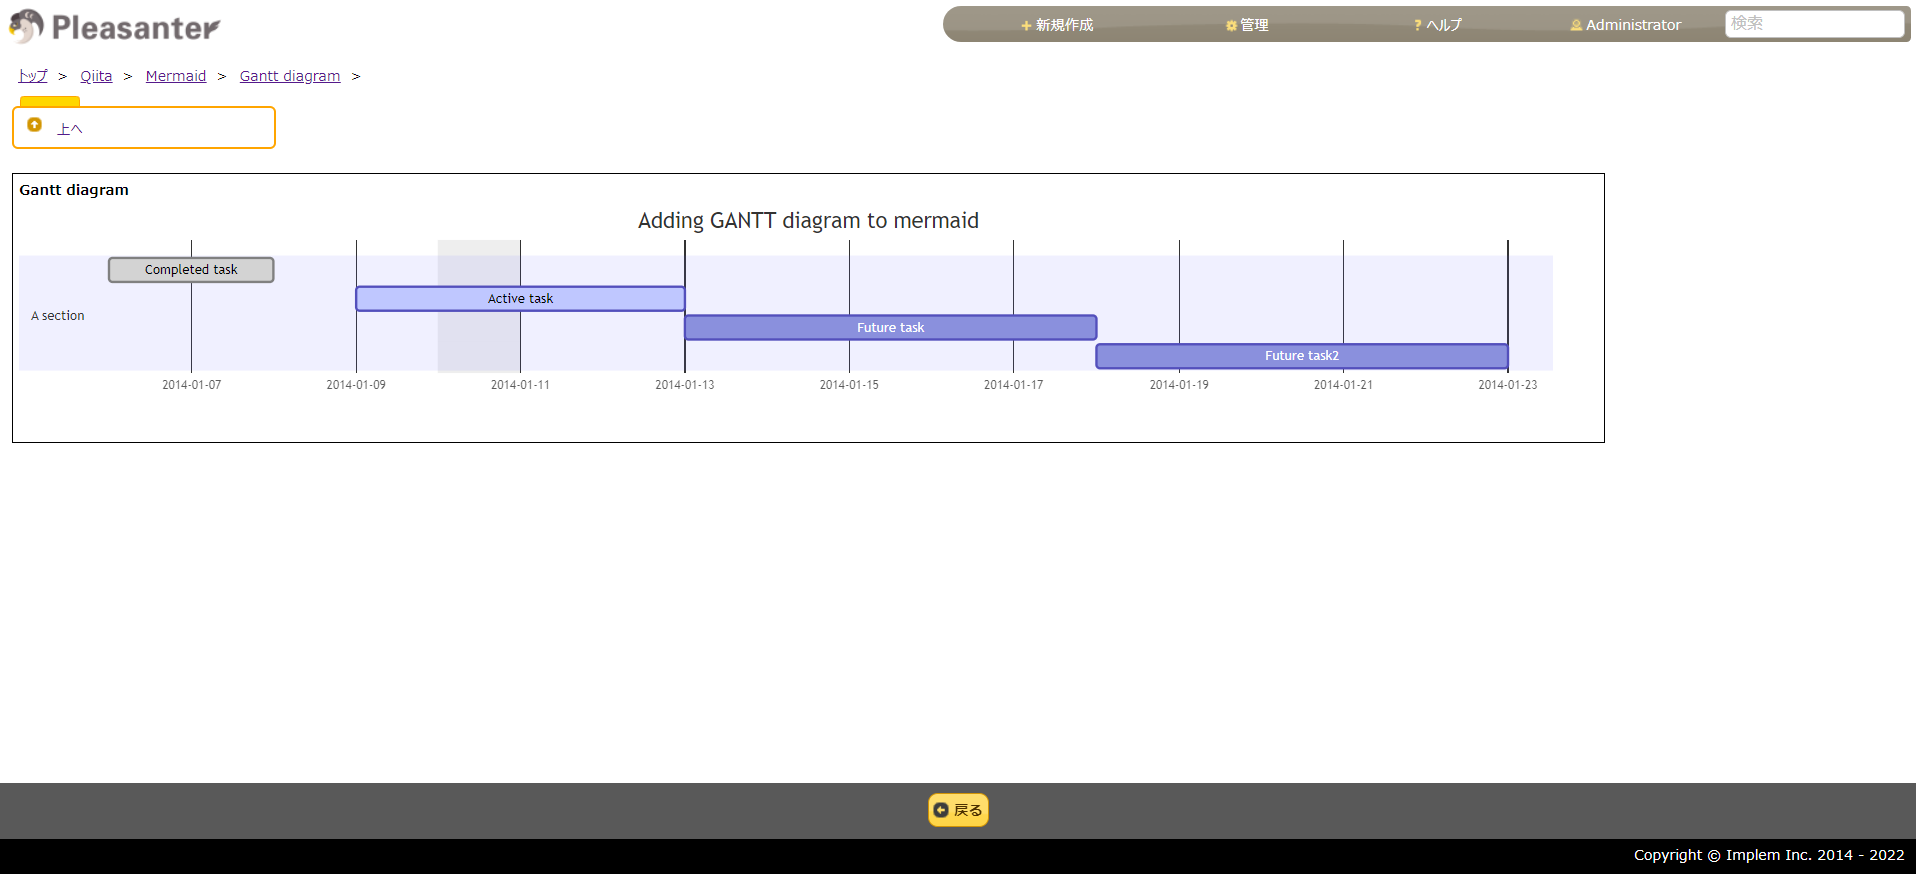
ガントチャート
$p.events.on_grid_load = function () {
    $("#SiteMenu").after('<div id="table_menu" style="display:inline-block;vertical-align:top"></div>');
    $('#table_menu').css("width","calc(100% - 250px)").css("padding","0px 0px").css("margin-top","10px");
    html = '<div style="margin-bottom:30px;white-space: pre-line;border:1px solid black; padding:5px;">';
    html += '<span style="font-weight:bold">Gantt diagram</span><br/>';
    html += '<div class="mermaid">';
    html += `
        gantt
        dateFormat  YYYY-MM-DD
        title Adding GANTT diagram to mermaid
        excludes weekdays 2014-01-10

        section A section
        Completed task            :done,    des1, 2014-01-06,2014-01-08
        Active task               :active,  des2, 2014-01-09, 3d
        Future task               :         des3, after des2, 5d
        Future task2               :         des4, after des3, 5d
    `;
    html += '</div>';
    $('#table_menu').prepend(html);
}
結果
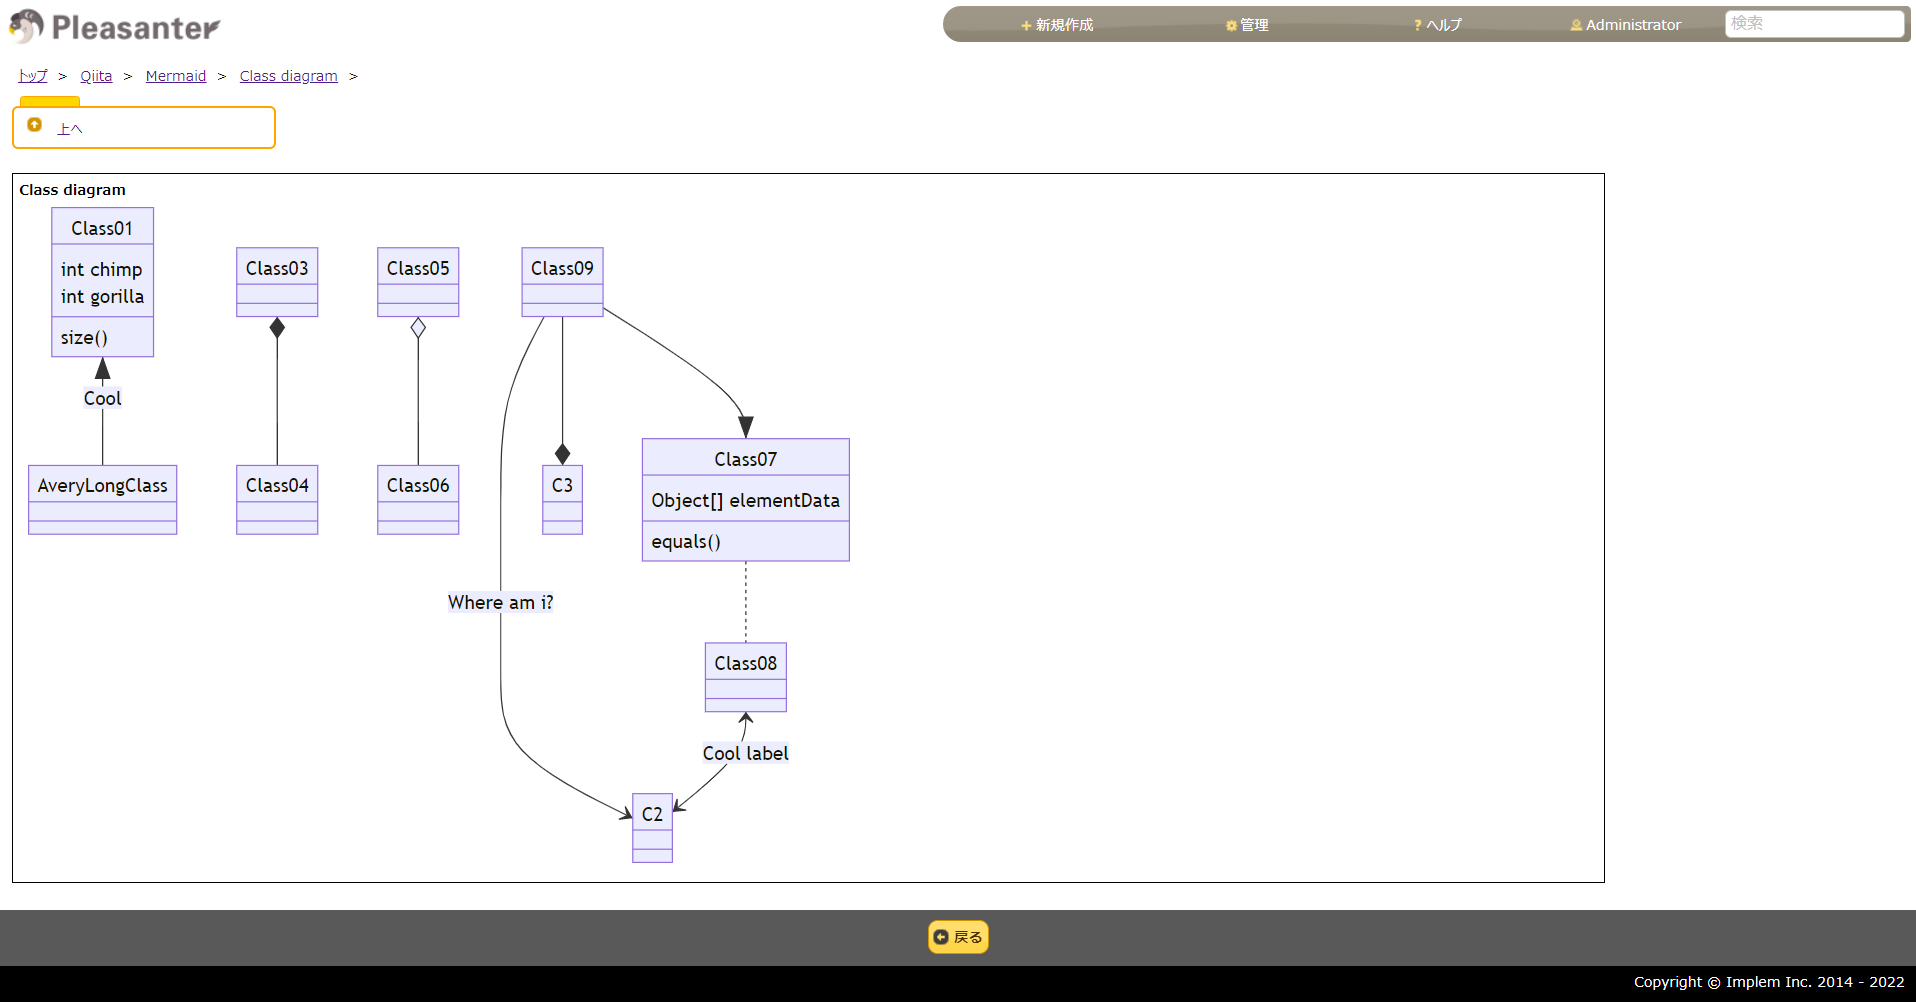
クラス図
$p.events.on_grid_load = function () {
    $("#SiteMenu").after('<div id="table_menu" style="display:inline-block;vertical-align:top"></div>');
    $('#table_menu').css("width","calc(100% - 250px)").css("padding","0px 0px").css("margin-top","10px");
    html = '<div style="margin-bottom:30px;white-space: pre-line;border:1px solid black; padding:5px;">';
    html += '<span style="font-weight:bold">Class diagram</span><br/>';
    html += '<div class="mermaid">';
    html += `
        classDiagram
        Class01 <|-- AveryLongClass : Cool
        Class03 *-- Class04
        Class05 o-- Class06
        Class07 .. Class08
        Class09 --> C2 : Where am i?
        Class09 --* C3
        Class09 --|> Class07
        Class07 : equals()
        Class07 : Object[] elementData
        Class01 : size()
        Class01 : int chimp
        Class01 : int gorilla
        Class08 <--> C2: Cool label
    `;
    html += '</div>';
    $('#table_menu').prepend(html);
}
結果
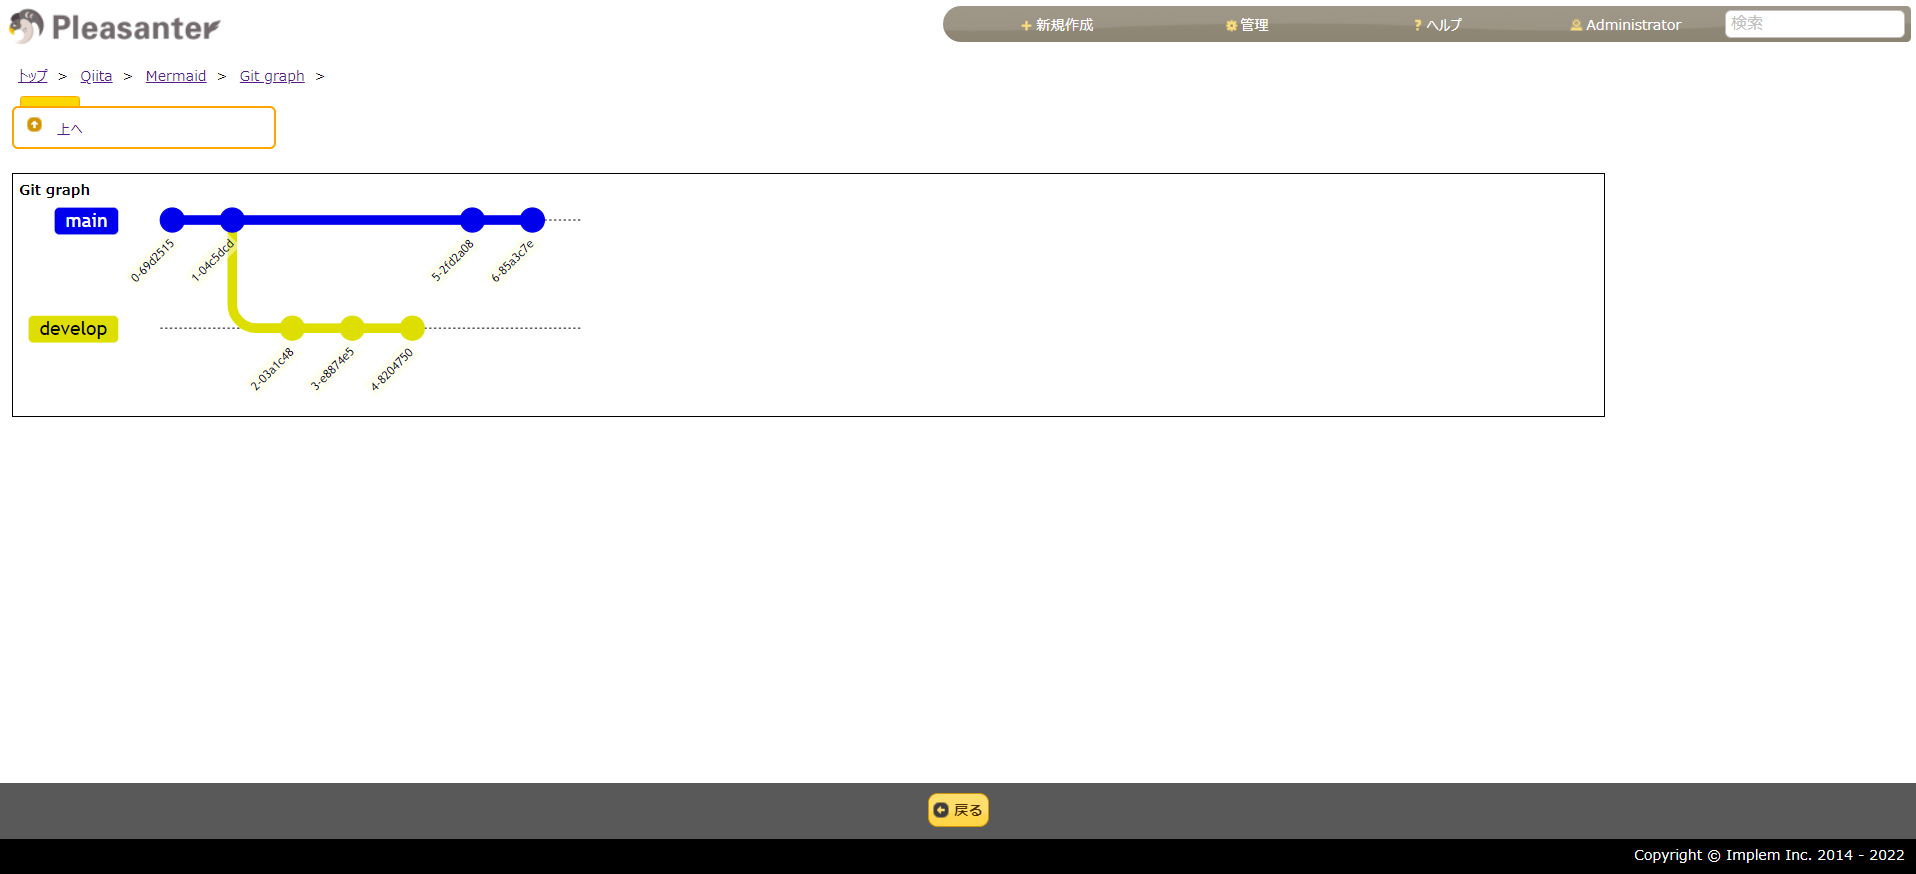
Gitグラフ
$p.events.on_grid_load = function () {
    $("#SiteMenu").after('<div id="table_menu" style="display:inline-block;vertical-align:top"></div>');
    $('#table_menu').css("width","calc(100% - 250px)").css("padding","0px 0px").css("margin-top","10px");
    html = '<div style="margin-bottom:30px;white-space: pre-line;border:1px solid black; padding:5px;">';
    html += '<span style="font-weight:bold">Git graph</span><br/>';
    html += '<div class="mermaid">';
    html += `
        gitGraph
           commit
           commit
           branch develop
           commit
           commit
           commit
           checkout main
           commit
           commit
    `;
    html += '</div>';
    $('#table_menu').prepend(html);
}
結果
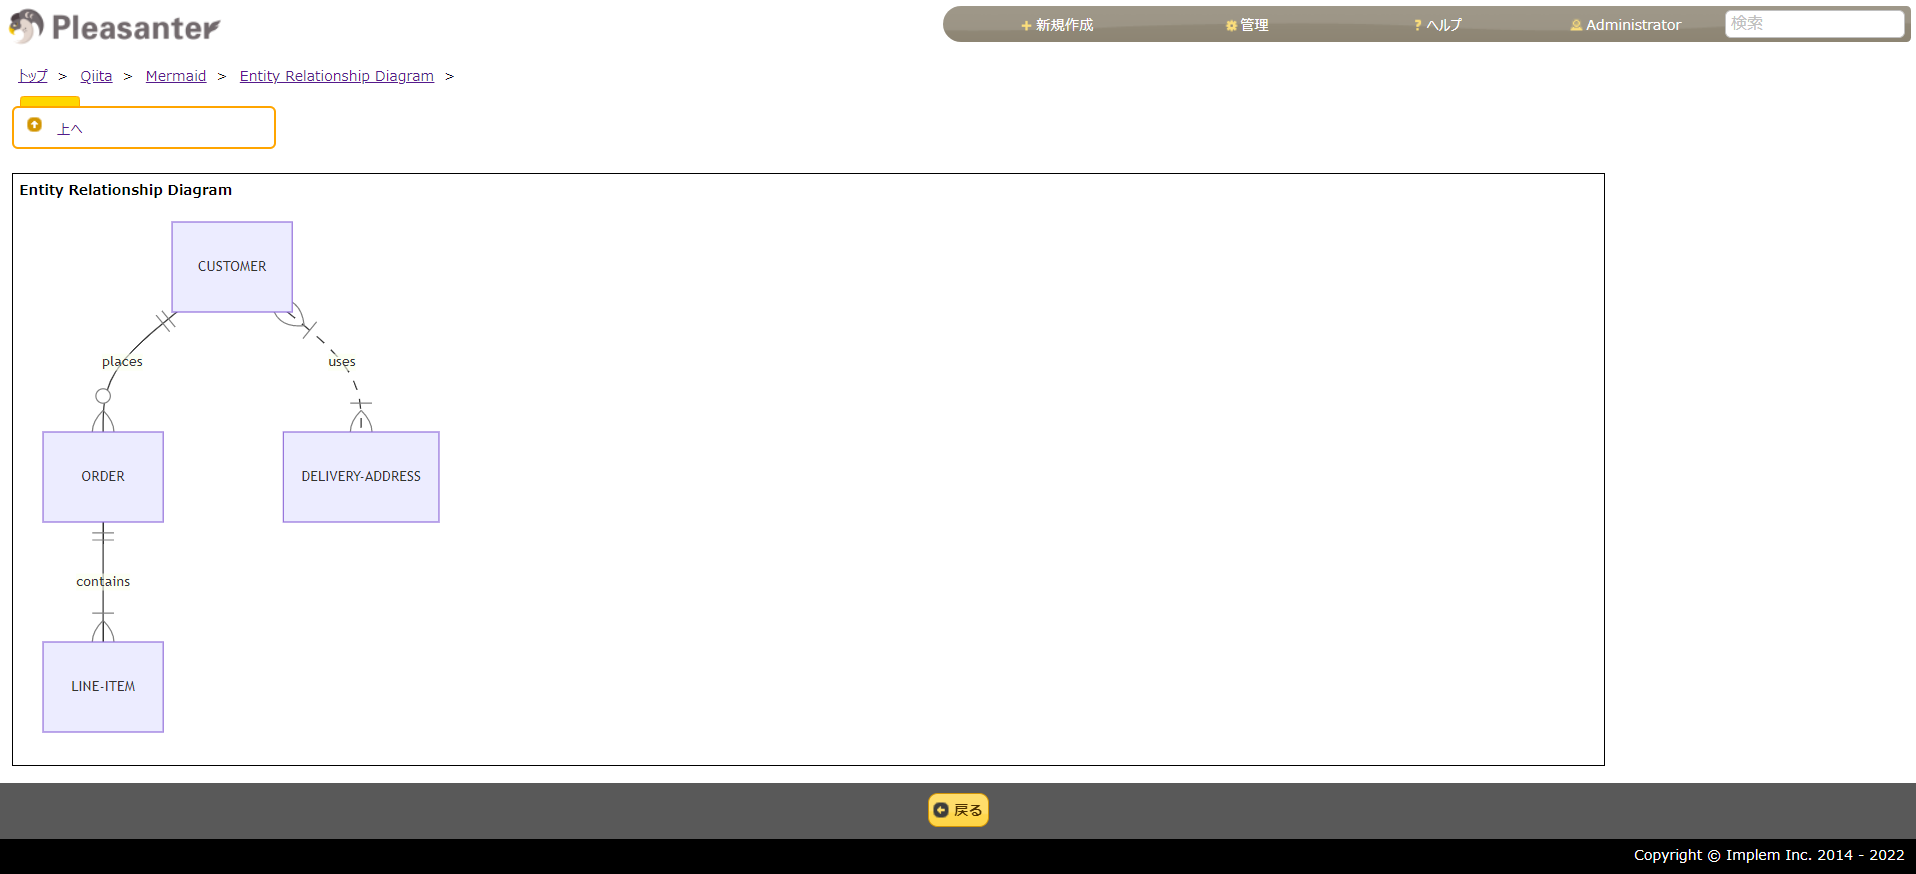
ER図
$p.events.on_grid_load = function () {
    $("#SiteMenu").after('<div id="table_menu" style="display:inline-block;vertical-align:top"></div>');
    $('#table_menu').css("width","calc(100% - 250px)").css("padding","0px 0px").css("margin-top","10px");
    html = '<div style="margin-bottom:30px;white-space: pre-line;border:1px solid black; padding:5px;">';
    html += '<span style="font-weight:bold">Entity Relationship Diagram</span><br/>';
    html += '<div class="mermaid">';
    html += `
        erDiagram
            CUSTOMER ||--o{ ORDER : places
            ORDER ||--|{ LINE-ITEM : contains
            CUSTOMER }|..|{ DELIVERY-ADDRESS : uses
    `;
    html += '</div>';
    $('#table_menu').prepend(html);
}
結果
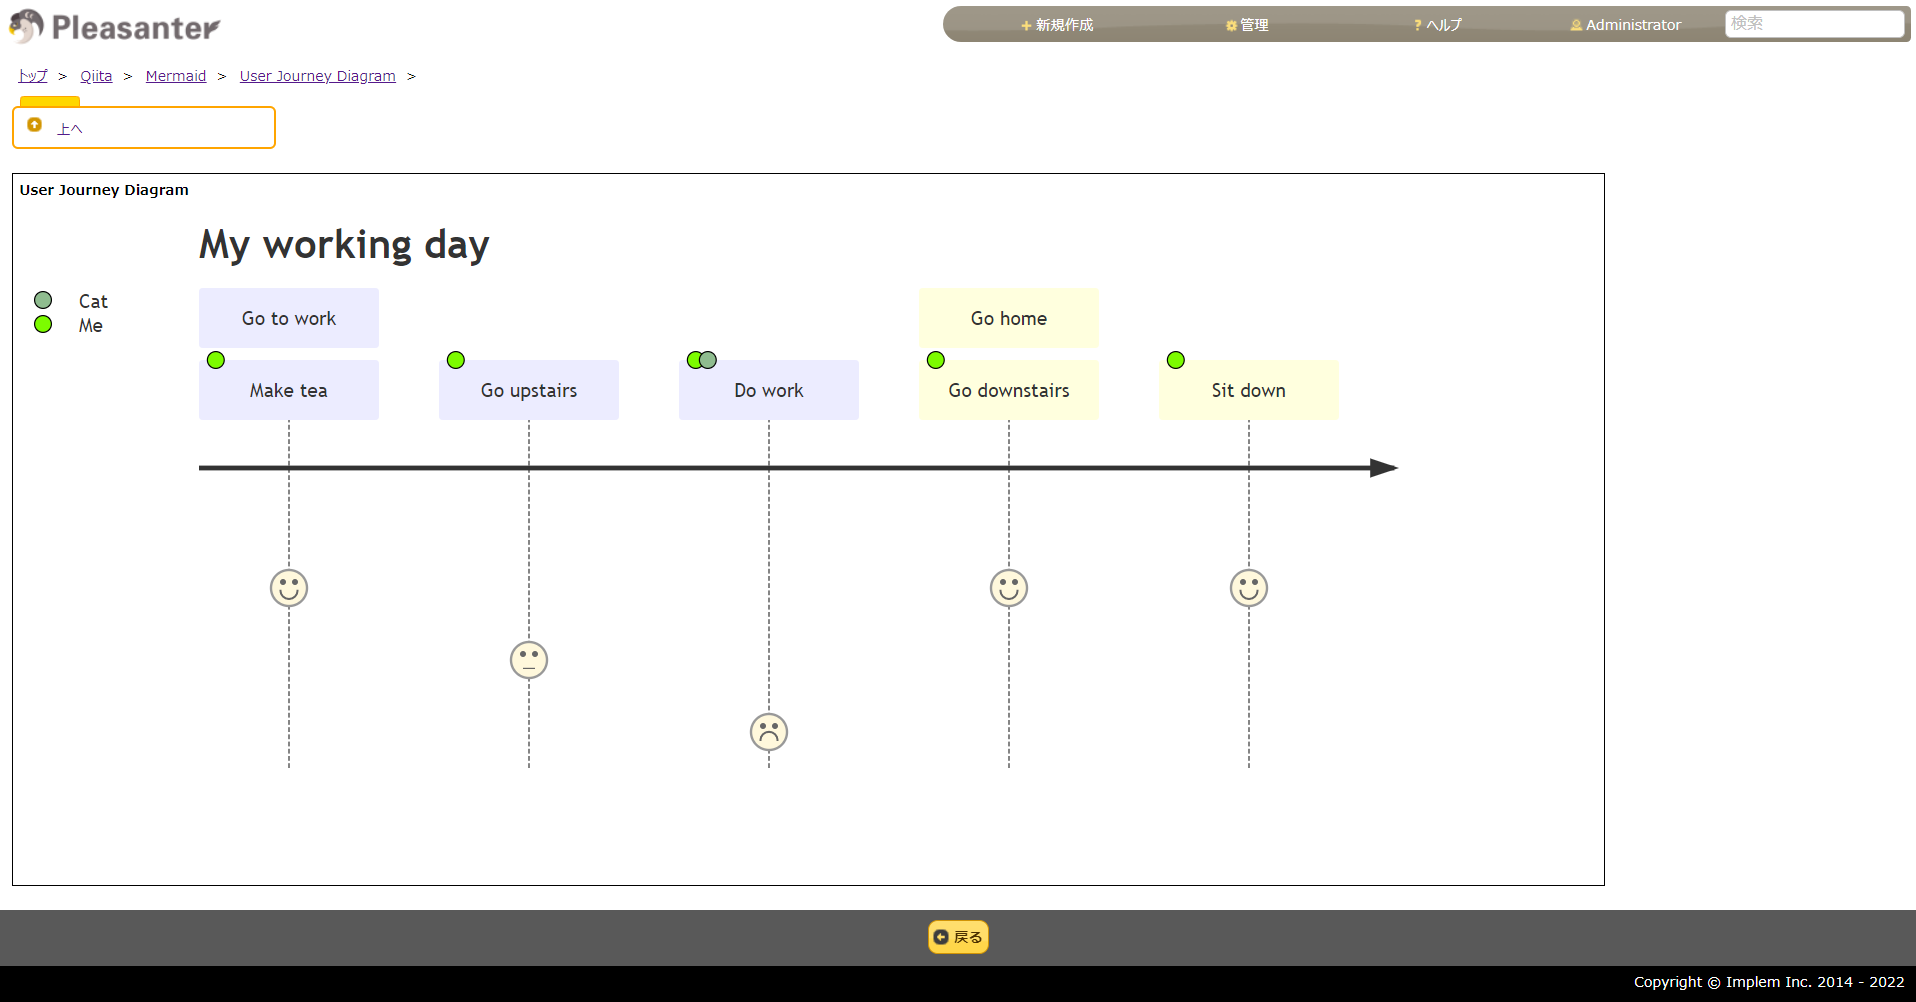
カスタマージャーニーマップ
$p.events.on_grid_load = function () {
    $("#SiteMenu").after('<div id="table_menu" style="display:inline-block;vertical-align:top"></div>');
    $('#table_menu').css("width","calc(100% - 250px)").css("padding","0px 0px").css("margin-top","10px");
    html = '<div style="margin-bottom:30px;white-space: pre-line;border:1px solid black; padding:5px;">';
    html += '<span style="font-weight:bold">User Journey Diagram</span><br/>';
    html += '<div class="mermaid">';
    html += `
        journey
            title My working day
            section Go to work
              Make tea: 5: Me
              Go upstairs: 3: Me
              Do work: 1: Me, Cat
            section Go home
              Go downstairs: 5: Me
              Sit down: 5: Me
    `;
    html += '</div>';
    $('#table_menu').prepend(html);
}
結果
おわりに
簡単な設定でMermaidが使えるようになり、テキストのスクリプトだけできれいなダイアグラム・チャートを書くことができました!利用者へのガイドとしてテーブルの関連図や業務のワークフロー図などを表現するのに使えたりするかもしれませんね。
参考リンク
- mermaid - Markdownish syntax for generating flowcharts, sequence diagrams, class diagrams, gantt charts and git graphs.
- mermaid-js/mermaid: Generation of diagrams like flowcharts or sequence diagrams from text in a similar manner as markdown
- Pleasanterユーザマニュアル - 開発者向け機能:拡張機能:拡張HTML
- Pleasanterユーザマニュアル - テーブルの管理:スクリプト
- プリザンターに自動ふりがな入力機能と郵便番号変換機能を追加する
- 【Mermaidの紹介】Qiitaでダイアグラム・チャートが簡単に書けるようになりました!