はじめに
アラートが鳴るならそれをトリガーに自動的に何かしたい。
- アラートをJIRAでチケット管理したり
- 詳細情報をさらに取得してslackなどへの通知をリッチにしたり
- Auto Healのための何かスクリプトなど叩いたり
なので「アラートをJIRAでチケット管理したい」をalertmanagerのwebhook_configsを使ってやってみた。
alertmanagerのwebhook_configsとは?
configurationのwebhook_configに公式説明があるが、任意のwebhook接続先へアラート情報を送信できるものです。(実際にはwebhook_configsだが公式だとsがない...)
送られるアラート情報例としては以下のようなJSONがalertmangerからwebhook_configで指定した接続先にPOSTされる。
webhook_sameple.json
{
  "receiver": "webhook-trouble-handler",
  "status": "firing",
  "alerts": [
    {
      "status": "firing",
      "labels": {
        "alertname": "sample_error",
        "category": "pushgateway",
        "channel": "sample",
        "environment": "hoge-env",
        "exported_instance": "TEST_INSTANCE",
        "exported_job": "sample_exporter",
        "instance": "localhost:9091",
        "job": "pushgateway",
        "severity": "critical"
      },
      "annotations": {
        "resolved_text": "SAMPLE is OK.",
        "summary": "SAMPLE is NG."
      },
      "startsAt": "2017-12-10T23:20:08.822+09:00",
      "endsAt": "0001-01-01T00:00:00Z",
      "generatorURL": "http://localhost/prometheus/graph?XXXXXXXXXXXXXXXX"
    }
  ],
  "groupLabels": {
    "alertname": "sample_error",
    "channel": "sample",
    "instance": "localhost:9091",
    "job": "pushgateway"
  },
  "commonLabels": {
    "alertname": "sample_error",
    "category": "pushgateway",
    "channel": "sample",
    "environment": "hoge-env",
    "exported_instance": "TEST_INSTANCE",
    "exported_job": "sample_exporter",
    "instance": "localhost:9091",
    "job": "pushgateway",
    "severity": "critical"
  },
  "commonAnnotations": {
    "resolved_text": "SAMPLE is OK.",
    "summary": "SAMPLE is NG."
  },
  "externalURL": "/alertmanager",
  "version": "3",
  "groupKey": "000000000000000000"
}
やること
以下のような構成のため、
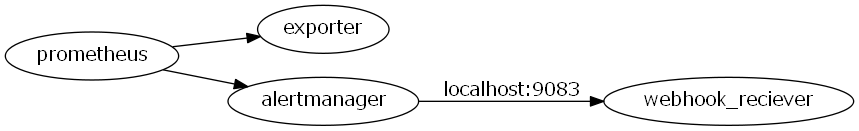
-
alertmanagerのconfigでwebhook_configs設定を追加 - その接続先を準備(今回はpythonで
webhook_reciever.pyを実装)
が必要。
1. alertmanagerの設定
webhook-trouble-handler recieverを定義する。
-
continue: trueをつけてroutesを定義- ここではJIRAを作る以外にもslackへ通知したいため、別の
recieverにもroutes分岐させる
- ここではJIRAを作る以外にもslackへ通知したいため、別の
-
webhook_reciever.pyへの接続先としてwebhook_configsを定義
alertmanager/config.yml
...
  routes:
  - match:
      channel: sample
    routes:
    - match:
        severity: critical
      receiver: webhook-trouble-handler
      repeat_interval: 1680h
      continue: true
...
- name: 'webhook-trouble-handler'
  webhook_configs:
    - url: 'http://localhost:9083'
      send_resolved: true
...
2. webhook_reciever.pyの実装
機能としては、
-
alertmanagerからのPOSTされたアラート情報をJSONとして受け取り - アラート情報からJIRAチケットを作成する
- 簡易web server(9083 portをlisten)
webhook_reciever.py
import json
import logging
from http.server import BaseHTTPRequestHandler
from http.server import HTTPServer
from jira import JIRA # install this package by pip in advance

logging.basicConfig(level=logging.DEBUG, format="%(asctime)-15s %(message)s")
requests_log = logging.getLogger("requests.packages.urllib3")
requests_log.setLevel(logging.DEBUG)
requests_log.propagate = True

class TroubleHandler(BaseHTTPRequestHandler):
    def do_POST(self):
        self.send_response(200)
        self.end_headers()
        data = json.loads(self.rfile.read(int(self.headers['Content-Length'])))

        alert_data = self.build_alert_data(data)
        logging.info("recieved data:%s" % alert_data)
        self.create_alert_jira_issue(alert_data, data["status"])

    def build_alert_data(self, data):
        # customize by your metrics
        alert_data = {
            "status": data["status"],
            "alertname": data["alerts"][0]["labels"]["alertname"],
            "starts_at": data["alerts"][0]["startsAt"],
            "summary": data["alerts"][0]["annotations"]["summary"],
            "group_key": data["groupKey"]
        }
        return alert_data

    def create_alert_jira_issue(self, alert_data, alert_status):
        j = JiraPoster()
        j.create_alert_jira(alert_data)

class JiraPoster():
    def __init__(self):
        # fill your JIRA info
        server = "https://***********.atlassian.net/"
        basic_auth = ('*************', '***********')
        self.jira = JIRA(server=server, basic_auth=basic_auth)

    def create_alert_jira(self, data):
        # customize as you want
        issue_dict = {
            'project': {"key": "TEST"},
            'summary': "[ALERT] %s" % data["summary"],
            'description': "h4.alertname\n%s\nh4.starts at\n%s\nh4.summary\n%s\nh4.group key\n%s" % (data["alertname"], data["starts_at"], data["summary"], data["group_key"]),
            'issuetype': {'name': 'Task'},
        }
        if data["status"] == "firing":
                self.jira.create_issue(fields=issue_dict)

if __name__ == "__main__":
    httpd = HTTPServer(('', 9083), TroubleHandler)
    httpd.serve_forever()
説明の都合省くが実用性を求めるなら以下などもやりがち。
- 監視metricsによっては
labelにいろいろ情報が載ってるのでそれも記載 -
group keyでresolved時にはその旨をコメント追記やチケットステータス変更 - host nameみたいな概念が監視対象にあればそれをJQLで検索して既存チケットないか?探してあれば新チケット作らずコメント追記のみしてチケット節約
- kinabaや管理APIなどあればそこからアラート時のlogや状態をとってきて追記
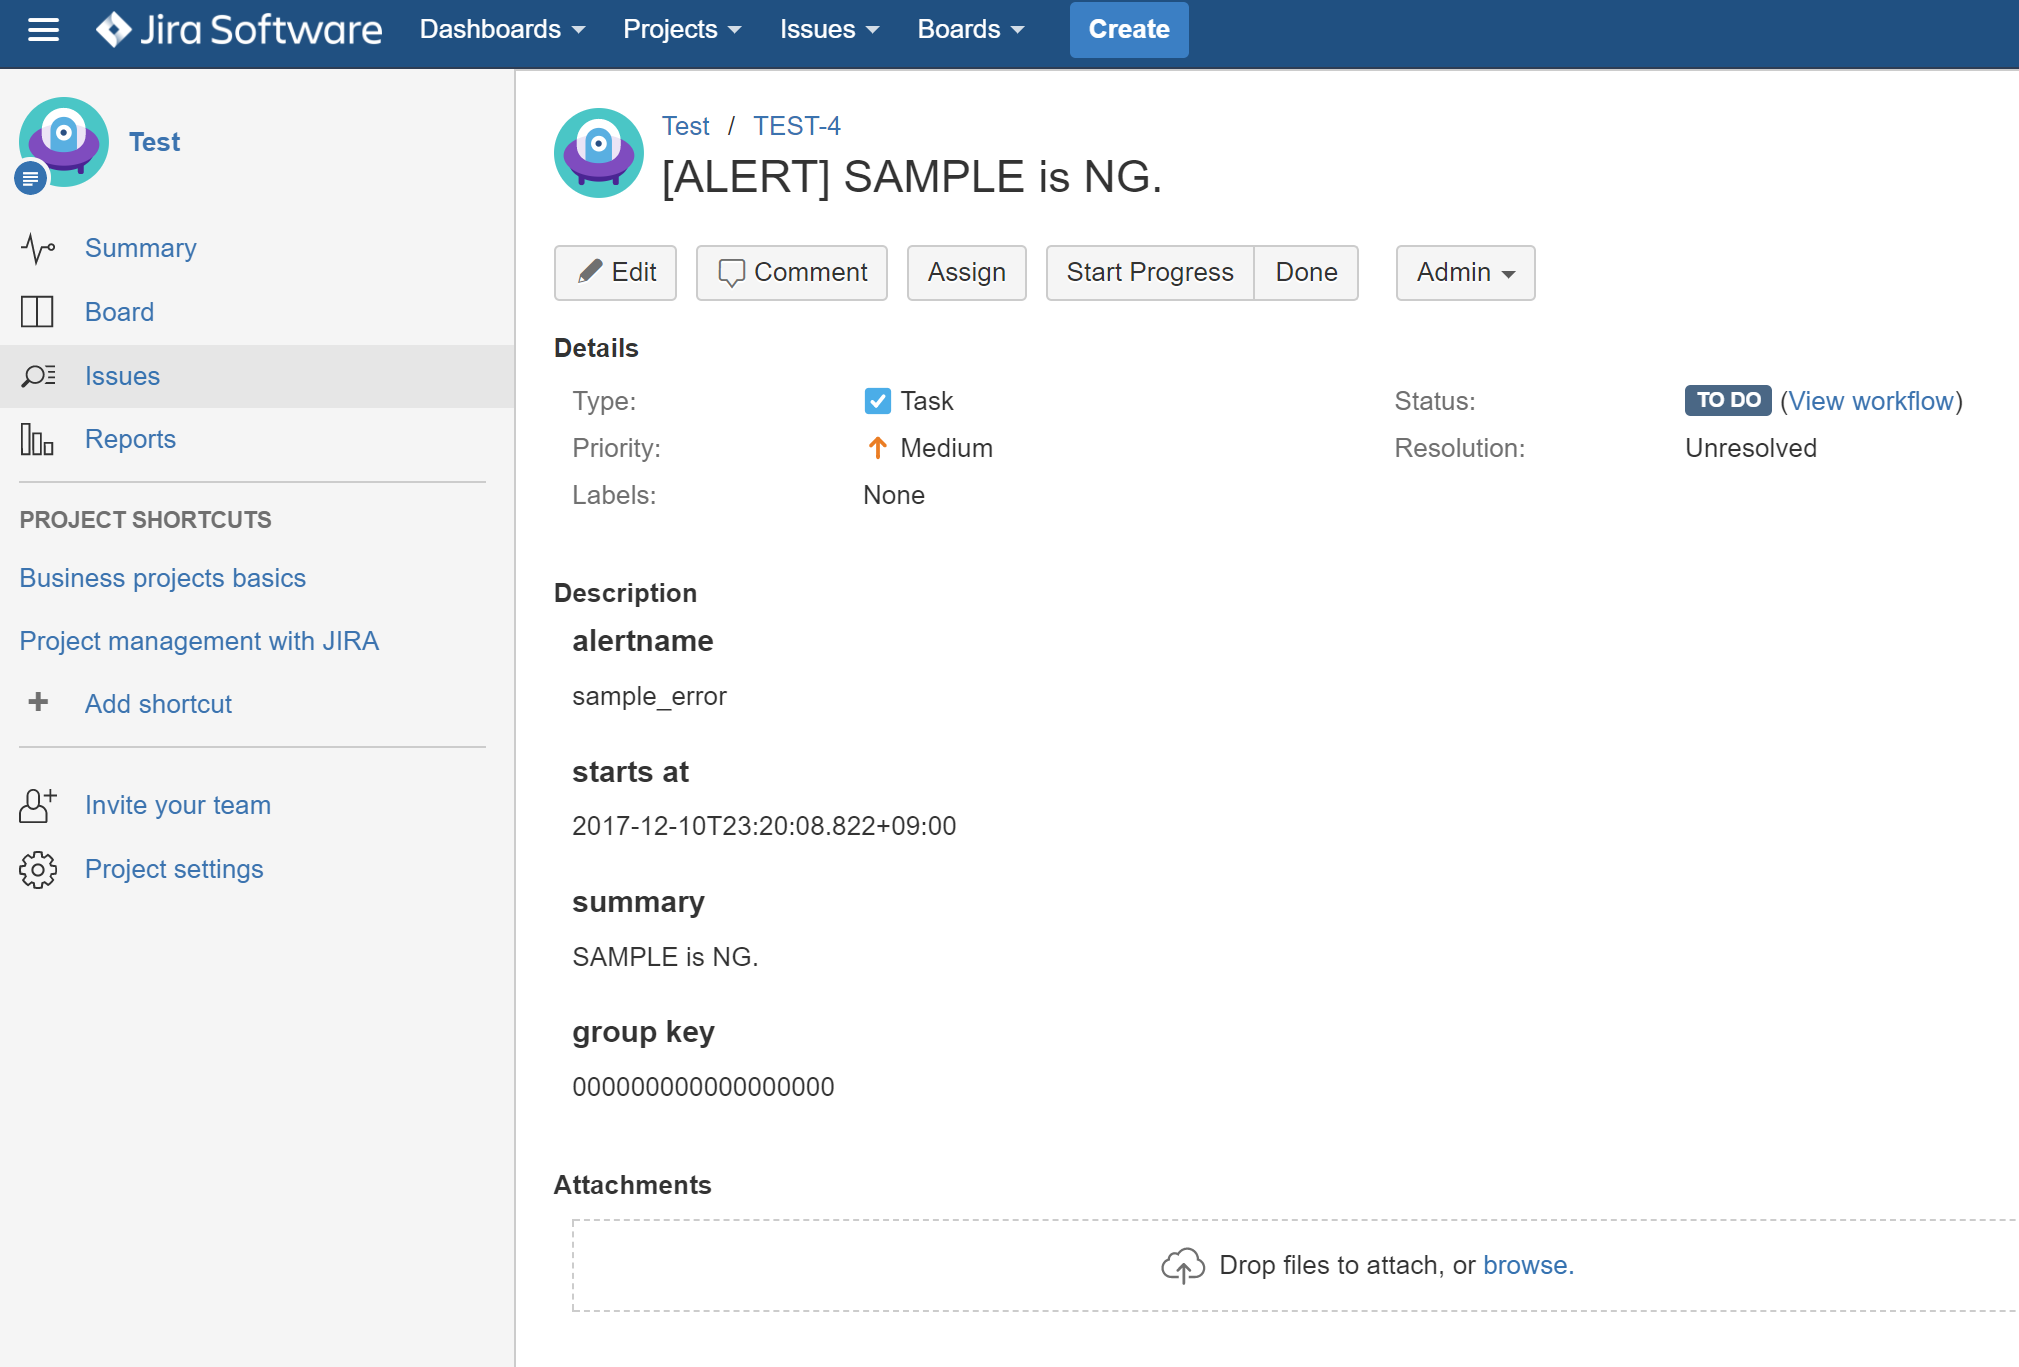
動作確認
できた!
終わりに
- 便利
- prometheusのアラートの「その後」をイベント駆動でカスタムできてよい
- 気になる
- alertmanagerとwebhook内、どちらで処理をdispatchすると運用上きれいか
- もしcustom exporterで自サービスAPI見てて、webhookでも追加情報をそこから取得したいとなると監視観点で自サービス叩くAPIが複数箇所あってきもい
- 今後
- 今回のトラブルチケット管理的な話だとslack reactionを使って誰がハンドルしてるか?などpagerdutyっぽいのの実装も気軽そうなのでfuture work
以上。