シリーズ
ElasticsearchのFrozenデータティアにデータが入るのをテストしてみた (1)
ElasticsearchのFrozenデータティアにデータが入るのをテストしてみた (2)
はじめに
こんにちは。Elasticのソリューションアーキテクトの関屋です。
前回の1回目の記事では、Frozenティアを使うための設定を確認しました。今回は、Rallyという負荷ツールを使い、もう少し実際の運用に近い様子でデータの動き方を確認していきます。
テスト環境
- Elastic Cloudのバージョン8.8.0, GCPの asia-northeast1リージョンを利用
- Hardware Profile: CPU Optimizedを選択
- Hot Tier: 45 GB Storage| 1 GB RAM | Up to 8 vcpu を1 Availability Zoneとして選択。(Hotで設定できる一番小さい構成)
- Frozen Tier: 6.25 TB Storage | 4 GB RAM | Up to 2.5 vcpu を1 Availability Zoneとして選択。(これもFrozenで設定できる一番小さい構成)
- RallyはローカルのMac PCにインストールして実施
テスト1: Hotのみの場合の結果(Frozenは使わない)
ILMポリシーは以下のように、Hotのみでロールオーバーは50 GB溜まるか、30日経つまで発生しない構成です(こちらはログのデフォルトポリシーの設定)
{
  "policy" : {
    "phases" : {
      "hot" : {
        "min_age" : "0ms",
        "actions" : {
          "rollover" : {
            "max_size" : "50gb",
            "max_age" : "30d"
          }
        }
      }
    }
  }
}
結果:
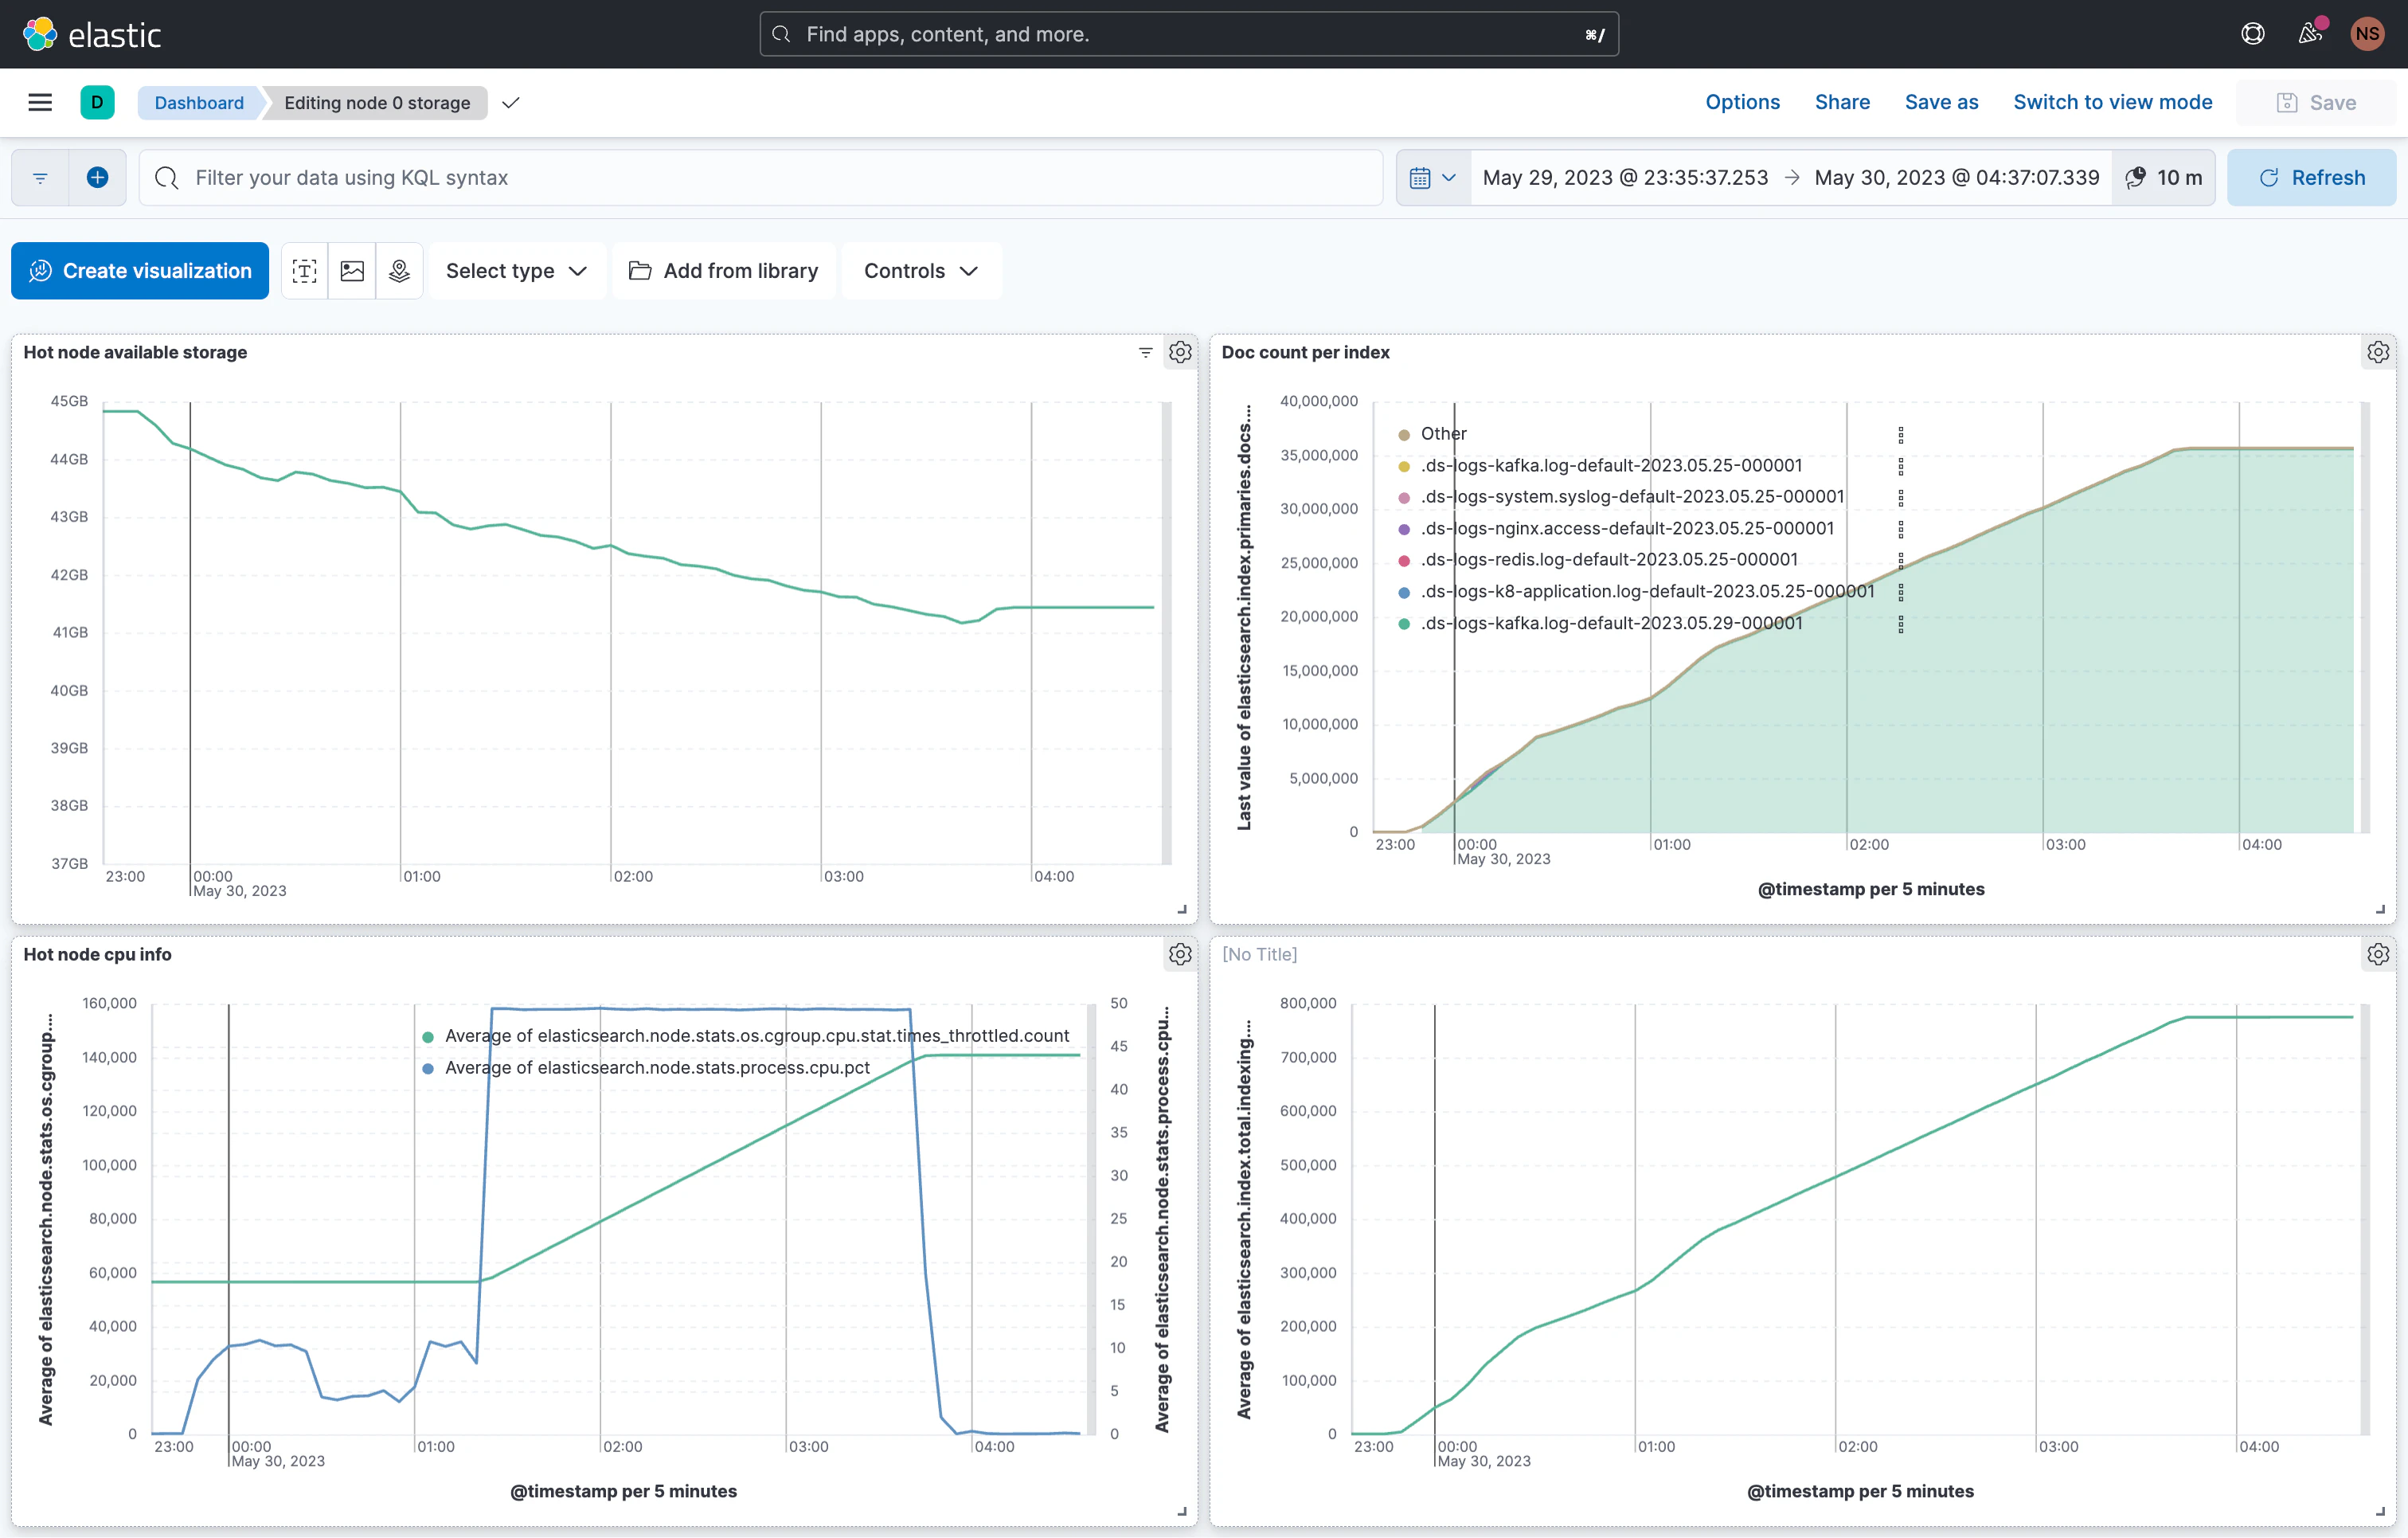
- HotノードのIndex1つが大きくなっていっています。(右上のグラフ)
- Hotノードのストレージの空きがそれに伴い減少しています。 (45GB -> 41.5GB)(左上のグラフ)
テスト2: Frozenを有効化
Frozenを有効化し、HotのIndexのロールオーバが500 MB溜まったら行われる条件としています。ロールオーバー後すぐにFrozenに移動させるためにfrozenのmin_ageは0dです。
{
  "policy": {
    "phases": {
      "hot": {
        "min_age": "0ms",
        "actions": {
          "rollover": {
            "max_size": "500mb"
          }
        }
      },
      "frozen": {
        "min_age": "0d",
        "actions": {
          "searchable_snapshot": {
            "snapshot_repository": "found-snapshots"
          }
        }
      }
    }
  }
}
結果:
- Indexがロールオーバーし、順次Frozenに移行(ロールオーバー後、約30分くらいしてからFrozenに移動していた) (右上のグラフ)
- Hotノードのストレージの使用は限定的。空きが44.5 GB ~ 43.5 GBあたりを推移。(左上のグラフ)

Frozenに対する検索
Frozenにあるデータを検索した際どうなるかを確認してみます。
以下のコマンドをDev Toolsから実行し、一度Frozenノードに読み込まれているキャッシュをクリアしてから統計値を確認します。
POST /_searchable_snapshots/cache/clear
GET /_searchable_snapshots/cache/stats
{
  "nodes": {
    "B4XI4QF-SCGOoccs-4-aNw": {
      "shared_cache": {
        "reads": 0,
        "bytes_read_in_bytes": 0,
        "writes": 0,
        "bytes_written_in_bytes": 0,
        "evictions": 0,
        "num_regions": 0,
        "size_in_bytes": 0,
        "region_size_in_bytes": 16777216
      }
    },
    "z1pa00yOSZK7Ita4vr8h3A": {
      "shared_cache": {
        "reads": 1464978,
        "bytes_read_in_bytes": 1504016278,
        "writes": 154,
        "bytes_written_in_bytes": 2583691264,
        "evictions": 139,
        "num_regions": 21888,
        "size_in_bytes": 367219703808,
        "region_size_in_bytes": 16777216
      }
    }
  }
}
今回は下のz1pa00yOSZK7Ita4vr8h3AのNode IDがFrozen ノードです。
以下の2つの変化に着目します。
- writes ... オブジェクトストレージのスナップショットからFrozenノードのキャッシュに書き込まれた総回数
- bytes_written_in_bytes ... 上記で書き込まれた総バイト数
では、検索をかけます。ログは2023-01-01 ~ 2023-01-15の日付が負荷テストで日付順にアップされておりFrozenになっているのはデータは、正確には細く調べないと分かりませんが、早い日付のほうです。
GET /logs-kafka.log-default/_search
{
  "track_total_hits": false,
  "sort": [
    {
      "@timestamp": {
        "order": "desc",
        "unmapped_type": "boolean"
      }
    }
  ],
  "fields": [
    {
      "field": "*",
      "include_unmapped": "true"
    },
    {
      "field": "@timestamp",
      "format": "strict_date_optional_time"
    }
  ],
  "size": 1000,
  "_source": false,
  "query": {
    "bool": {
      "must": [],
      "filter": [
        {
          "range": {
            "@timestamp": {
              "format": "strict_date_optional_time",
              "gte": "2023-01-01T00:00:00.000Z",
              "lte": "2023-01-06T06:30:00.000Z"
            }
          }
        }
      ]
    }
  }
}
{
  "took": 4829,
  "timed_out": false,
  "_shards": {
    "total": 4,
    "successful": 4,
    "skipped": 0,
    "failed": 0
  },
  "hits": {
    "max_score": null,
    "hits": [
      {
        "_index": "partial-.ds-logs-kafka.log-default-2023.05.30-000002",
        "_id": "dbQSaogBX2reHfX1RR7s",
        "_score": null,
        "fields": {
          "host.os.name.text": [
            "CentOS Linux"
          ],
....
初回は検索に4829ミリ秒かかりました。
    "z1pa00yOSZK7Ita4vr8h3A": {
      "shared_cache": {
        "reads": 1571556,
        "bytes_read_in_bytes": 1613129882,
        "writes": 169,
        "bytes_written_in_bytes": 2835349504,
        "evictions": 154,
        "num_regions": 21888,
        "size_in_bytes": 367219703808,
        "region_size_in_bytes": 16777216
      }
    }
- write ... 154 -> 169
- bytes_written_in_bytes ... 2583691264 -> 2835349504 (240MB増えた)
その後、検索条件を変えたりしながら検索をくり返えした結果を示します。
1回目の検索: 検索範囲(2023-01-01 ~ 2023-01-06) .... 検索結果: 4829ミリ秒 writes回数169
2回目の検索: 検索範囲(2023-01-01 ~ 2023-01-06) .... 検索結果: 1237ミリ秒 writes回数169
3回目の検索: 検索範囲(2023-01-01 ~ 2023-01-10) .... 検索結果: 1992ミリ秒 writes回数175
4回目の検索: 検索範囲(2023-01-01 ~ 2023-01-13) ... 検索結果: 1221ミリ秒 writes回数177
5回目の検索: 検索範囲(2023-01-01 ~ 2023-01-16) ... 検索結果: 1011ミリ秒 writes回数177
最後に検索範囲を拡大した分のデータ(2023-01-13 ~ 2023-01-16)はHotのデータのため、Frozenのwrite回数が増えなかったのでしょう。
負荷テストでの性能値
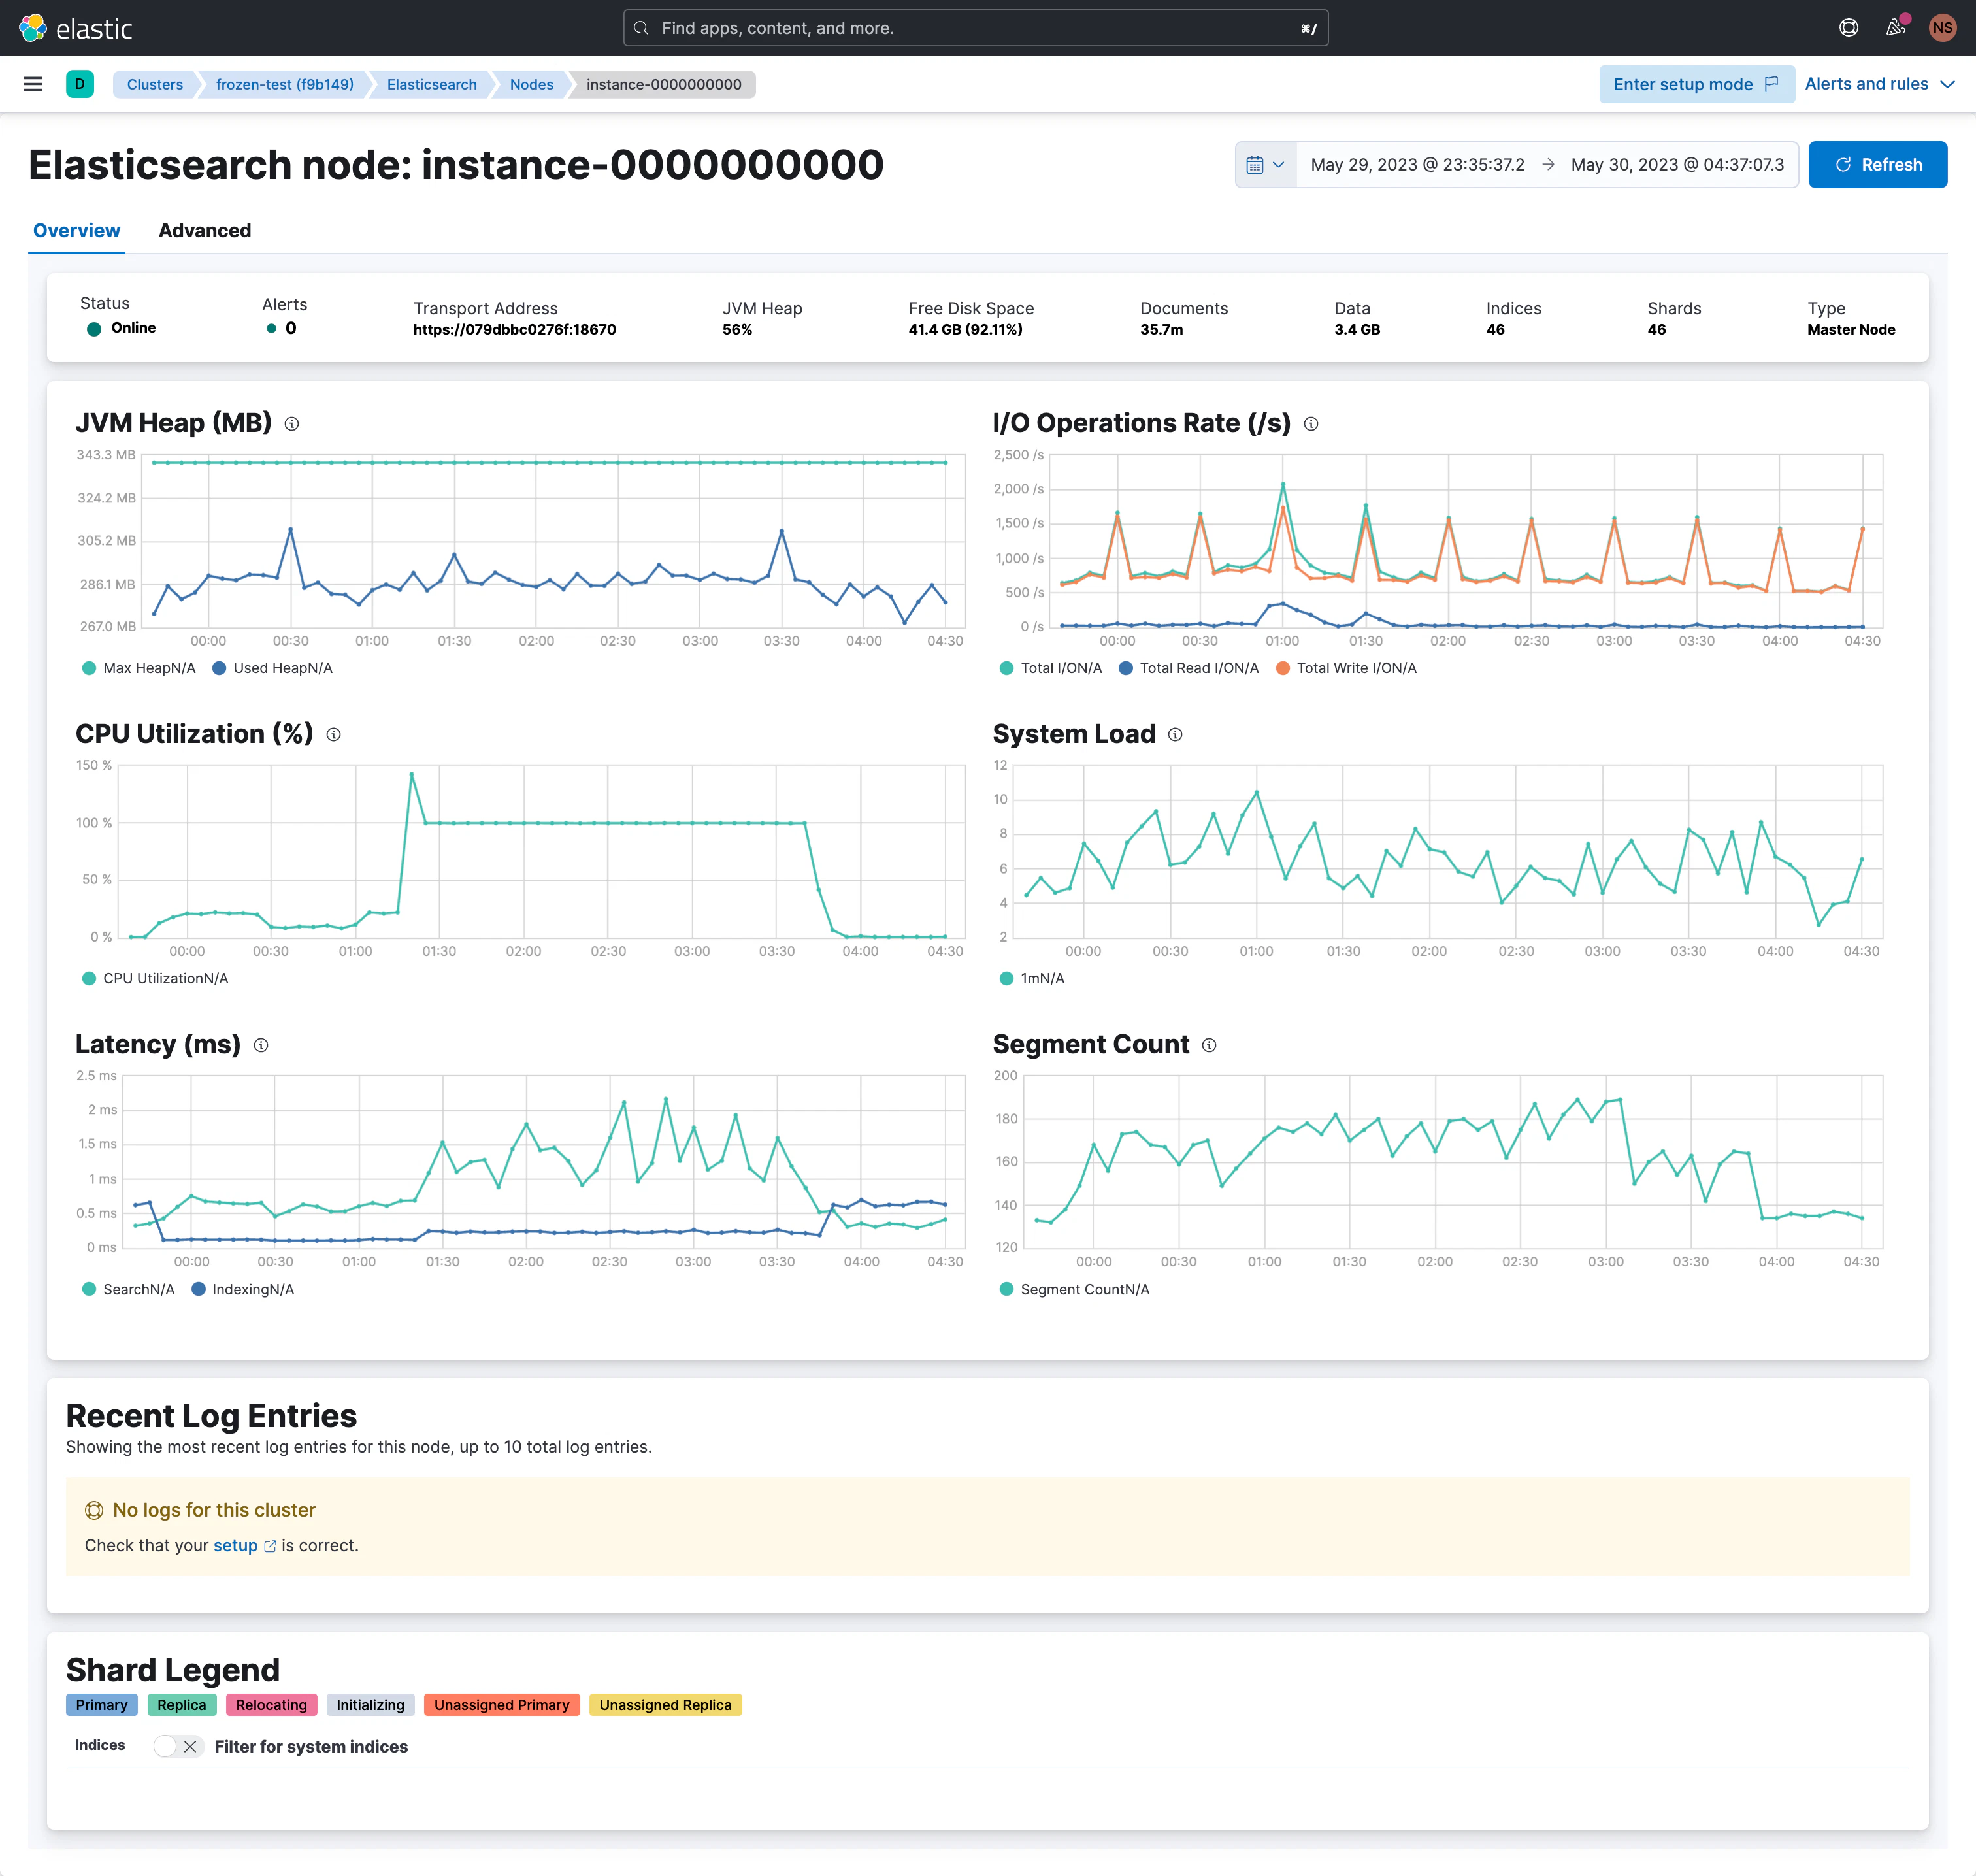
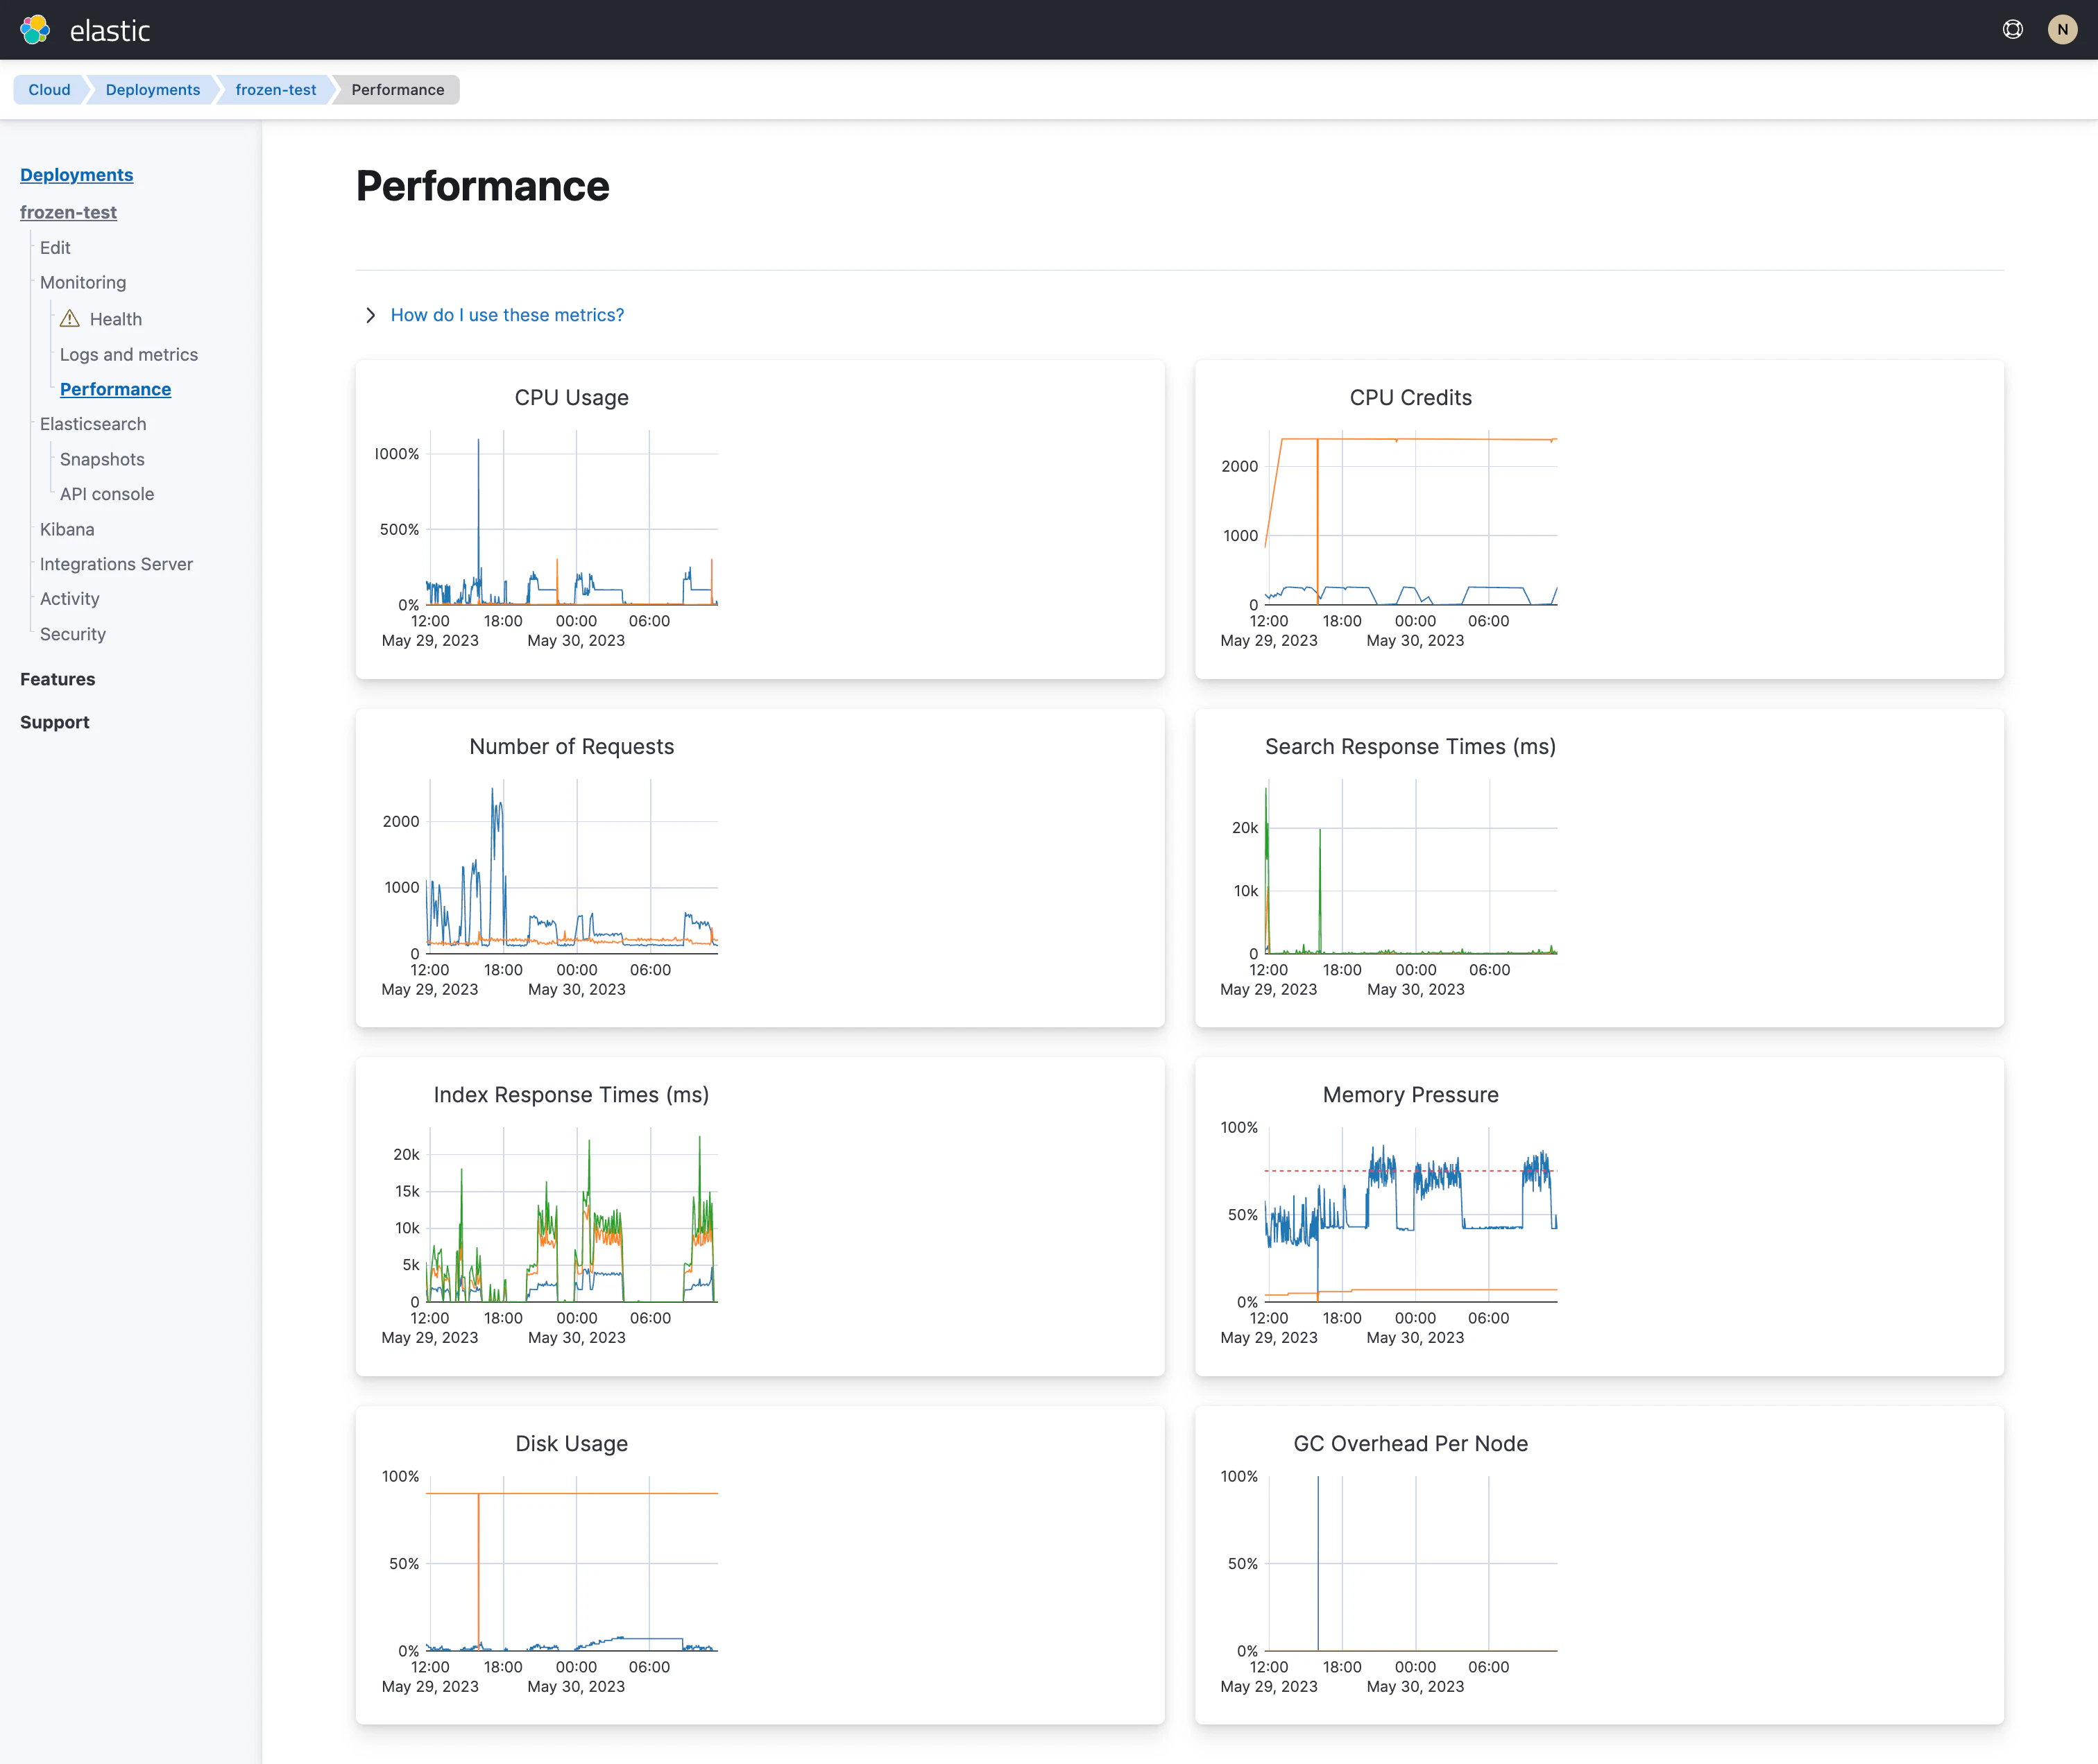
本題とは直接関係ないのですが、負荷テスト時のStack Monitoringを有効にして見えるクラスタのパフォーマンス数値です。どちらのテストにおいても、アップロードするデータ量と速さが今回のクラスタのスペックを少し越えるものだっったため、Elastic CloudのCPUクレジットを途中で使い切ってしまいました。そのため、使えるCPUが減ったため、CPU Utilizationが途中から100%になっています。25%->100%に負荷が上がったというより、分母であるCPU数が減ったため、100%になったと考えられます。(CPUクレジットについてはこちら)
よって、どちらのテストでもエラーは発生しており、テスト1 (Hotのみ)は41.32%, テスト2(Frozen有効化)は67.57%のエラー率となっていました。
性能値 テスト1: Hotのみの場合の結果(Frozenは使わない)

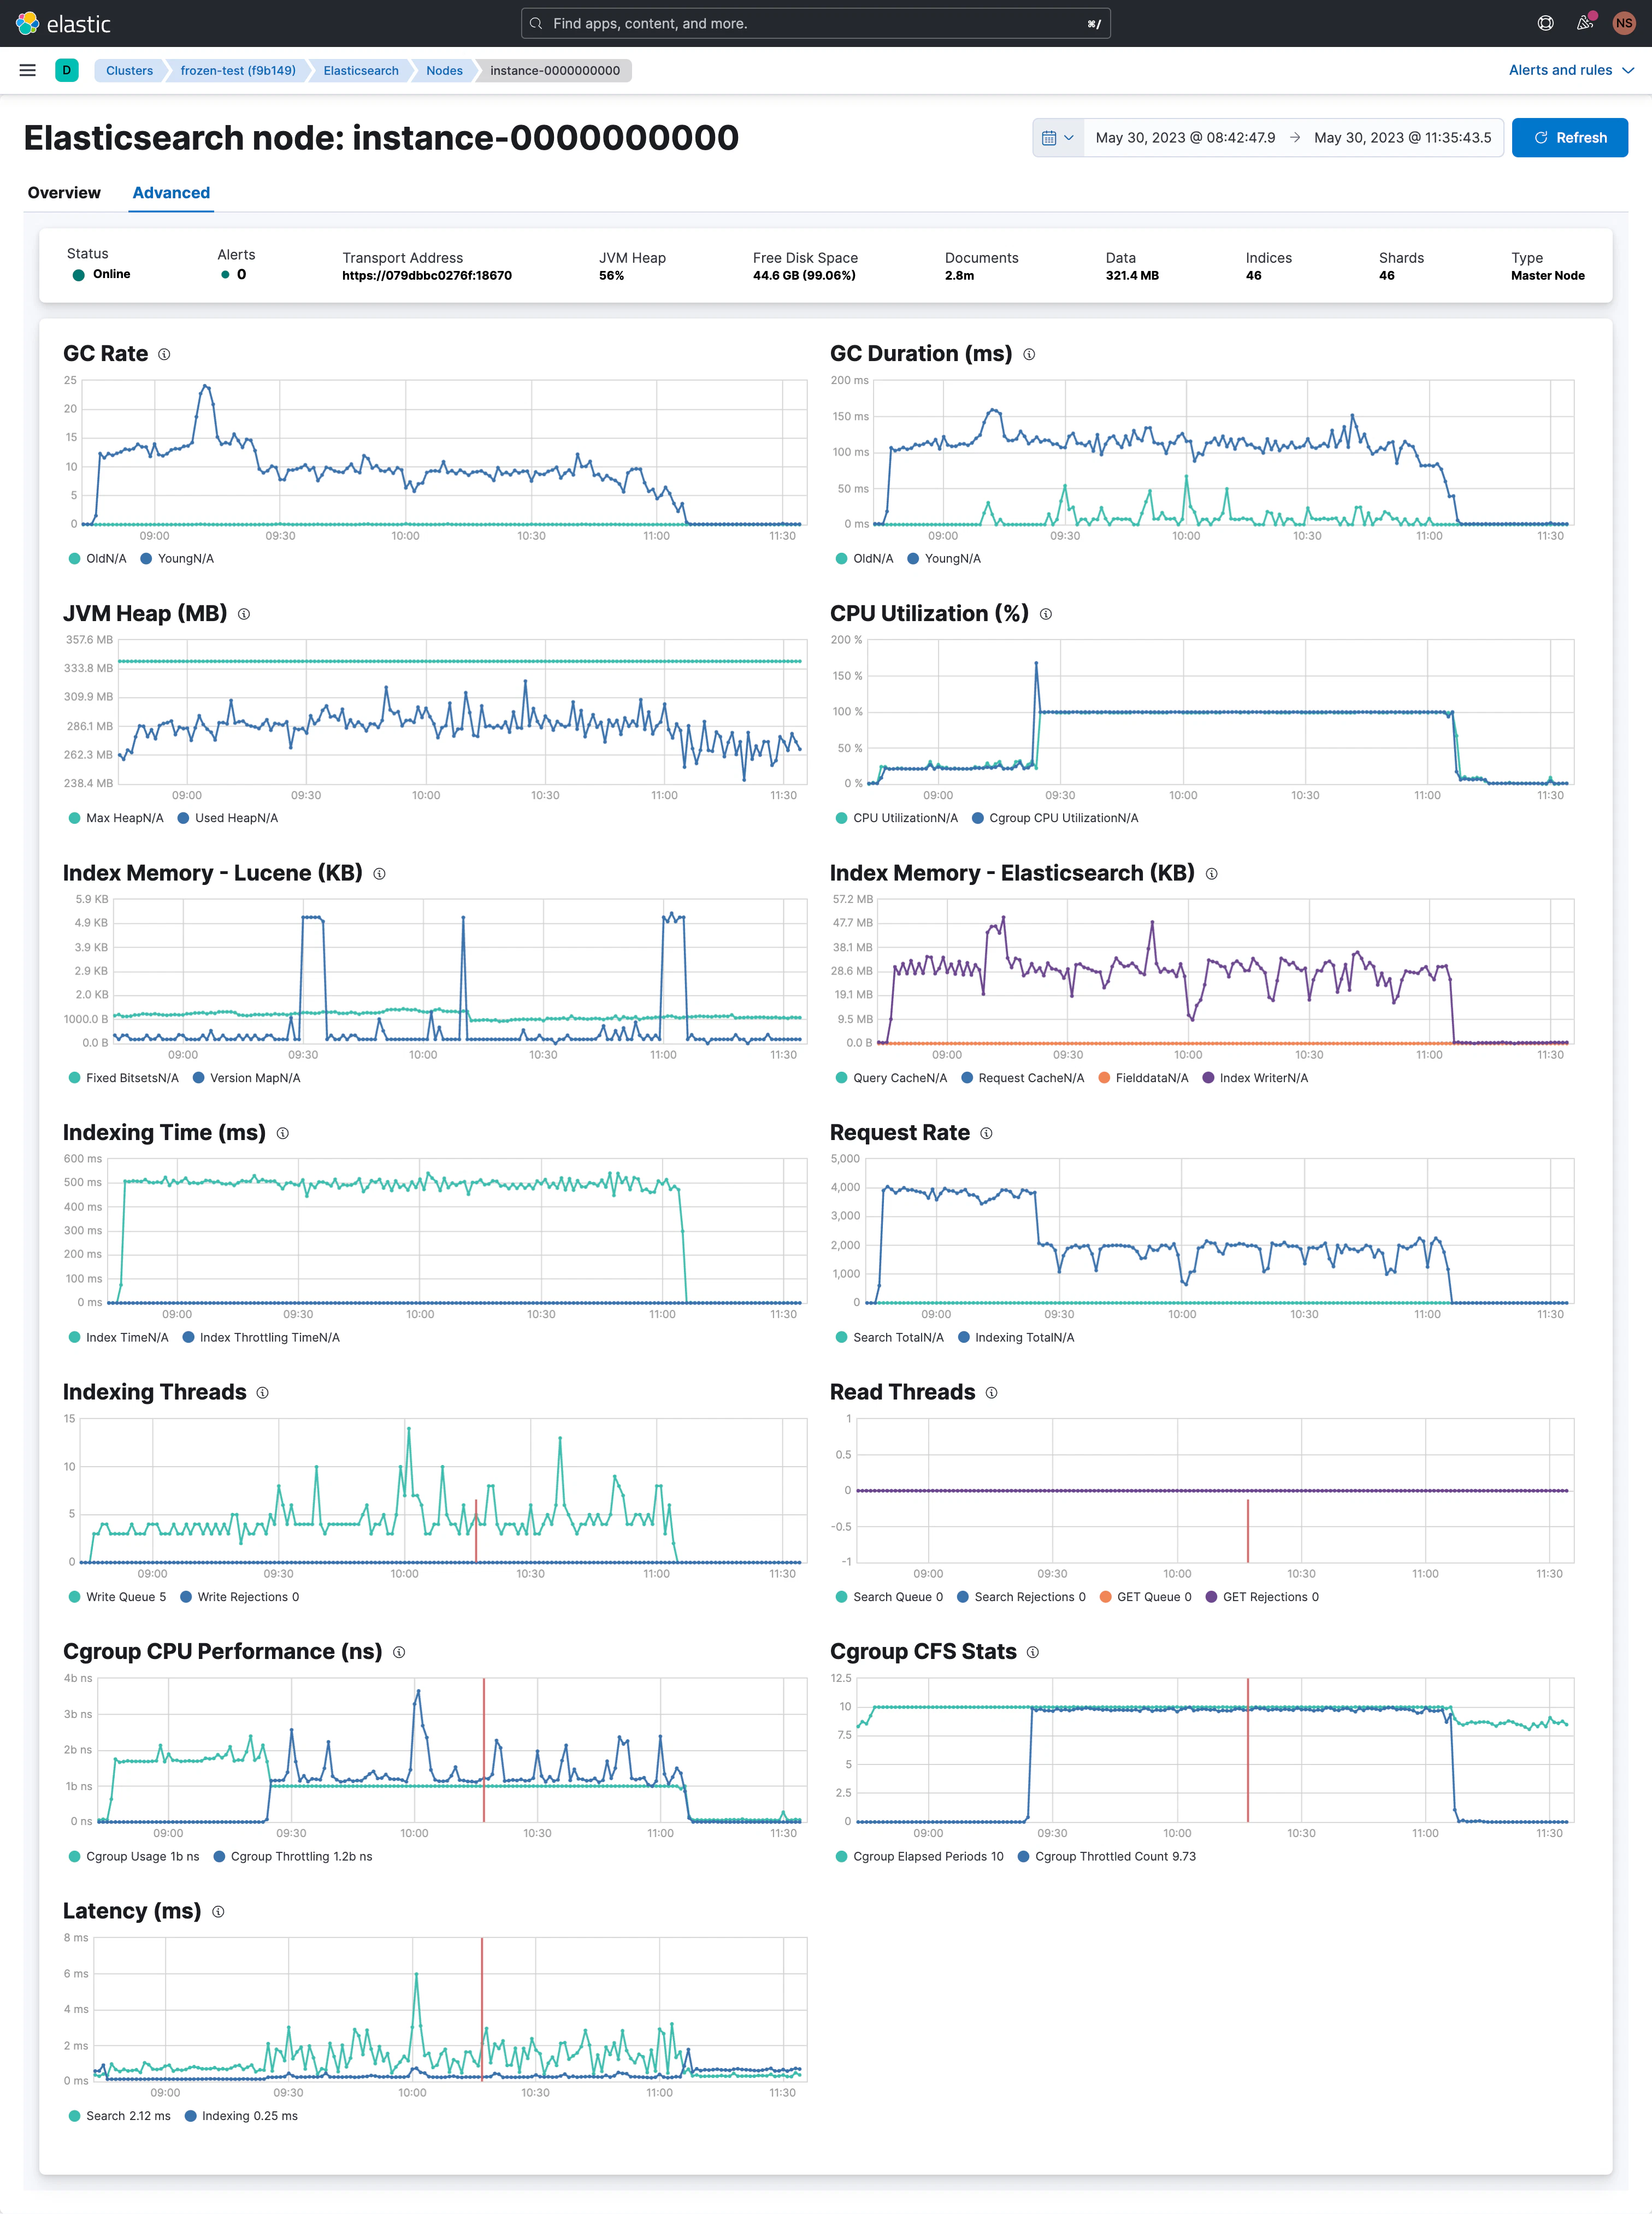
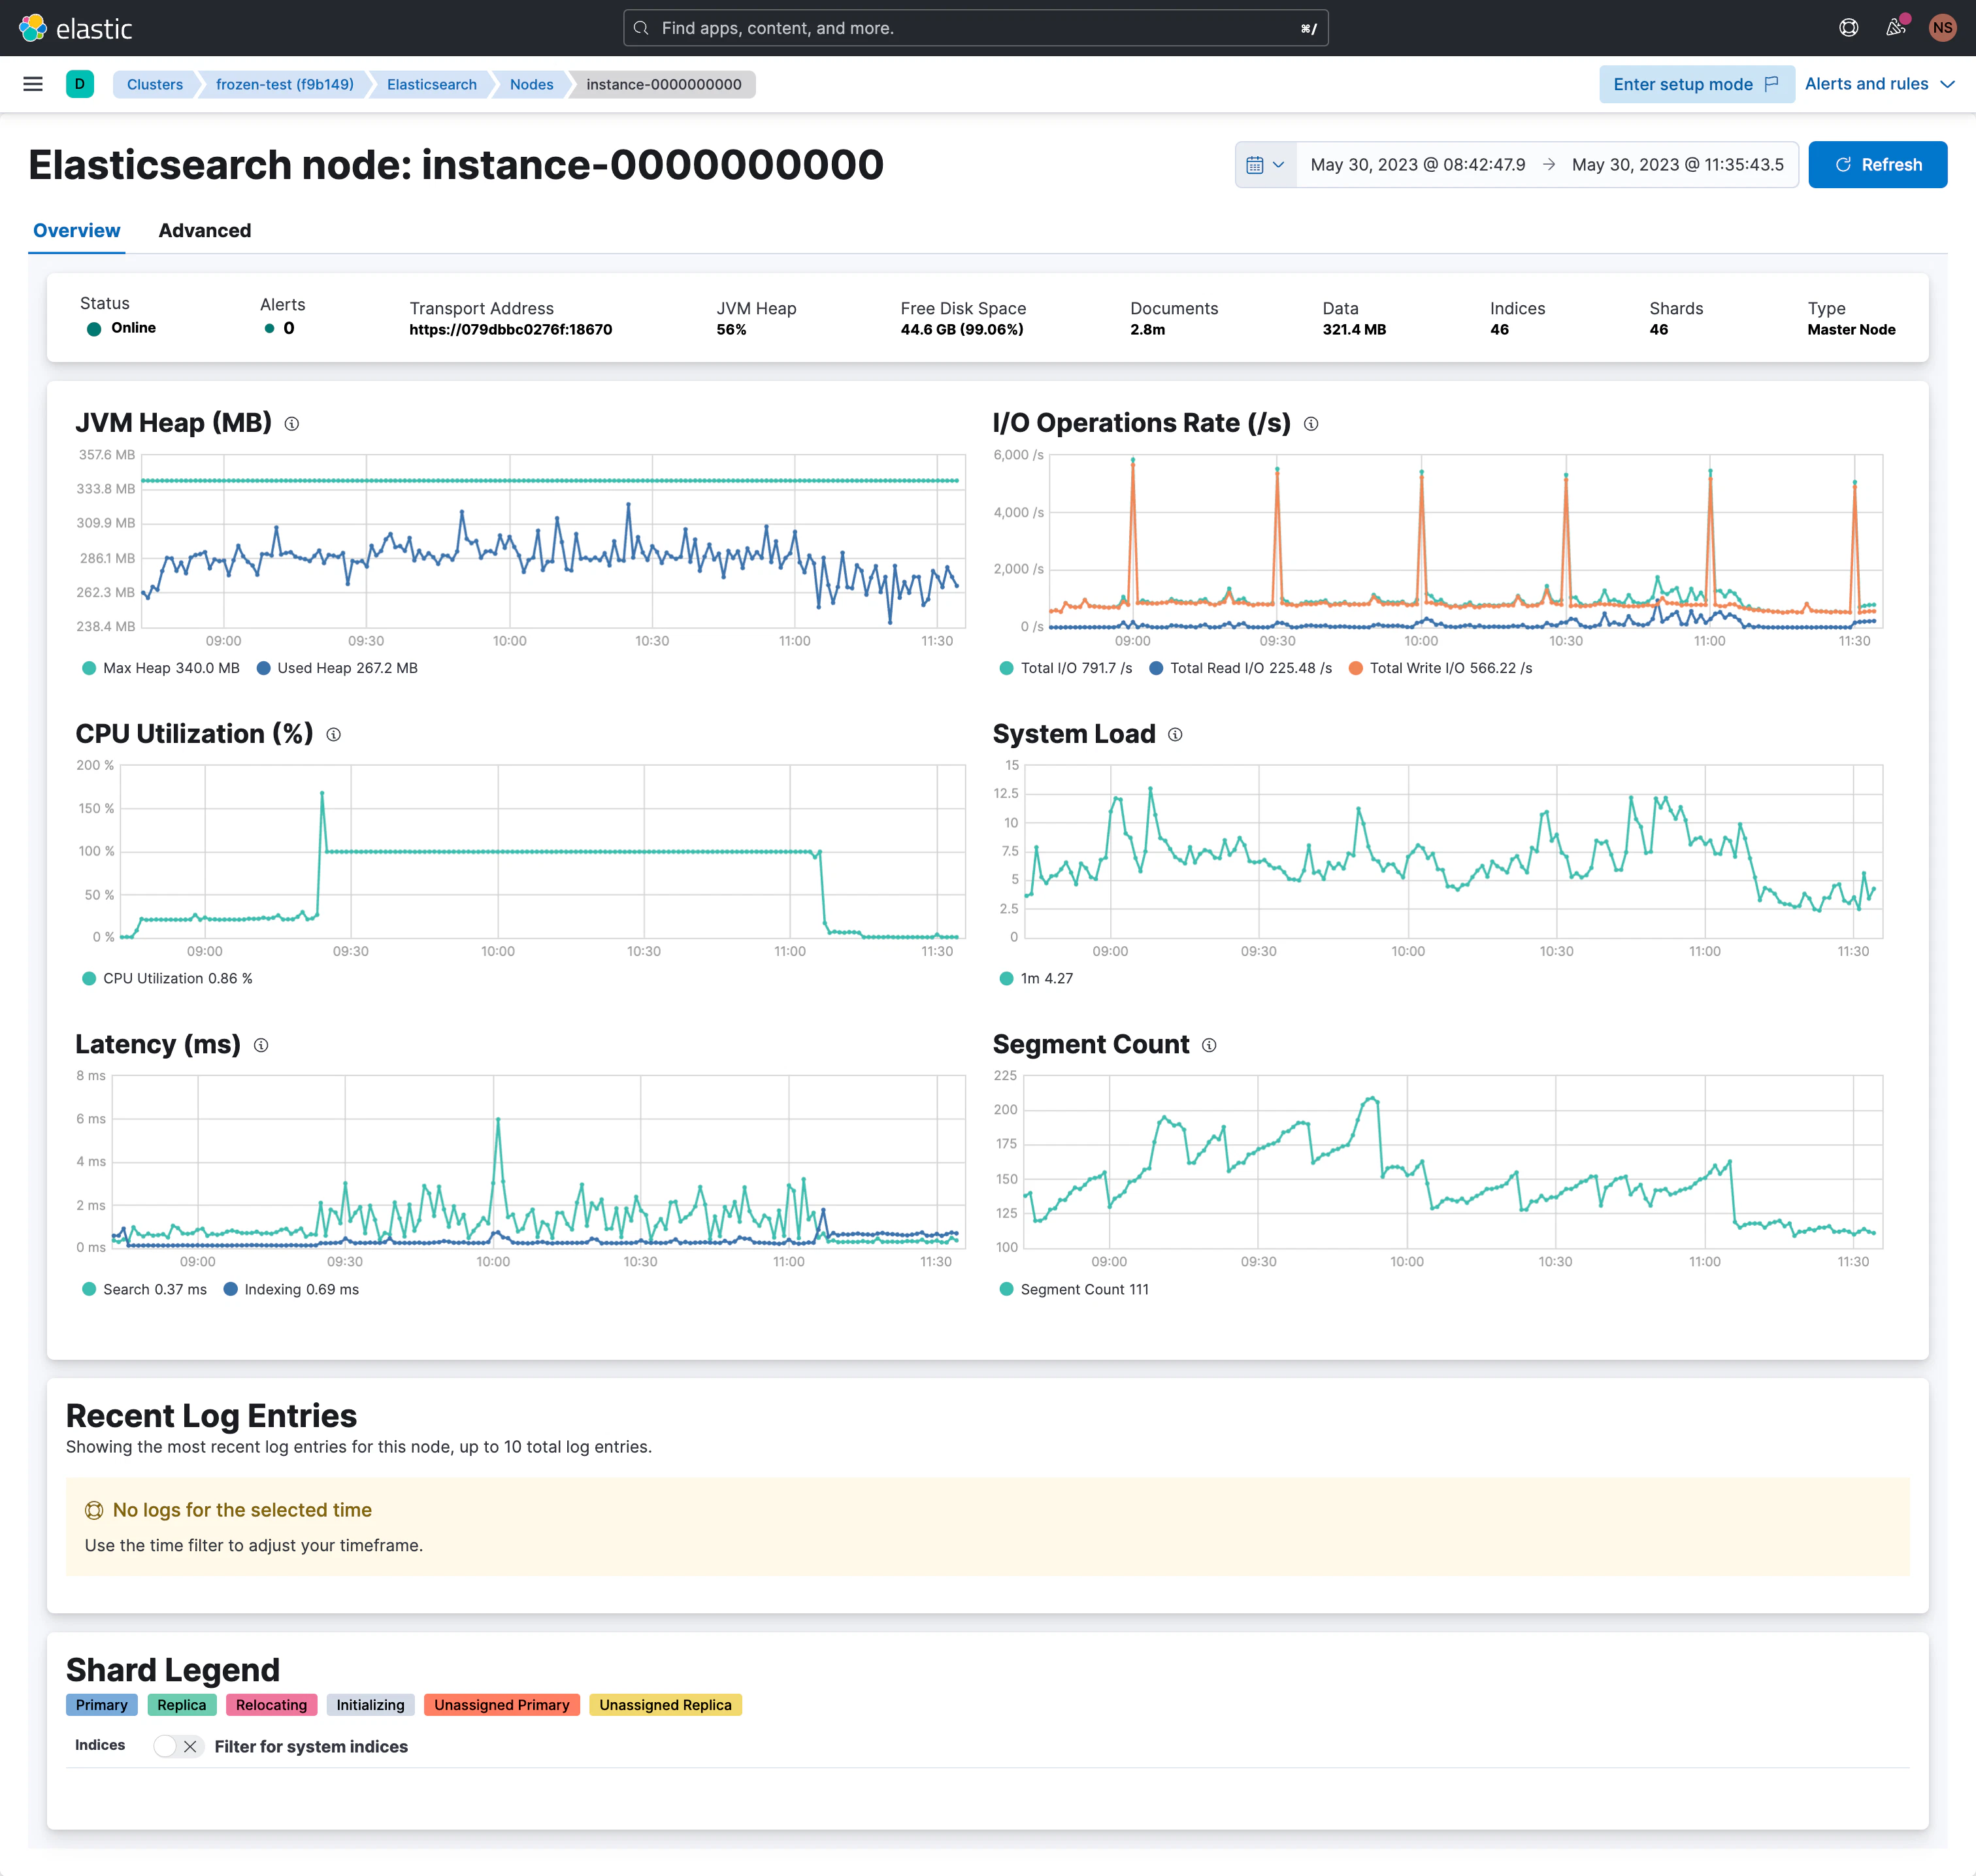
性能値 テスト2: Frozenを有効化
なお、CPUのクレジットはElastic Cloudの管理画面Performanceのグラフ CPU Creditsで確認できます。青い線が0になっている時、CPUクレジットが消費し切っている状況です。
Rallyの負荷テストの詳細
esrally race --track=elastic/logs --track-params="params.json" --target-hosts=XXX.es.asia-northeast1.gcp.cloud.es.io:443 --pipeline=benchmark-only --client-options="use_ssl:true,verify_certs:true,basic_auth_user:'XXX',basic_auth_password:'XXX'" --kill-running-processes
{
    "force_data_generation": true,
    "throttle_indexing": false,
    "bulk_indexing_clients": 4,
    "bulk_size": 5000,
    "raw_data_volume_per_day": "1GB",
    "max_total_download_gb": 2,
    "number_of_replicas": 0,
    "wait_for_status": "yellow",
    "start_date": "2023-01-01",
    "end_date": "2023-01-15",
    "integration_ratios": {
        "kafka": {
            "corpora": {
                "kafka-logs": 1.0
            }
        }
    }
}
ポイント
- bulk_indexing_clients:4でクライアントの並列度、bulk_size:5000で一度のPOSTによるドキュメント数を設定
- 2023-01-01 ~ 2023-01-15の期間のデータを生成し、各日につきraw_data_volume_per_day: 1GB分のデータをアップロード
- デフォルトだと、複数のタイプのログとそれぞれのData Streamが作成されるので、今回は1種類のログ(適当にkafkaのログを選択)となるようにintegration_ratiosにて設定変更
{
  "policy": {
    "phases": {
      "hot": {
        "min_age": "0ms",
        "actions": {
          "rollover": {
            "max_size": "500mb"
          }
        }
      },
      "frozen": {
        "min_age": "0d",
        "actions": {
          "searchable_snapshot": {
            "snapshot_repository": "found-snapshots"
          }
        }
      }
    }
  }
}
- Rally側が使用するILMの設定もテスト中に生成しているので、Rally側のこのファイルにてILMを設定しないと、Rally実行時にこのファイルの値で上書きされます。
% esrally race --track=elastic/logs --track-params="params.json" --target-hosts=xxx.es.asia-northeast1.gcp.cloud.es.io:443 --pipeline=benchmark-only --client-options="use_ssl:true,verify_certs:true,basic_auth_user:'xxx',basic_auth_password:'xxx'" --kill-running-processes
____ ____
/ __ \____ _/ / /_ __
/ /_/ / __ `/ / / / / /
/ _, _/ /_/ / / / /_/ /
/_/ |_|\__,_/_/_/\__, /
/____/
[INFO] Race id is [25054e47-f84d-43bb-8db7-359c87859791]
[INFO] Racing on track [elastic/logs], challenge [logging-indexing] and car ['external'] with version [8.8.0].
Running insert-pipelines [100% done]
Running insert-ilm [100% done]
Running delete-all-datastreams [100% done]
Running delete-all-composable-templates [100% done]
Running delete-all-component-templates [100% done]
Running create-all-component-templates [100% done]
Running create-all-composable-templates [100% done]
Running create-required-data-streams [100% done]
Running validate-package-template-installation [100% done]
Running update-custom-package-templates [100% done]
Running check-cluster-health [100% done]
Running wait-until-merges-finish [100% done]
Running bulk-index [100% done]
Running compression-stats [100% done]
------------------------------------------------------
_______ __ _____
/ ____(_)___ ____ _/ / / ___/_________ ________
/ /_ / / __ \/ __ `/ / \__ \/ ___/ __ \/ ___/ _ \
/ __/ / / / / / /_/ / / ___/ / /__/ /_/ / / / __/
/_/ /_/_/ /_/\__,_/_/ /____/\___/\____/_/ \___/
------------------------------------------------------
| Metric | Task | Value | Unit |
|---------------------------------------------------------------:|---------------------------------------:|-----------------:|-------:|
| Cumulative indexing time of primary shards | | 107.499 | min |
| Min cumulative indexing time across primary shards | | 0 | min |
| Median cumulative indexing time across primary shards | | 0 | min |
| Max cumulative indexing time across primary shards | | 107.499 | min |
| Cumulative indexing throttle time of primary shards | | 0 | min |
| Min cumulative indexing throttle time across primary shards | | 0 | min |
| Median cumulative indexing throttle time across primary shards | | 0 | min |
| Max cumulative indexing throttle time across primary shards | | 0 | min |
| Cumulative merge time of primary shards | | 18.6241 | min |
| Cumulative merge count of primary shards | | 16 | |
| Min cumulative merge time across primary shards | | 0 | min |
| Median cumulative merge time across primary shards | | 0 | min |
| Max cumulative merge time across primary shards | | 18.6241 | min |
| Cumulative merge throttle time of primary shards | | 4.39638 | min |
| Min cumulative merge throttle time across primary shards | | 0 | min |
| Median cumulative merge throttle time across primary shards | | 0 | min |
| Max cumulative merge throttle time across primary shards | | 4.39638 | min |
| Cumulative refresh time of primary shards | | 0.19035 | min |
| Cumulative refresh count of primary shards | | 883 | |
| Min cumulative refresh time across primary shards | | 0 | min |
| Median cumulative refresh time across primary shards | | 0 | min |
| Max cumulative refresh time across primary shards | | 0.19035 | min |
| Cumulative flush time of primary shards | | 3.9492 | min |
| Cumulative flush count of primary shards | | 252 | |
| Min cumulative flush time across primary shards | | 1.66667e-05 | min |
| Median cumulative flush time across primary shards | | 1.66667e-05 | min |
| Max cumulative flush time across primary shards | | 3.94875 | min |
| Total Young Gen GC time | | 1203.2 | s |
| Total Young Gen GC count | | 107376 | |
| Total Old Gen GC time | | 4.465 | s |
| Total Old Gen GC count | | 10 | |
| Store size | | 3.53154 | GB |
| Translog size | | 0.0426439 | GB |
| Heap used for segments | | 0 | MB |
| Heap used for doc values | | 0 | MB |
| Heap used for terms | | 0 | MB |
| Heap used for norms | | 0 | MB |
| Heap used for points | | 0 | MB |
| Heap used for stored fields | | 0 | MB |
| Segment count | | 48 | |
| Total Ingest Pipeline count | | 3.5673e+07 | |
| Total Ingest Pipeline time | | 5820.18 | s |
| Total Ingest Pipeline failed | | 0 | |
| Min Throughput | insert-pipelines | 41.71 | ops/s |
| Mean Throughput | insert-pipelines | 41.71 | ops/s |
| Median Throughput | insert-pipelines | 41.71 | ops/s |
| Max Throughput | insert-pipelines | 41.71 | ops/s |
| 100th percentile latency | insert-pipelines | 357.968 | ms |
| 100th percentile service time | insert-pipelines | 357.968 | ms |
| error rate | insert-pipelines | 0 | % |
| Min Throughput | insert-ilm | 12.43 | ops/s |
| Mean Throughput | insert-ilm | 12.43 | ops/s |
| Median Throughput | insert-ilm | 12.43 | ops/s |
| Max Throughput | insert-ilm | 12.43 | ops/s |
| 100th percentile latency | insert-ilm | 78.4338 | ms |
| 100th percentile service time | insert-ilm | 78.4338 | ms |
| error rate | insert-ilm | 0 | % |
| Min Throughput | validate-package-template-installation | 17.53 | ops/s |
| Mean Throughput | validate-package-template-installation | 17.53 | ops/s |
| Median Throughput | validate-package-template-installation | 17.53 | ops/s |
| Max Throughput | validate-package-template-installation | 17.53 | ops/s |
| 100th percentile latency | validate-package-template-installation | 56.8506 | ms |
| 100th percentile service time | validate-package-template-installation | 56.8506 | ms |
| error rate | validate-package-template-installation | 0 | % |
| Min Throughput | update-custom-package-templates | 34.05 | ops/s |
| Mean Throughput | update-custom-package-templates | 34.05 | ops/s |
| Median Throughput | update-custom-package-templates | 34.05 | ops/s |
| Max Throughput | update-custom-package-templates | 34.05 | ops/s |
| 100th percentile latency | update-custom-package-templates | 1086.34 | ms |
| 100th percentile service time | update-custom-package-templates | 1086.34 | ms |
| error rate | update-custom-package-templates | 0 | % |
| Min Throughput | bulk-index | 607.81 | docs/s |
| Mean Throughput | bulk-index | 3017.3 | docs/s |
| Median Throughput | bulk-index | 2891.53 | docs/s |
| Max Throughput | bulk-index | 3903.91 | docs/s |
| 50th percentile latency | bulk-index | 3521.55 | ms |
| 90th percentile latency | bulk-index | 8493.09 | ms |
| 99th percentile latency | bulk-index | 12535.7 | ms |
| 99.9th percentile latency | bulk-index | 18846.4 | ms |
| 99.99th percentile latency | bulk-index | 39834.5 | ms |
| 100th percentile latency | bulk-index | 42908.8 | ms |
| 50th percentile service time | bulk-index | 3521.55 | ms |
| 90th percentile service time | bulk-index | 8493.09 | ms |
| 99th percentile service time | bulk-index | 12535.7 | ms |
| 99.9th percentile service time | bulk-index | 18846.4 | ms |
| 99.99th percentile service time | bulk-index | 39834.5 | ms |
| 100th percentile service time | bulk-index | 42908.8 | ms |
| error rate | bulk-index | 41.32 | % |
| 100th percentile latency | compression-stats | 62054.3 | ms |
| 100th percentile service time | compression-stats | 62054.3 | ms |
| error rate | compression-stats | 100 | % |
[WARNING] Error rate is 41.32 for operation 'bulk-index'. Please check the logs.
[WARNING] Error rate is 100.0 for operation 'compression-stats'. Please check the logs.
[WARNING] No throughput metrics available for [compression-stats]. Likely cause: Error rate is 100.0%. Please check the logs.
-----------------------------------
[INFO] SUCCESS (took 14243 seconds)
-----------------------------------
% esrally race --track=elastic/logs --track-params="params.json" --target-hosts=xxx.es.asia-northeast1.gcp.cloud.es.io:443 --pipeline=benchmark-only --client-options="use_ssl:true,verify_certs:true,basic_auth_user:'xxx',basic_auth_password:'xxx'" --kill-running-processes
____ ____
/ __ \____ _/ / /_ __
/ /_/ / __ `/ / / / / /
/ _, _/ /_/ / / / /_/ /
/_/ |_|\__,_/_/_/\__, /
/____/
[INFO] Race id is [d851bc57-729a-401c-b6eb-1d11ca791985]
[INFO] Racing on track [elastic/logs], challenge [logging-indexing] and car ['external'] with version [8.8.0].
Running insert-pipelines [100% done]
Running insert-ilm [100% done]
Running delete-all-datastreams [100% done]
Running delete-all-composable-templates [100% done]
Running delete-all-component-templates [100% done]
Running create-all-component-templates [100% done]
Running create-all-composable-templates [100% done]
Running create-required-data-streams [100% done]
Running validate-package-template-installation [100% done]
Running update-custom-package-templates [100% done]
Running check-cluster-health [100% done]
Running wait-until-merges-finish [100% done]
Running bulk-index [100% done]
Running compression-stats [100% done]
------------------------------------------------------
_______ __ _____
/ ____(_)___ ____ _/ / / ___/_________ ________
/ /_ / / __ \/ __ `/ / \__ \/ ___/ __ \/ ___/ _ \
/ __/ / / / / / /_/ / / ___/ / /__/ /_/ / / / __/
/_/ /_/_/ /_/\__,_/_/ /____/\___/\____/_/ \___/
------------------------------------------------------
| Metric | Task | Value | Unit |
|---------------------------------------------------------------:|---------------------------------------:|----------------:|-------:|
| Cumulative indexing time of primary shards | | 12.7184 | min |
| Min cumulative indexing time across primary shards | | 0 | min |
| Median cumulative indexing time across primary shards | | 0 | min |
| Max cumulative indexing time across primary shards | | 12.7184 | min |
| Cumulative indexing throttle time of primary shards | | 0 | min |
| Min cumulative indexing throttle time across primary shards | | 0 | min |
| Median cumulative indexing throttle time across primary shards | | 0 | min |
| Max cumulative indexing throttle time across primary shards | | 0 | min |
| Cumulative merge time of primary shards | | 1.90947 | min |
| Cumulative merge count of primary shards | | 2 | |
| Min cumulative merge time across primary shards | | 0 | min |
| Median cumulative merge time across primary shards | | 0 | min |
| Max cumulative merge time across primary shards | | 1.90947 | min |
| Cumulative merge throttle time of primary shards | | 0.187017 | min |
| Min cumulative merge throttle time across primary shards | | 0 | min |
| Median cumulative merge throttle time across primary shards | | 0 | min |
| Max cumulative merge throttle time across primary shards | | 0.187017 | min |
| Cumulative refresh time of primary shards | | 0.1045 | min |
| Cumulative refresh count of primary shards | | 860 | |
| Min cumulative refresh time across primary shards | | 0 | min |
| Median cumulative refresh time across primary shards | | 0 | min |
| Max cumulative refresh time across primary shards | | 0.104333 | min |
| Cumulative flush time of primary shards | | 1.45932 | min |
| Cumulative flush count of primary shards | | 47 | |
| Min cumulative flush time across primary shards | | 0 | min |
| Median cumulative flush time across primary shards | | 1.66667e-05 | min |
| Max cumulative flush time across primary shards | | 1.45888 | min |
| Total Young Gen GC time | | 940.218 | s |
| Total Young Gen GC count | | 86361 | |
| Total Old Gen GC time | | 61.847 | s |
| Total Old Gen GC count | | 131 | |
| Store size | | 0.529193 | GB |
| Translog size | | 0.0852852 | GB |
| Heap used for segments | | 0 | MB |
| Heap used for doc values | | 0 | MB |
| Heap used for terms | | 0 | MB |
| Heap used for norms | | 0 | MB |
| Heap used for points | | 0 | MB |
| Heap used for stored fields | | 0 | MB |
| Segment count | | 6 | |
| Total Ingest Pipeline count | | 1.97065e+07 | |
| Total Ingest Pipeline time | | 3967.68 | s |
| Total Ingest Pipeline failed | | 0 | |
| Min Throughput | insert-pipelines | 60.57 | ops/s |
| Mean Throughput | insert-pipelines | 60.57 | ops/s |
| Median Throughput | insert-pipelines | 60.57 | ops/s |
| Max Throughput | insert-pipelines | 60.57 | ops/s |
| 100th percentile latency | insert-pipelines | 245.006 | ms |
| 100th percentile service time | insert-pipelines | 245.006 | ms |
| error rate | insert-pipelines | 0 | % |
| Min Throughput | insert-ilm | 12.34 | ops/s |
| Mean Throughput | insert-ilm | 12.34 | ops/s |
| Median Throughput | insert-ilm | 12.34 | ops/s |
| Max Throughput | insert-ilm | 12.34 | ops/s |
| 100th percentile latency | insert-ilm | 78.2425 | ms |
| 100th percentile service time | insert-ilm | 78.2425 | ms |
| error rate | insert-ilm | 0 | % |
| Min Throughput | validate-package-template-installation | 18.22 | ops/s |
| Mean Throughput | validate-package-template-installation | 18.22 | ops/s |
| Median Throughput | validate-package-template-installation | 18.22 | ops/s |
| Max Throughput | validate-package-template-installation | 18.22 | ops/s |
| 100th percentile latency | validate-package-template-installation | 54.335 | ms |
| 100th percentile service time | validate-package-template-installation | 54.335 | ms |
| error rate | validate-package-template-installation | 0 | % |
| Min Throughput | update-custom-package-templates | 16.01 | ops/s |
| Mean Throughput | update-custom-package-templates | 16.01 | ops/s |
| Median Throughput | update-custom-package-templates | 16.01 | ops/s |
| Max Throughput | update-custom-package-templates | 16.01 | ops/s |
| 100th percentile latency | update-custom-package-templates | 2309.3 | ms |
| 100th percentile service time | update-custom-package-templates | 2309.3 | ms |
| error rate | update-custom-package-templates | 0 | % |
| Min Throughput | bulk-index | 898.85 | docs/s |
| Mean Throughput | bulk-index | 3108.86 | docs/s |
| Median Throughput | bulk-index | 2970.43 | docs/s |
| Max Throughput | bulk-index | 3908.06 | docs/s |
| 50th percentile latency | bulk-index | 274.681 | ms |
| 90th percentile latency | bulk-index | 7161.03 | ms |
| 99th percentile latency | bulk-index | 12559.4 | ms |
| 99.9th percentile latency | bulk-index | 20234.2 | ms |
| 99.99th percentile latency | bulk-index | 25734.1 | ms |
| 100th percentile latency | bulk-index | 25973.1 | ms |
| 50th percentile service time | bulk-index | 274.681 | ms |
| 90th percentile service time | bulk-index | 7161.03 | ms |
| 99th percentile service time | bulk-index | 12559.4 | ms |
| 99.9th percentile service time | bulk-index | 20234.2 | ms |
| 99.99th percentile service time | bulk-index | 25734.1 | ms |
| 100th percentile service time | bulk-index | 25973.1 | ms |
| error rate | bulk-index | 67.57 | % |
| 100th percentile latency | compression-stats | 61464.8 | ms |
| 100th percentile service time | compression-stats | 61464.8 | ms |
| error rate | compression-stats | 100 | % |
[WARNING] Error rate is 67.57 for operation 'bulk-index'. Please check the logs.
[WARNING] Error rate is 100.0 for operation 'compression-stats'. Please check the logs.
[WARNING] No throughput metrics available for [compression-stats]. Likely cause: Error rate is 100.0%. Please check the logs.
----------------------------------
[INFO] SUCCESS (took 8542 seconds)
----------------------------------
まとめ
アップロードの負荷に対して今回用意した環境のリソースが足りなかったため、エラーも出てしまいましたが、その中でも今回のように
ロールオーバーとFrozenへのデータ移動の頻度が細かすぎると、オーバーヘッドが多少増えると思いますので、その分アップロードのエラーやスピードも違いが見られました。
とりあえず、今回はデータが投入されるにつれて、Frozenにどのようにデータが移動していくかを確認することができたので、良しとしたいと思います。