これは何か
単一の型で定義された通常の ndarray を structured array に変換する方法です。
動機
- 複数のデータが時系列であり (2次元配列)、key を使って辞書のようにアクセスしたくなった
- numpy だけで完結させたい
- record array を使えばできる (Stack Overflow : Converting a 2D numpy array to a structured array) という記事もあったが、recarray は numpy の後方互換のため現在も残っているが structured array の方がより新しい (Stack Overflow : NumPy “record array” or “structured array” or “recarray”) という議論もあるようなので、structured array で実現する事にします
方法 1 : タプルのリストを経由させる
- numpy のドキュメントには、データは tuple のリストで渡すように指示されています
コード例
- 例えば以下のようなコードになります
import numpy

# d1, d2, d3 の 3 つのデータがあるとします
d1 = numpy.arange(0, 1000, dtype='int32')
d2 = numpy.arange(1000, 2000, dtype='int32')
d3 = numpy.arange(2000, 3000, dtype='int32')

# くっつけます
d = numpy.array([d1, d2, d3]).T

# d はこんな感じです
# array([[   0, 1000, 2000],
#        [   1, 1001, 2001],
#        [   2, 1002, 2002],
#        ...,
#        [ 997, 1997, 2997],
#        [ 998, 1998, 2998],
#        [ 999, 1999, 2999]], dtype=int32)

# dtype を定義しときます
dtype1 = [
    ('d1', 'int32'),
    ('d2', 'int32'),
    ('d3', 'int32'),
]

# structured array に変換します
sa1 = numpy.array(list(map(tuple, d)), dtype=dtype1)

# sa1 はこんな感じ
# array([(  0, 1000, 2000), (  1, 1001, 2001), (  2, 1002, 2002),
#        (  3, 1003, 2003), (  4, 1004, 2004), (  5, 1005, 2005),
#        (  6, 1006, 2006), (  7, 1007, 2007), (  8, 1008, 2008),
#        ...
#        (993, 1993, 2993), (994, 1994, 2994), (995, 1995, 2995),
#        (996, 1996, 2996), (997, 1997, 2997), (998, 1998, 2998),
#        (999, 1999, 2999)],
#        dtype=[('d1', '<i4'), ('d2', '<i4'), ('d3', '<i4')])

# 個別のデータに key でアクセスできるようになりました
sa1['d1']
# array([  0,   1,   2,   3,   4,   5,   6,   7,   8,   9,  10,  11,  12,
#         13,  14,  15,  16,  17,  18,  19,  20,  21,  22,  23,  24,  25,
#         ...
#        975, 976, 977, 978, 979, 980, 981, 982, 983, 984, 985, 986, 987,
#        988, 989, 990, 991, 992, 993, 994, 995, 996, 997, 998, 999],
#       dtype=int32)
パフォーマンス
- numpy.ndarray から tuple への変換をしており、やや遅いです
- 手元の環境では 3 ms ほどかかっていました
%time numpy.array(list(map(tuple, d)), dtype=dtype1)
# CPU times: user 2.63 ms, sys: 0 ns, total: 2.63 ms
# Wall time: 2.64 ms
方法 2 : バッファを経由させる
- もっと速くしたいです
- structured array は numpy.frombuffer() を使えば、バイナリファイルをそのまま開けてとても便利です。
- ndarray のメモリ上のデータを tobytes() で取り出し、frombuffer() で再解釈させれば、きっと速いに違いありません
コード例
- 例えば以下のようなコードになります
import numpy

# data を作ります
d1 = numpy.arange(0, 1000, dtype='int32')
d2 = numpy.arange(1000, 2000, dtype='int32')
d3 = numpy.arange(2000, 3000, dtype='int32')

d = numpy.array([d1, d2, d3]).T

# dtype を定義します
dtype1 = [
    ('d1', 'int32'),
    ('d2', 'int32'),
    ('d3', 'int32'),
]

### ここまでは、方法 1 と同じです ###

# structured array に変換します
sa2 = numpy.frombuffer(d.tobytes(), dtype=dtype1)

# sa1 と sa2 の値は全く同じです
all(sa2 == sa1)
# >> True
パフォーマンス
- 手元の環境では 80 us になりました
- タプル経由に比べて、30 倍ほど速いです
- 大満足です
%time numpy.frombuffer(d.tobytes(), dtype=dtype1)
# CPU times: user 75 µs, sys: 0 ns, total: 75 µs
# Wall time: 83.9 µs
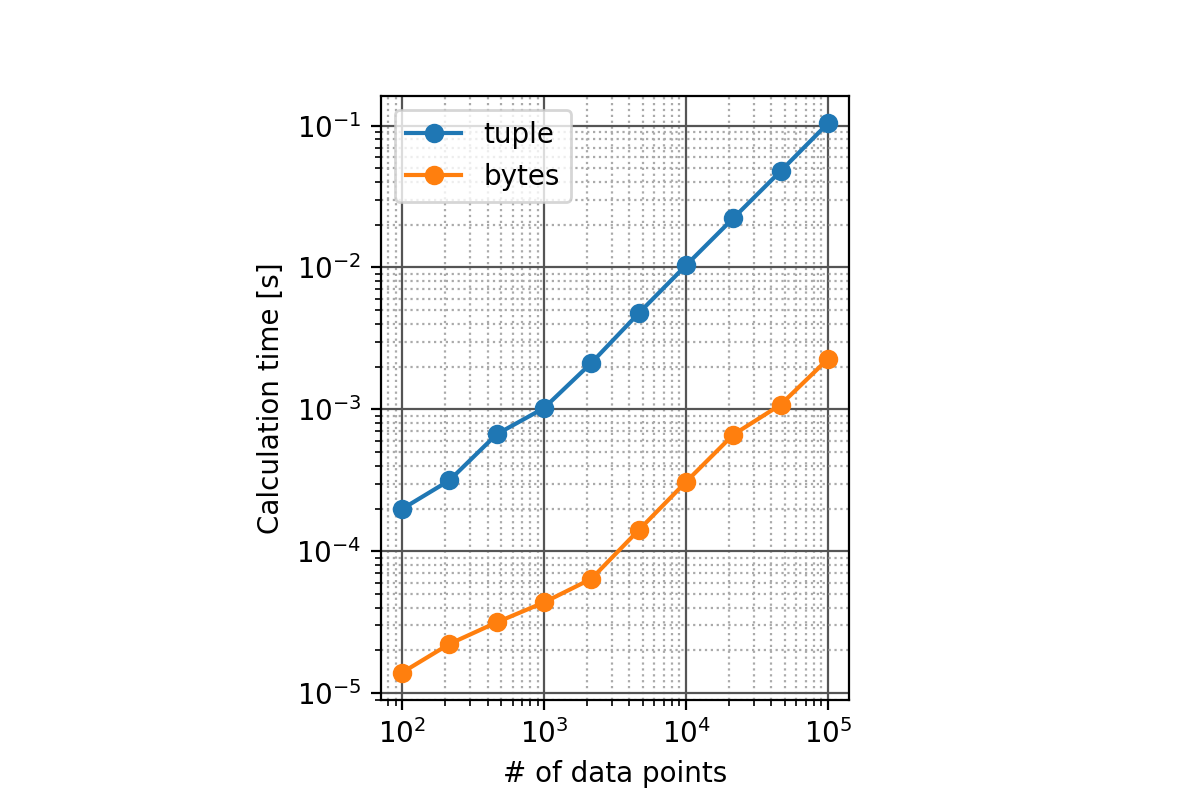
もう少しまじめに比較
- 方法 1 と、方法 2 の計算時間を計測してみました
- データ点数 n を変化させます
- 各点数に対して、100 回計算させて所要時間を平均しました
コード
import numpy
import time

dtype1 = [
    ('d1', 'int32'),
    ('d2', 'int32'),
    ('d3', 'int32'),
]

def run(num, func):
    d = numpy.arange(num*3, dtype='int32').reshape((3, num)).T
    t0 = time.time()
    [func(d) for i in range(100)]
    t1 = time.time()
    return (t1 - t0) / 100

func1 = lambda x: numpy.array(list(map(tuple, x)), dtype=dtype1)
func2 = lambda x: numpy.frombuffer(x.tobytes(), dtype=dtype1)

# 計測します
nums = numpy.logspace(2, 5, 10, dtype=int)
t1 = [run(i, func1) for i in nums]
t2 = [run(i, func2) for i in nums]

# プロットします
import matplotlib.pyplot

fig = matplotlib.pyplot.figure()
ax = fig.add_subplot(111, aspect=1)
ax.plot(nums, t1, 'o-', label='tuple')
ax.plot(nums, t2, 'o-', label='bytes')
ax.set_xscale('log')
ax.set_yscale('log')
ax.set_xlabel('# of data points')
ax.set_ylabel('Calculation time [s]')
ax.grid(True, color='#555555')
ax.grid(True, which='minor', linestyle=':', color='#aaaaaa')
ax.legend()
fig.savefig('results.png', dpi=200)