本記事は PowerShell Advent Calendar 2019 の 16 日目です。
PowerShell だけでダッシュボード Web アプリが作成できる Universal Dashboard というモジュールを紹介します。
Universal Dashboard とは
Universal Dashboard は PowerShell モジュールとして提供されており、
ダッシュボードアプリを作成するため専用のフレームワークといったところです。
ダッシュボードを作成するためにはサーバーサイド側の言語やミドルウェアであったり、フロント側の知識が必要となりますが、
こちらのツールを使えば、 PowerShell だけで全て実装することが可能ということです。(す、すごい。)
PowerShell でダッシュボード作成できるため、システム管理者にとっては重宝しそうです。
現在、コミュニティ版とエンタープライズ版が提供されており、コミュニティ版であれば無料で使用することができ、
GitHub 上でソースコードも公開されています。
今回、この無料版を使って実際にダッシュボードアプリを作成してみました。
以下、簡単な概要です。
| 項目 | 説明 |
|---|---|
| 開発者 | Ironman Software, LLC |
| 登場時期 | 2017/09/05 (Initial release) |
| 最新版 | 2.8.0 - 2019/12/11 |
| リポジトリ | https://github.com/ironmansoftware/universal-dashboard |
| 使用技術 | PowerShell, C# (with ASP.NET Core) and React |
| 対応 | Cross-platform (Windows, Linux or Mac), PowerShell 5 以上 |
| ライセンス | LGPL-3.0 |
| 公式ドキュメント | https://docs.universaldashboard.io/ |
動作環境
Universal Dashboard 自体は PowerShell 5 以上で動作するのですが、
この記事では Get-Counter を使っている都合上、 PowerShell 6 では動作できないコードがあるため、
手元で実行したい場合は PowerShell 5 、もしくは、 PowerShell 7 をご利用ください。
インストール方法
公式ページにある通り、PowerShellGet Gallery からインストールします。
記事を書いている時の最新バージョンは 2.8.0 でした。
Install-Module UniversalDashboard -Scope CurrentUser -Force

(Get-InstalledModule UniversalDashboard).Version.ToString()
# =>2.8.0

# 現在の PowerShell セッションで Universal Dashboard が提供するコマンドレットを使用できるように Import しておきます。
Import-Module UniversalDashboard
基本的な使い方
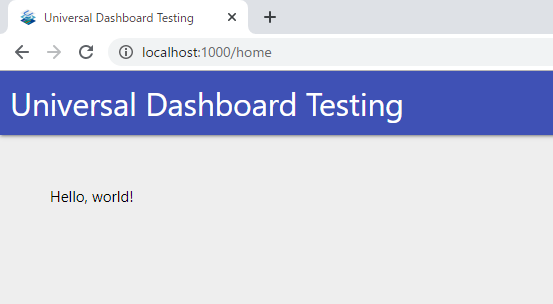
では最初なので画面上に「Hello world!」だけ表示させてみます。
dashborad.ps1 ファイルを作成し、以下のコードを書いて保存します。
$dashboard = New-UDDashboard -Title 'Universal Dashboard Testing' -Content {
    New-UDHeading -Text 'Hello, world!'
}

Start-UDDashboard -Dashboard $dashboard -Port 1000 -AutoReload
では、実行します。
.\dashborad.ps1
# =>Name       Port Running DashboardService
# =>----       ---- ------- ----------------
# =>Dashboard0 1000    True UniversalDashboard.Services.DashboardService
上記のような結果が返ってくると正常に実行出来たことになります。
試しにブラウザで表示させてみます。
http://localhost:1000
すると以下のような画面が表示されました。
「Universal Dashboard Trial」というポップアップが出ますが、「Close」で問題ないです。
ちなみに、 Start-UDDashboard に -AutoReload をつけることで
ファイルを編集した内容が自動で Web 画面の方にも反映されます。
グラフの表示
では、次にダッシュボードらしい画面にしていきます。
Universal Dashboard では、無料版といえども棒グラフ、折れ線グラフ、円グラフといった
基本的なグラフであれば簡単に作成することができます。
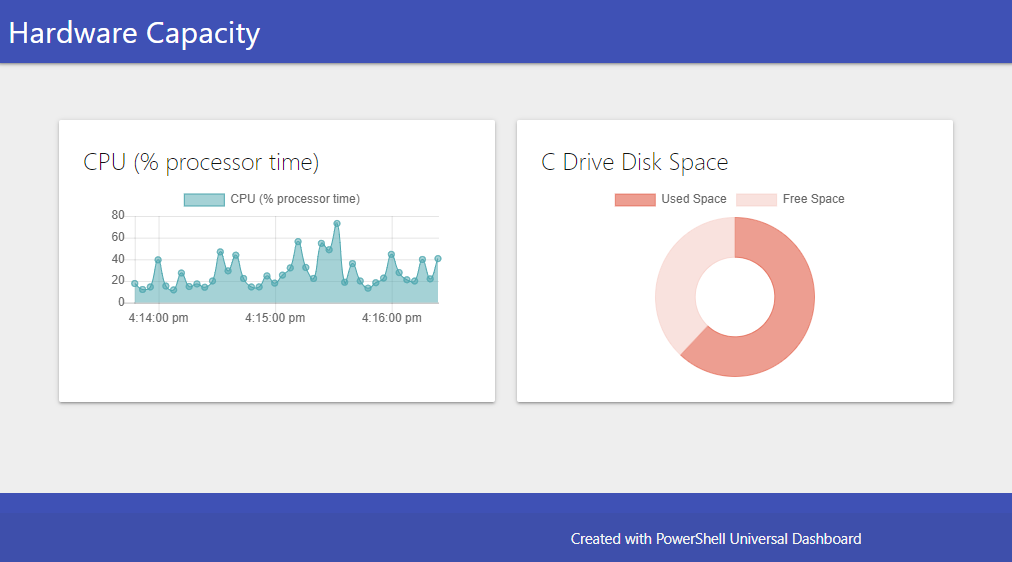
今回はローカル PC の CPU の使用量をリアルタイムで折れ線グラフで、 Disk の使用量を円グラフで描画してみたいと思います。
$dashboard = New-UDDashboard -Title "Hardware Capacity" -Content {

    New-UDLayout -Columns 2 {

        $cpuMonitorSettings = @{
            Title                = "CPU (% processor time)"
            Type                 = 'Line'
            DataPointHistory     = 40
            RefreshInterval      = 4
            ChartBackgroundColor = '#804ca6ae'
            ChartBorderColor     = '#ff4ca6ae'
            Endpoint             = {
                try {
                    (Get-Counter '\Processor(_Total)\% Processor Time').CounterSamples.CookedValue | Out-UDMonitorData
                } catch {
                    -1 | Out-UDMonitorData
                }
            }
        }

        New-UDMonitor @cpuMonitorSettings

        New-UDChart -Title "C Drive Disk Space" -Type Doughnut -Endpoint {

            $chartDataSettings = @{
                DataProperty         = "Data"
                LabelProperty        = "Label"
                BackgroundColor      = @("#80db3e23", "#80f4c5bd")
                HoverBackgroundColor = @("#80db3e23", "#80f4c5bd")
                BorderColor          = @("#80db3e23", "#80f4c5bd")
                HoverBorderColor     = @("#db3e23", "#f4c5bd")
            }

            try {
                Get-PSDrive -Name C | ForEach-Object {
                    @(
                        [PSCustomObject]@{
                            Label = "Used Space"
                            Data  = [Math]::Round(($_.Used) / 1GB, 2);
                        },
                        [PSCustomObject]@{
                            Label = "Free Space"
                            Data  = [Math]::Round($_.Free / 1GB, 2);
                        }
                    ) | Out-UDChartData @chartDataSettings
                }
            } catch {
                0 | Out-UDChartData -DataProperty "Data" -LabelProperty "Label"
            }
        }
    }

}

Start-UDDashboard -Dashboard $dashboard -Port 1000 -AutoReload
実行すると以下のようなダッシュボードが表示できました。
より詳しい使い方については公式ドキュメントが充実しているので、そちらをご参照ください。
ダッシュボードだけではなく、普通の WEB API もサポートされているようですね。

