本記事では、Prometheusを知らない人が試しながら調べながらエラー対応も含め記載していってます。
ので情報として煩雑な感じになっているのでご了承ください。
Prometheusを選んだ経緯
とある会社でインフラ担当をした時にインフラを一元的に管理しておらず、複数あるクラウド系のアカウントが開発エンジニアにわたり、
サーバが乱立され、本番環境、開発環境といった使い分けもされていなかったりで、何が何だか分かりません状態^^;;;
ひとまず、色々と問題は山積みだけど、とりあえず監視ツールでインスタンスが増えたら検知とかしてくれないかなー。って悩んでたら
10年来の友達であるGoogleがPrometheus良いよと言っていたので調査と試験導入を決意。
次世代監視の大本命! Prometheus を実運用してみた
「この service discovery は Prometheus 本体にがっちり組み込まれているので、設定ファイルにちょいっと書くだけで EC2 のホスト一覧を取ってこられます。もうね。最高ですよね。」
そうそう。。こういうの欲しかったのよ。
Prometheusとは
個人的には以下のサイトが一番分かりやすかった。
インフラ・サービス監視ツールの新顔「Prometheus」入門
これを見ながら構築でもしてみるかな。
とりあえず、サーバとexporterで認識が出来て、リソースが見れるって所までを目標にしよう。
という訳で試してみる
Ubuntuだからapt-getで行けるみたいだけど、提供バージョンと最新バージョンの機能差が激しそうなので、
公式からバイナリをダウンロードする方法でやってみる。
バイナリからの構築方法はとりあえず以下を参考にしてみた
Prometheus 環境構築手順
Prometheus Serverインストール
インストールというかバイナリ配置して起動するだけ
# wget https://github.com/prometheus/prometheus/releases/download/v2.3.1/prometheus-2.3.1.linux-amd64.tar.gz
# tar -zxvf prometheus-2.3.1.linux-amd64.tar.gz
# ls
prometheus-2.3.1.linux-amd64  prometheus-2.3.1.linux-amd64.tar.gz
# mv prometheus-2.3.1.linux-amd64 prometheus-2.3.1
# ls prometheus-2.3.1
console_libraries  LICENSE  prometheus      promtool
consoles           NOTICE   prometheus.yml
# ./prometheus -config.file=prometheus.yml &
[1] 1455
# Error parsing commandline arguments: unknown short flag '-c'
prometheus: error: unknown short flag '-c'
[1]+  Exit 1                  ./prometheus -config.file=prometheus.yml
#
エラー出たー。調べてみる。。。。
あー。-config.fileじゃなくて、--config.fileっぽい。
./prometheus --config.file=prometheus.yml &
[1] 1463
# level=info ts=2018-06-27T02:17:07.486654475Z caller=main.go:222 msg="Starting Prometheus" version="(version=2.3.1, branch=HEAD, revision=188ca45bd85ce843071e768d855722a9d9dabe03)"
level=info ts=2018-06-27T02:17:07.486835933Z caller=main.go:223 build_context="(go=go1.10.3, user=root@82ef94f1b8f7, date=20180619-15:56:22)"
level=info ts=2018-06-27T02:17:07.486942731Z caller=main.go:224 host_details="(Linux 4.4.0-1060-aws #69-Ubuntu SMP Sun May 20 13:42:07 UTC 2018 x86_64 ap-prometheus01 (none))"
level=info ts=2018-06-27T02:17:07.487053934Z caller=main.go:225 fd_limits="(soft=1024, hard=1048576)"
level=info ts=2018-06-27T02:17:07.488219753Z caller=main.go:514 msg="Starting TSDB ..."
level=info ts=2018-06-27T02:17:07.493209906Z caller=web.go:415 component=web msg="Start listening for connections" address=0.0.0.0:9090
level=info ts=2018-06-27T02:17:07.4940652Z caller=main.go:524 msg="TSDB started"
level=info ts=2018-06-27T02:17:07.494133486Z caller=main.go:603 msg="Loading configuration file" filename=prometheus.yml
level=info ts=2018-06-27T02:17:07.494979401Z caller=main.go:500 msg="Server is ready to receive web requests."
#
動いたかな。とりあえずブラウザで見てみるか。
※セキュリティグループとかのポートの許可はやっておこうね。
おお。。ログイン画面とか無いのか。。。
見れる場所とか限定しておかないとかなー。
今は自分自身だけ。。?でも自身にexporter入れてないけど?
とりあえずconfig.fileを見てみよう。
# my global config
global:
  scrape_interval:     15s # Set the scrape interval to every 15 seconds. Default is every 1 minute.
  evaluation_interval: 15s # Evaluate rules every 15 seconds. The default is every 1 minute.
  # scrape_timeout is set to the global default (10s).

# Alertmanager configuration
alerting:
  alertmanagers:
  - static_configs:
    - targets:
      # - alertmanager:9093

# Load rules once and periodically evaluate them according to the global 'evaluation_interval'.
rule_files:
  # - "first_rules.yml"
  # - "second_rules.yml"

# A scrape configuration containing exactly one endpoint to scrape:
# Here it's Prometheus itself.
scrape_configs:
  # The job name is added as a label `job=<job_name>` to any timeseries scraped from this config.
  - job_name: 'prometheus'

    # metrics_path defaults to '/metrics'
    # scheme defaults to 'http'.

    static_configs:
    - targets: ['localhost:9090']
分かり辛いな。。慣れが必要ですね。あと、Service Discoveryはどうするんだろう。。
でも次はとりあえず別のサーバにexporterを入れて確認してみよう。
さて、またここを見つつ。。
Prometheus 環境構築手順
バイナリダウンロードか。。。
ここまでやっておきつつ、思ったんだけど、exporterの方は監視するサーバ数から考えるとapt-getでやりたいな。。
まあダメだったらダメで、コンパチがあるか分からないけどapt-getでやってみる。
※6/28追記
使いたいコレクタがapt-getのバージョンだと使えなかった為、バイナリに入れ直してます。
Prometheusのすすめ - exporter導入 node-exporter(apt-get) -
ちなみにnode-exporterの起動オプションでポートやら、BASIC認証やら変更出来るっぽいです
node-exporterインストール(apt-get)
とりあえず同じ内部ネットワークに居るサーバに入れてみる。
※外部だったらセキュリティグループで許可を忘れずに。
また、普通にhttp://IP:Port/metricsで誰でも見れてしまうので気を付ける。
# apt-get install prometheus-node-exporter
Reading package lists... Done
Building dependency tree
Reading state information... Done
The following additional packages will be installed:
  daemon
The following NEW packages will be installed:
  daemon prometheus-node-exporter
0 upgraded, 2 newly installed, 0 to remove and 33 not upgraded.
Need to get 1,837 kB of archives.
After this operation, 8,177 kB of additional disk space will be used.
Do you want to continue? [Y/n] y
Get:1 http://ap-northeast-1.ec2.archive.ubuntu.com/ubuntu xenial/universe amd64 daemon amd64 0.6.4-1 [98.2 kB]
Get:2 http://ap-northeast-1.ec2.archive.ubuntu.com/ubuntu xenial/universe amd64 prometheus-node-exporter amd64 0.11.0+ds-1 [1,739 kB]
Fetched 1,837 kB in 0s (2,151 kB/s)
Selecting previously unselected package daemon.
(Reading database ... 59475 files and directories currently installed.)
Preparing to unpack .../daemon_0.6.4-1_amd64.deb ...
Unpacking daemon (0.6.4-1) ...
Selecting previously unselected package prometheus-node-exporter.
Preparing to unpack .../prometheus-node-exporter_0.11.0+ds-1_amd64.deb ...
Unpacking prometheus-node-exporter (0.11.0+ds-1) ...
Processing triggers for man-db (2.7.5-1) ...
Processing triggers for systemd (229-4ubuntu21.2) ...
Processing triggers for ureadahead (0.100.0-19) ...
Setting up daemon (0.6.4-1) ...
Setting up prometheus-node-exporter (0.11.0+ds-1) ...
Processing triggers for systemd (229-4ubuntu21.2) ...
Processing triggers for ureadahead (0.100.0-19) ...
Server側の設定を変える。
# vi prometheus.yml
+      - targets: ['172.31.41.83:9100']
# killall prometheus
# ./prometheus --config.file=prometheus.yml &
ブラウザで再度確認。Status->Targetsで見れるっぽい。
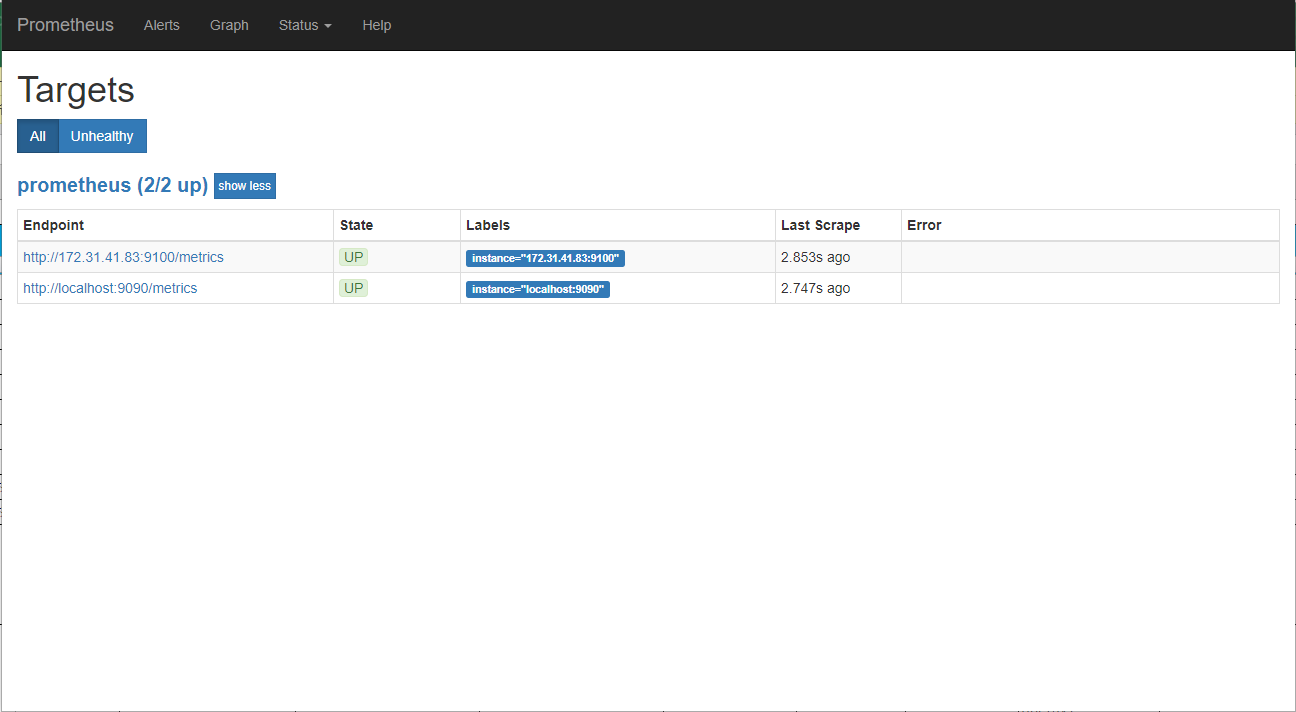
StatusがUPになってるし、認識はしているみたい。
グラフを見てみる。
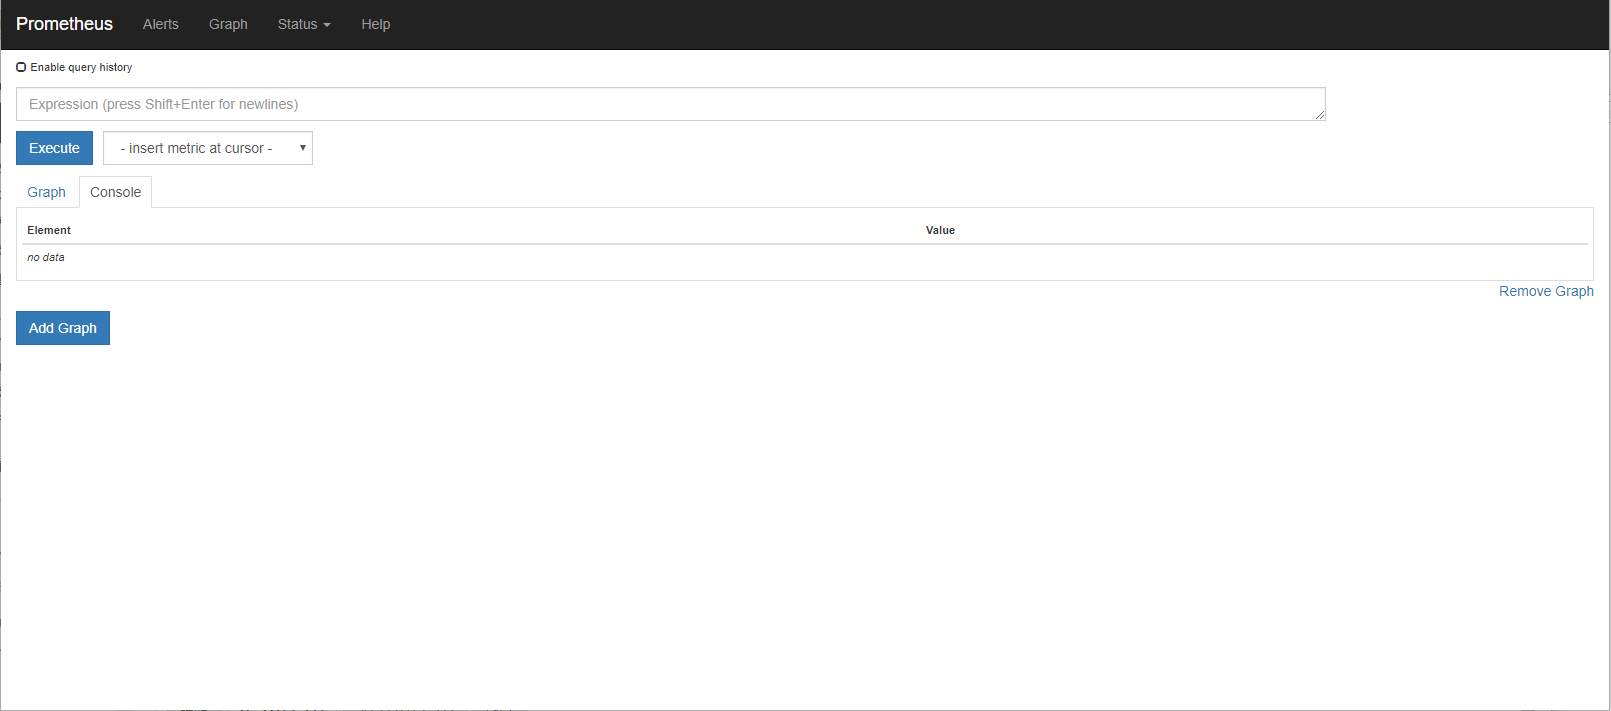
[Execute]の横のリストから適当に選んで[Execute]をクリック。
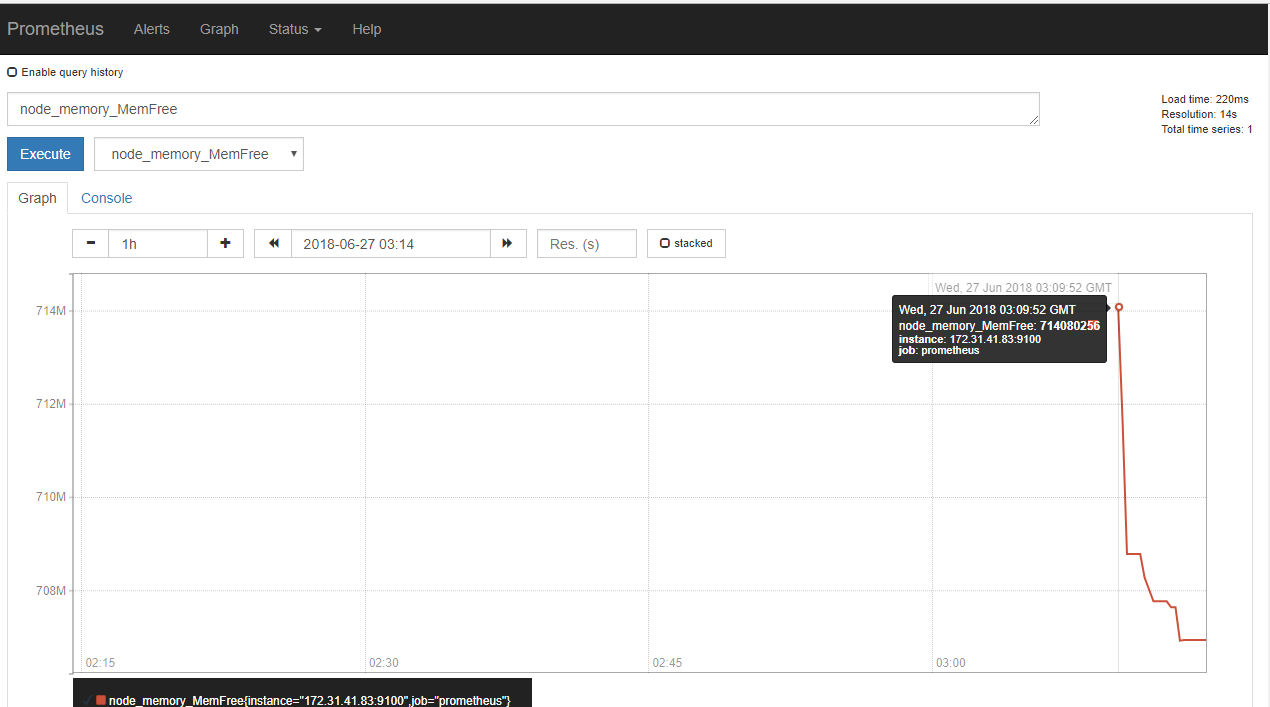
とりあえずバージョンとかは違っても値は取得してるっぽい。
時間がGMTってなってるな。
JSTにしたい、調べよう。。。。
https://github.com/prometheus/prometheus/issues/500
どうやら、今の所は無理みたい。残念。
ひとまずこれで終わりにして、Service Discoveryとかはまた今度かな。
参考URL