調査
と思ったので、探してみると、node_exporterのtextfile.directoryっていうコレクターで独自のメトリクスを作成できるらしい。
独自メトリクス取るなら Textfile Collector
要するに以下の様な形式でテキストファイル(拡張子prom)で作成すれば、勝手に読み取ってくれるよ。ってことらしい。
node_scrape_collector_duration_seconds{collector="cpu"} 0.000278377
node_scrape_collector_duration_seconds{collector="diskstats"} 0.000326093
どういう情報が欲しいか整理する。
情報としてはユーザ名と、最終ログインの情報が欲しい。
ってことはlastlogで取れる情報を整形すれば良さそう。
そういう訳で最終的には以下のようなフォーマットにしてみる。
node_user_info{username="",latest="",fromip="",tty=""} 1
スクリプト作成
上の参考記事だとrubyやら使ってるけど、私のスキルレベルだとシェルで作るのがせいいっぱいです。。
環境 : Ubuntu 16.04
# !/bin/bash
OUTPUT=/usr/local/node_exporter/textfile/userlist.prom

# Ubuntu 16.04だと作られたユーザはUID 1000から採番されるのでとりあえず1000-2999までのIDを持つものでgrep
USERLIST=`cat /etc/passwd | grep -e '[1-2][0-9][0-9][0-9]' | awk -F: '{print $1}'`


# OUTPUT 初期化
: > $OUTPUT
# 処理
for i in $USERLIST;do
    NAME=$i
    PTTY=`lastlog -u $i | grep $i | awk '{print $2}'`
    FROMIP=`lastlog -u $i | grep $i | awk '{print $3}'`
    LATEST=`lastlog -u $i | grep $i | awk '{print $9" "$5" "$6" "$7" "}'`
cat << EOF >> $OUTPUT
node_user_info{username="${NAME}",latest="${LATEST}",fromip="${FROMIP}",tty="${PTTY}"} 1
EOF
done
このスクリプトをcronで回しておけば良いんではないでしょうか。
仕込み
コレクターの有効化を忘れずに。
# BEGIN ANSIBLE MANAGED BLOCK
[Unit]
Description=node_exporter for Prometheus

[Service]
Restart=always
User=prometheus
ExecStart=/usr/bin/node_exporter \
    --web.listen-address=0.0.0.0:9100 \
    --collector.diskstats.ignored-devices="^(dm-|ram|loop|fd|(h|s|v|xv)d[a-z]|nvme\\d+n\\d+p)\\d+$" \
    --collector.filesystem.ignored-mount-points="^/(dev|proc|sys|run|var/lib/(docker|lxcfs|nobody_tmp_secure))($|/)" \
    --collector.filesystem.ignored-fs-types="^(autofs|binfmt_misc|cgroup|configfs|debugfs|devpts|devtmpfs|fuse.*|hugetlbfs|mqueue|overlay|proc|procfs|pstore|rpc_pipefs|securityfs|sysfs|tracefs)$" \
    --collector.netdev.ignored-devices="^(lo|docker[0-9]|veth.+)$" \
    --no-collector.conntrack \
    --collector.cpu \
    --collector.diskstats \
    --no-collector.filefd \
    --collector.filesystem \
    --collector.loadavg \
    --collector.meminfo \
    --collector.netdev \
    --collector.netstat \
    --no-collector.ntp \
    --no-collector.sockstat \
    --collector.stat \
-   --no-colletctor.textfile \
+    --collector.textfile \
    --no-collector.time \
    --collector.uname \
    --collector.vmstat \
    --no-collector.arp \
    --no-collector.bcache \
    --no-collector.bonding \
    --no-collector.buddyinfo \
    --no-collector.drbd \
    --no-collector.edac \
    --no-collector.entropy \
    --no-collector.hwmon \
    --no-collector.infiniband \
    --no-collector.interrupts \
    --no-collector.ipvs \
    --no-collector.ksmd \
    --no-collector.logind \
    --no-collector.mdadm \
    --no-collector.meminfo_numa \
    --no-collector.mountstats \
    --no-collector.nfs \
    --no-collector.nfsd \
    --no-collector.qdisc \
    --no-collector.runit \
    --no-collector.supervisord \
    --no-collector.systemd \
    --no-collector.tcpstat \
    --no-collector.timex \
    --no-collector.wifi \
    --no-collector.xfs \
    --no-collector.zfs \
+    --collector.textfile.directory=/usr/local/node_exporter/textfile/

ExecReload=/bin/kill -HUP $MAINPID
TimeoutStopSec=20s
SendSIGKILL=no

[Install]
WantedBy=multi-user.target
# END ANSIBLE MANAGED BLOCK
あとcron
*/15 * * * * /usr/local/node_exporter/userlist.sh
結果
とりあえず、自サーバからcurlでmetricsが取れるか確かめる
root# curl http://localhost:9100/metrics | grep user
  % Total    % Received % Xferd  Average Speed   Time    Time     Time  Current
                                 Dload  Upload   Total   Spent    Left  Speed
100 29320  100 29320    0     0  2003k      0 --:--:-- --:--:-- --:--:-- 2045k
node_cpu_guest_seconds_total{cpu="0",mode="user"} 0
node_cpu_seconds_total{cpu="0",mode="user"} 319.13
# HELP node_filesystem_avail_bytes Filesystem space available to non-root users in bytes.
node_textfile_mtime_seconds{file="userlist.prom"} 1.530865161e+09
# HELP node_user_info Metric read from /usr/local/node_exporter/textfile/userlist.prom
# TYPE node_user_info untyped
node_user_info{fromip="XX.XXX.XXX.210",latest="2018 Jul 6 15:11:02 ",tty="pts/2",username="XXX"} 1
node_user_info{fromip="XX.XXX.XXX.210",latest="2018 Jul 6 15:57:09 ",tty="pts/1",username="ubuntu"} 1
node_user_info{fromip="XX.XXX.XXX.210",latest="2018 Jul 6 16:37:33 ",tty="pts/3",username="XXXXX"} 1
取れてますね。よしよし。
Grafanaでリスト化
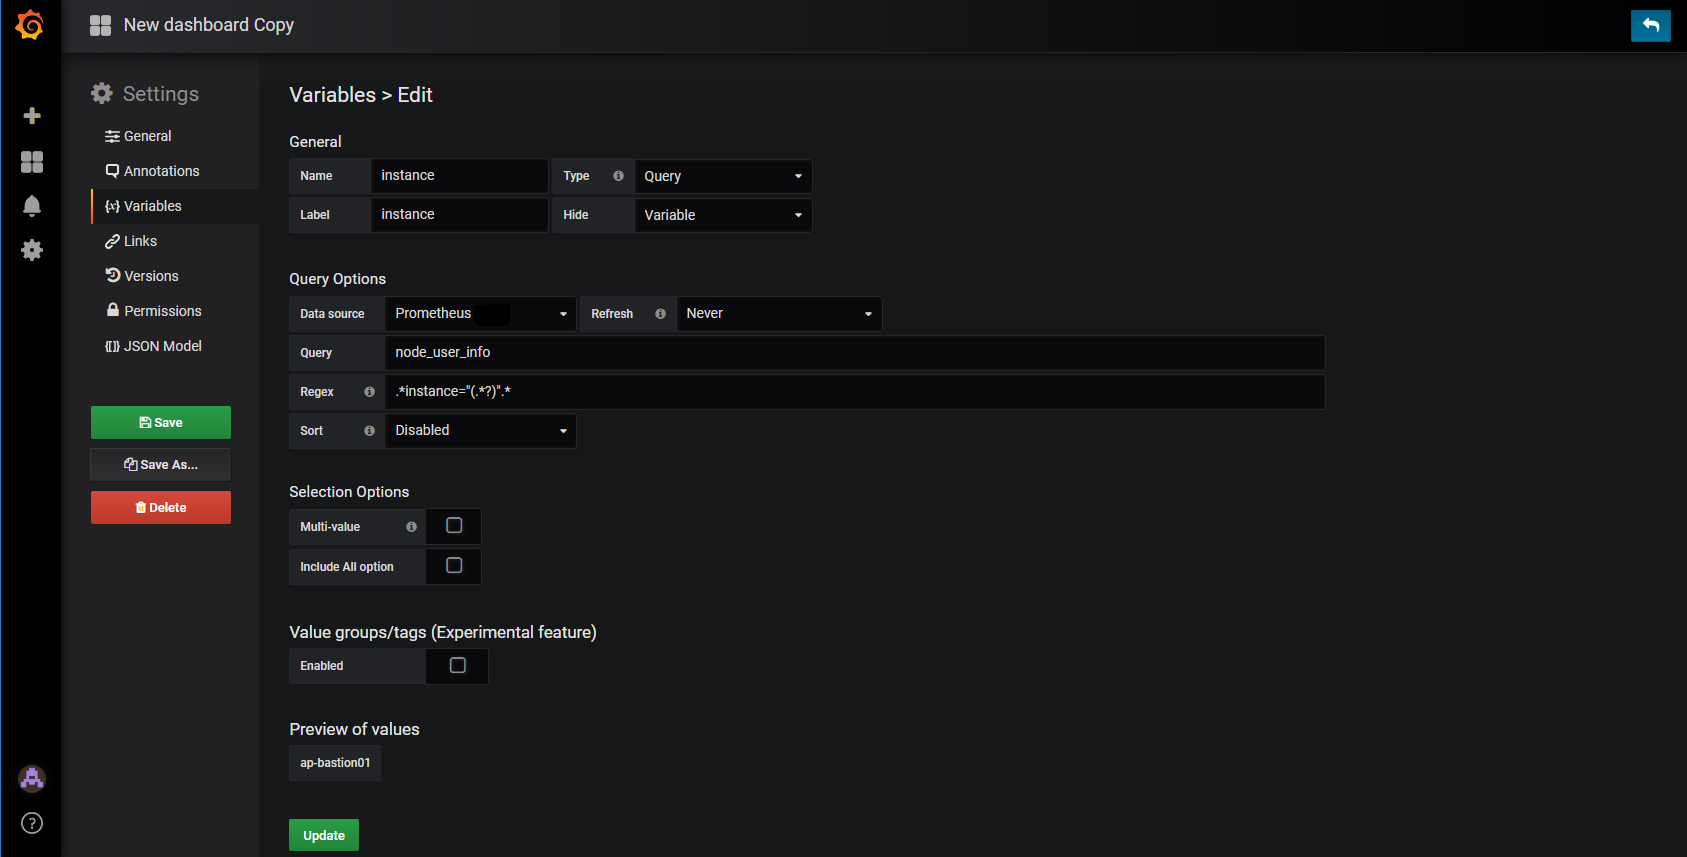
Variables設定
Name: 任意
Lable: instance
Hide: Variable
Query: node_user_info
Regex: .*instance="(.*?)".*
次にtable追加
query : node_user_info{instance='$instance'}
Instantにチェック
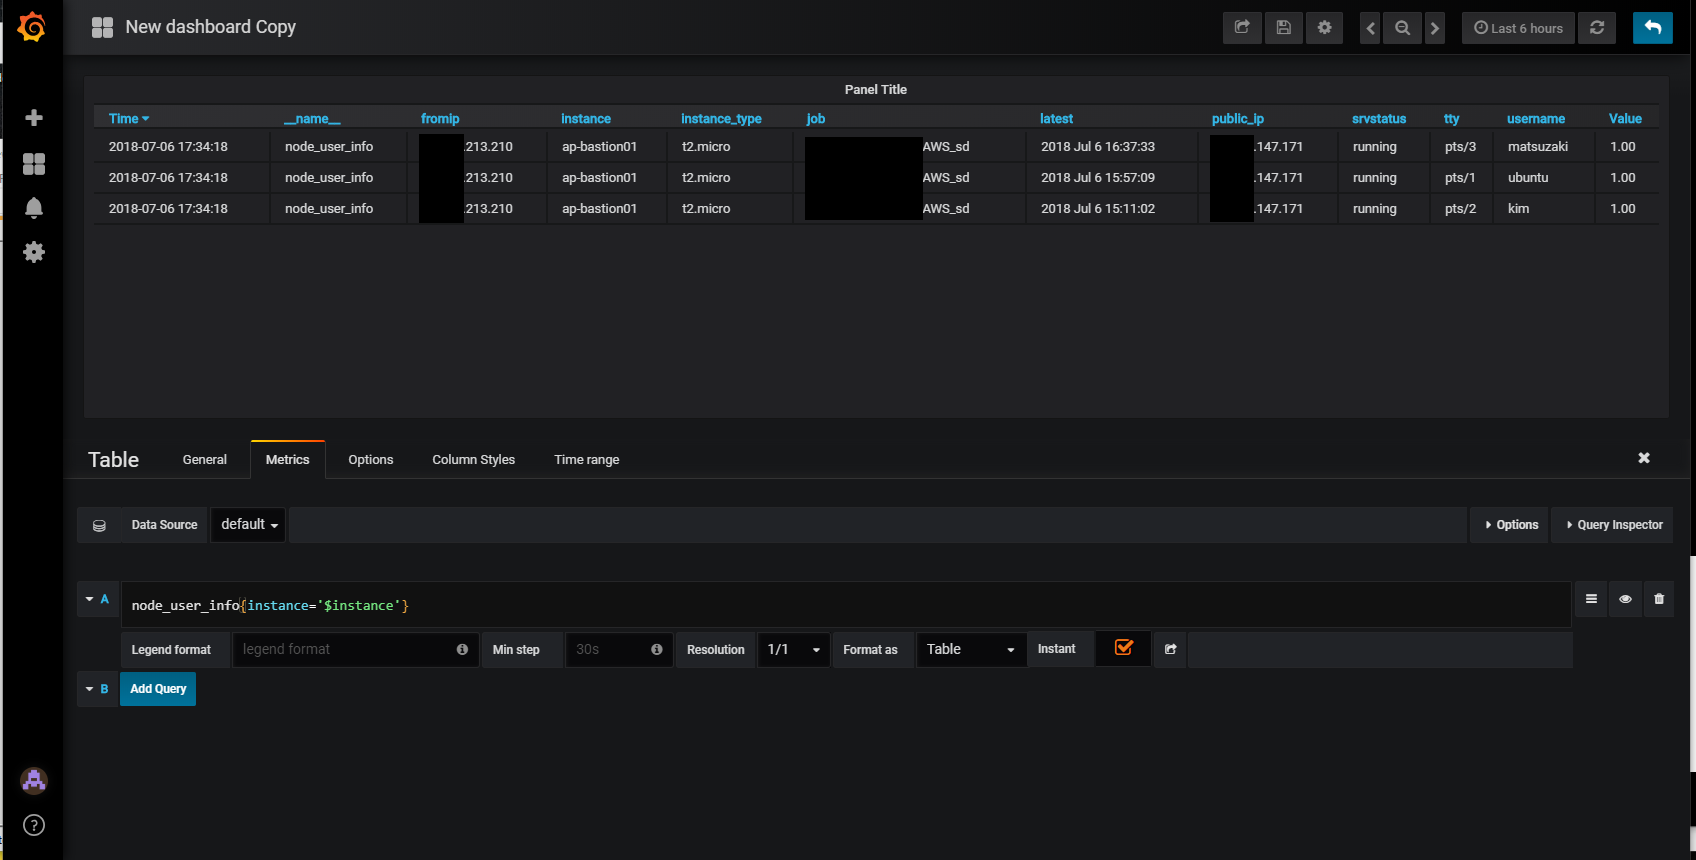
後は、好きに列非表示にしたりですればヨロシ。
参考URL
https://github.com/prometheus/node_exporter#textfile-collector
独自メトリクス取るなら Textfile Collector
Prometheus 過去記事
Prometheusのすすめ - 初期導入 -
Prometheusのすすめ - Service Discovery -
Prometheusのすすめ - exporter導入 node-exporter(apt-get) -
Prometheusのすすめ - exporter導入 node-exporter(バイナリ) -
Prometheusのすすめ - Service Discovery - EndPointが「http://:9100/metrics」になって、自分自身になってしまう件