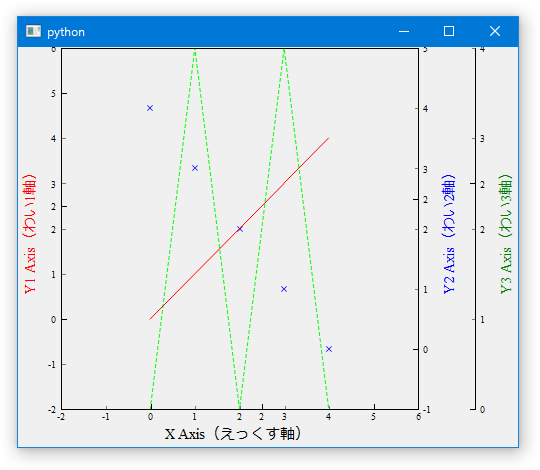
その5 Y軸を増やす
その4までのコメントは削除
import sys
from PySide.QtCore import *
from PySide.QtGui import *
import pyqtgraph as pg


class GraphWindow(QMainWindow):

    def __init__(self, parent = None):

        super(GraphWindow, self).__init__(parent)

        pw = pg.PlotWidget(viewBox = pg.ViewBox(border = pg.mkPen(color='#000000'),
                                                invertX = False, invertY = False))

        self.setCentralWidget(pw)

        pw.setBackground("#FFFFFF00")

        pw.setMinimumSize(500, 400)
        pw.setMaximumSize(500, 400)

        ## 5 plotItemとViewBoxを3個および3つ目のY軸を作成する
        ##   GraphFrameを設定する
        ##   plotItemとViewBox3個および3つ目のY軸を1つのグラフに合成する
        p1 = pw.plotItem
        p2 = pg.ViewBox()
        p3 = pg.ViewBox()
        ax3 = pg.AxisItem(orientation = 'right')
        self.setGraphFrameFont(p1, p2, p3, ax3)
        self.setGraphMultipleAxis(p1, p2, p3, ax3)

        ## 5 軸ラベルを設定する
        p1.setLabels(bottom = "X Axis(えっくす軸)",
                     left = "Y1 Axis(わい1軸)",
                     right = "Y2 Axis(わい2軸)")
        ax3.setLabel("Y3 Axis(わい3軸)")

        ## 5 軸ラベルのフォントを設定する
        fontCss = {'font-family': "Times New Roman, メイリオ", 'font-size': '10.5pt', "color": "black"}
        p1.getAxis('bottom').setLabel(**fontCss)
        fontCss["color"] = "red"
        p1.getAxis('left').setLabel(**fontCss)
        fontCss["color"] = "blue"
        p1.getAxis('right').setLabel(**fontCss)
        fontCss["color"] = "green"
        ax3.setLabel(**fontCss)

        ## 5 レンジを設定する
        p1.setRange(xRange = (-2, 6), yRange = (-2, 6), padding = 0)
        p2.setRange(yRange = (-1, 5), padding = 0)
        p3.setRange(yRange = (0, 4), padding = 0)

        ## 5 目盛りを設定する
        p1.getAxis('bottom').setTickSpacing(major = 2.5, minor = 1)
        p1.getAxis('left').setTickSpacing(major = 2.5, minor = 1)
        p1.getAxis('right').setTickSpacing(major = 2.5, minor = 1)
        ax3.setTickSpacing(major = 2.5, minor = 1)

        ## 5 グラフを描写する
        p1.addItem(pg.PlotCurveItem(x = [0, 1, 2, 3 ,4],
                                    y = [0, 1, 2, 3 ,4],
                                    pen = pg.mkPen(color = "r", style = Qt.SolidLine),
                                    name = "plot1",
                                    antialias = True))
        p2.addItem(pg.ScatterPlotItem(x = [0, 1, 2, 3 ,4],
                                      y = [4, 3, 2, 1, 0],
                                      symbol = "x",
                                      pen = pg.mkPen(None),
                                      brush = pg.mkBrush("b"),
                                      size = 7.5,
                                      name = "plot2",
                                      antialias = True))
        p3.addItem(pg.PlotCurveItem(x = [0, 1, 2, 3 ,4],
                                    y = [0, 4, 0, 4, 0],
                                    pen = pg.mkPen(color = "g", style = Qt.DashLine),
                                    name = "plot3",
                                    antialias = True))


    def setGraphFrameFont(self, p1, p2 = None, p3 = None, ax3 = None):
        font = QFont("Times New Roman", 7)

        p1.getAxis('bottom').setPen(pg.mkPen(color='#000000'))
        p1.getAxis('left').setPen(pg.mkPen(color='#000000'))
        p1.getAxis('bottom').setHeight(3.5 * 10.5)
        p1.getAxis('left').setWidth(4 * 10.5)

        #p1.getAxis('bottom').setLabel(**self.fontCss)
        p1.getAxis('bottom').tickFont = font
        #p1.getAxis('left').setLabel(**self.fontCss)
        p1.getAxis('left').tickFont = font

        if p2 != None:
            p1.getAxis('right').setPen(pg.mkPen(color='#000000'))
            p1.getAxis('right').setWidth(4 * 10.5)

            #p1.getAxis('right').setLabel(**self.fontCss)
            p1.getAxis('right').tickFont = font

        if p3 != None and ax3 != None:
            ax3.setPen(pg.mkPen(color='#000000'))
            ax3.setWidth(4 * 10.5)

            #ax3.setLabel(**self.fontCss)
            ax3.tickFont = font

    ## 5 複数Y軸グラフ化する
    def setGraphMultipleAxis(self, p1, p2, p3 = None, ax3 = None):
        p1.showAxis('right')
        p1.scene().addItem(p2)
        p1.getAxis('right').linkToView(p2)
        p2.setXLink(p1)

        p2.sigRangeChanged.connect(lambda: p2.setGeometry(p1.vb.sceneBoundingRect()))

        if p3 != None and ax3 != None:
            spacer = QGraphicsWidget()
            spacer.setMaximumSize(15,15)
            p1.layout.addItem(spacer, 2, 3)

            p1.layout.addItem(ax3, 2, 4)
            p1.scene().addItem(p3)
            ax3.linkToView(p3)
            p3.setXLink(p1)

            p3.sigRangeChanged.connect(lambda: p3.setGeometry(p1.vb.sceneBoundingRect()))
