はじめに
こんにちは!
本記事は「本気で学ぶKubernetes」シリーズの第14回です。このシリーズでは、Kubernetesの基礎から実践まで、段階的に学んでいきます。
このシリーズは、第1回から順に読むことで体系的に学べる構成にしています。
まだご覧になっていない方は、ぜひ最初からご覧ください!
今回は、PrometheusとGrafanaを使ったメトリクス監視について学んでいきたいと思います。
この記事は人間がKubernetesの公式ドキュメントを読み漁りながら書いていますのでご安心ください!
Prometheusとは
Kubernetesクラスタ(一般的にどんなサーバーも)を運用し始めると、「正常に動いているか?」「CPU使用率が上がっていないか」「メモリは足りているか?」といったサーバーリソースの監視が必要になってきます。
こういった情報を常に把握するためにメトリクス監視が必要になってきます。
Kubernetesではメトリクス監視用のサービスとして「Prometheus」がデファクトスタンダードとして広く利用されています。
Prometheusを利用するとKubernetesクラスタ内のPodやNode、コンテナから自動的にメトリクスを収集して時系列データとして保存することができます。
アラート機能も備わっているので設定した条件でアラートを発火させることも可能です。
Grafanaとは
Prometheusとセットで「Grafana」というツールが用いられます。
これはPrometheusなどのデータソースからメトリクスを取得して、グラフやダッシュボードで可視化するツールです。
Prometheusがメトリクスの収集と保存を担当するのに対しGrafanaはその可視化を行います。こちらもPrometheusと一緒に使われるデファクトスタンダードです。
出典: Grafana公式ドキュメント
実際にPrometheusとGrafanaを使ってみる
今回は、minikubeクラスタにPrometheusとGrafanaをデプロイして、実際にメトリクスを確認してみます。
リソースはHelmを使ってインストール、デプロイまでを行います。
minikubeクラスタを起動しておきます。
minikube start
Helmを使ってPrometheusをインストールします。
まずPrometheusのHelmリポジトリを追加します。
helm repo add prometheus-community https://prometheus-community.github.io/helm-charts

# "prometheus-community" has been added to your repositories

helm repo update

# Hang tight while we grab the latest from your chart repositories...
# ...Successfully got an update from the "prometheus-community" chart repository
# Update Complete. ⎈Happy Helming!⎈
Prometheusをインストールします。
helm install prometheus prometheus-community/prometheus

# NAME: prometheus
# LAST DEPLOYED: ...
# NAMESPACE: default
# STATUS: deployed
# REVISION: 1
# ...省略...
インストールが完了したら、Podの状態を確認してみます。
kubectl get pods

# NAME                                                 READY   STATUS    RESTARTS   AGE
# prometheus-alertmanager-0                            1/1     Running   0          30s
# prometheus-kube-state-metrics-xxxxxxxxxx-xxxxx       1/1     Running   0          30s
# prometheus-prometheus-node-exporter-xxxxx            1/1     Running   0          30s
# prometheus-prometheus-pushgateway-xxxxxxxxxx-xxxxx   1/1     Running   0          30s
# prometheus-server-xxxxxxxxxx-xxxxx                   2/2     Running   0          30s
それぞれのPodを簡単に説明します。
- prometheus-server: メトリクス収集と保存を担当するコンポーネント
- prometheus-alertmanager: アラート通知を管理するコンポーネント
- prometheus-kube-state-metrics: Kubernetesクラスタの状態をメトリクスとして公開
- prometheus-node-exporter: KubernetesノードのCPUやメモリ、ディスクなどのメトリクスを収集
- prometheus-prometheus-pushgateway: 短時間のバッチジョブやサービスレベルジョブからメトリクスを受け取るコンポーネント
全てのPodがRunningになっていれば無事に起動できています。
Prometheus UIで生データを確認する
Grafanaがメトリクスの可視化のためのツールと前述しましたが、Prometheus自体にもWeb UI機能が搭載されています。
kubectl port-forward svc/prometheus-server 9090:80

# Forwarding from 127.0.0.1:9090 -> 9090
# Forwarding from [::1]:9090 -> 9090
ブラウザでhttp://localhost:9090にアクセスすると、Prometheus UIが表示されます。
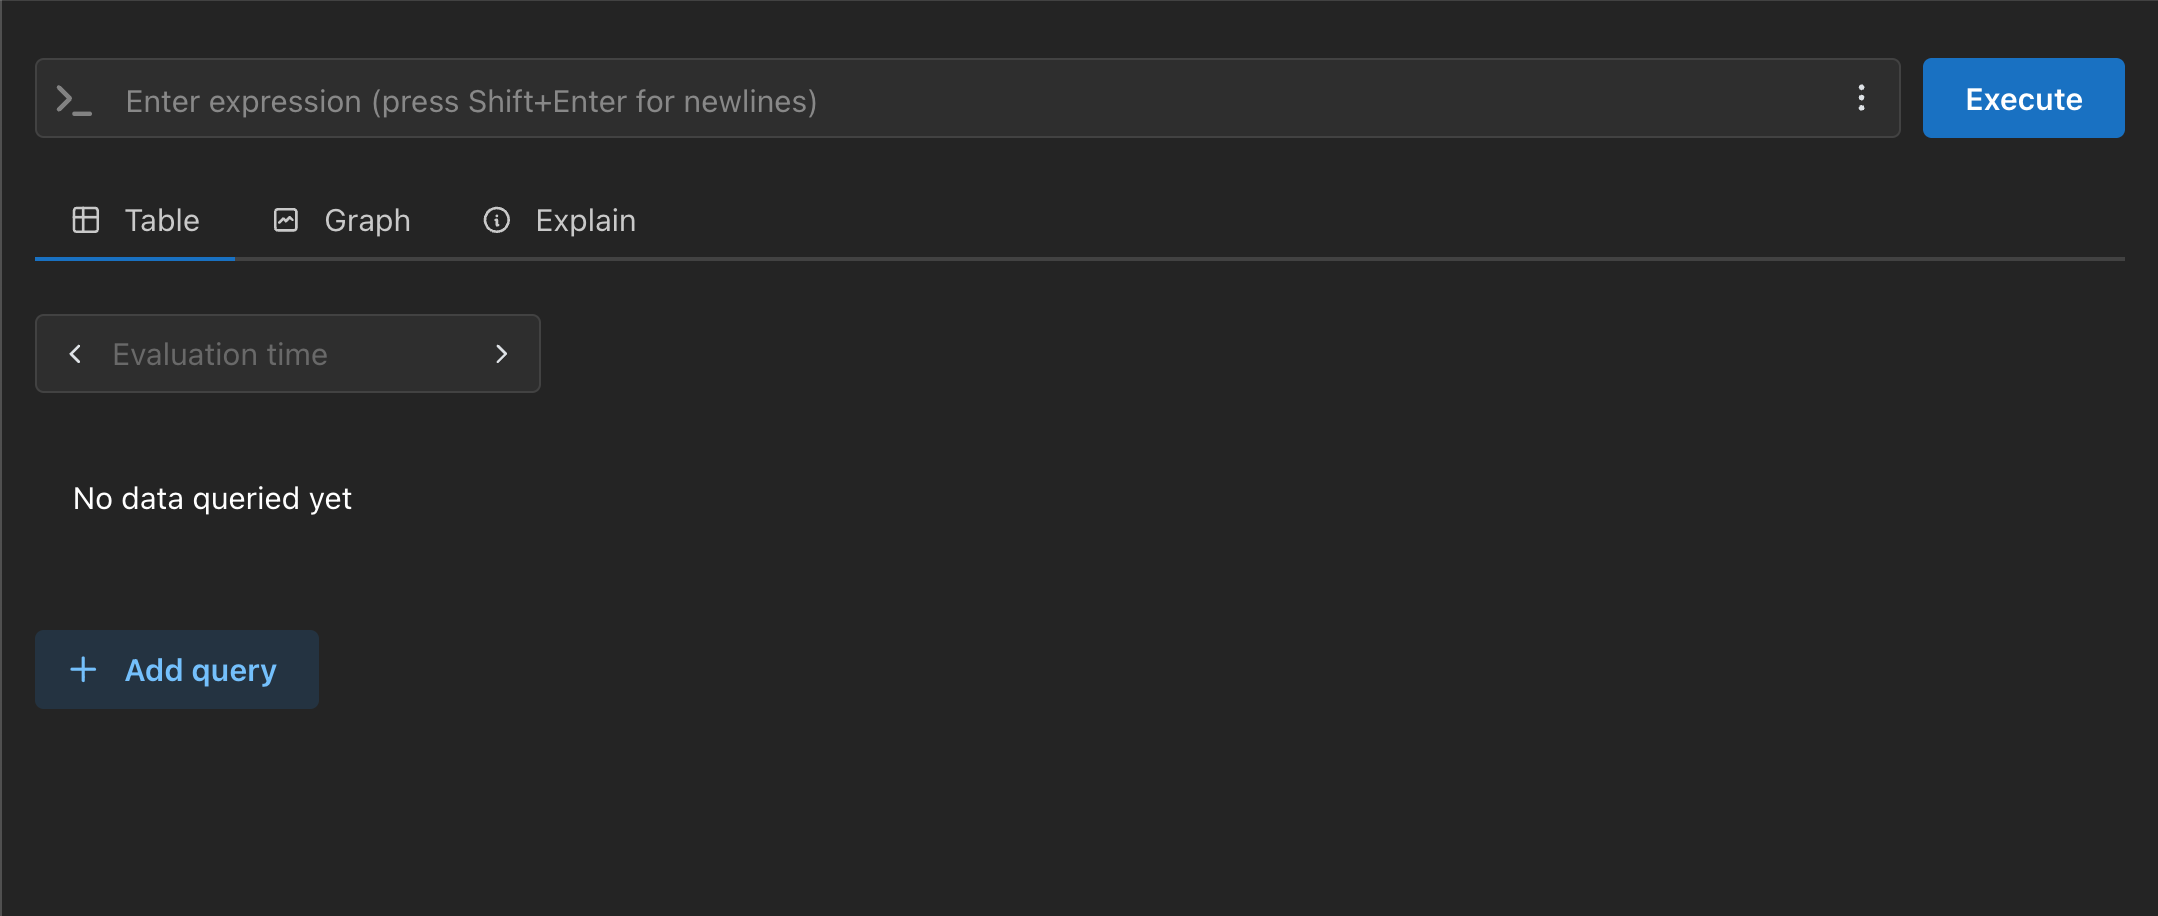
公式ドキュメントにもある簡単なクエリを実行してみます。上部の入力欄に以下のクエリを入力して「Execute」をクリックします。
prometheus_target_interval_length_seconds
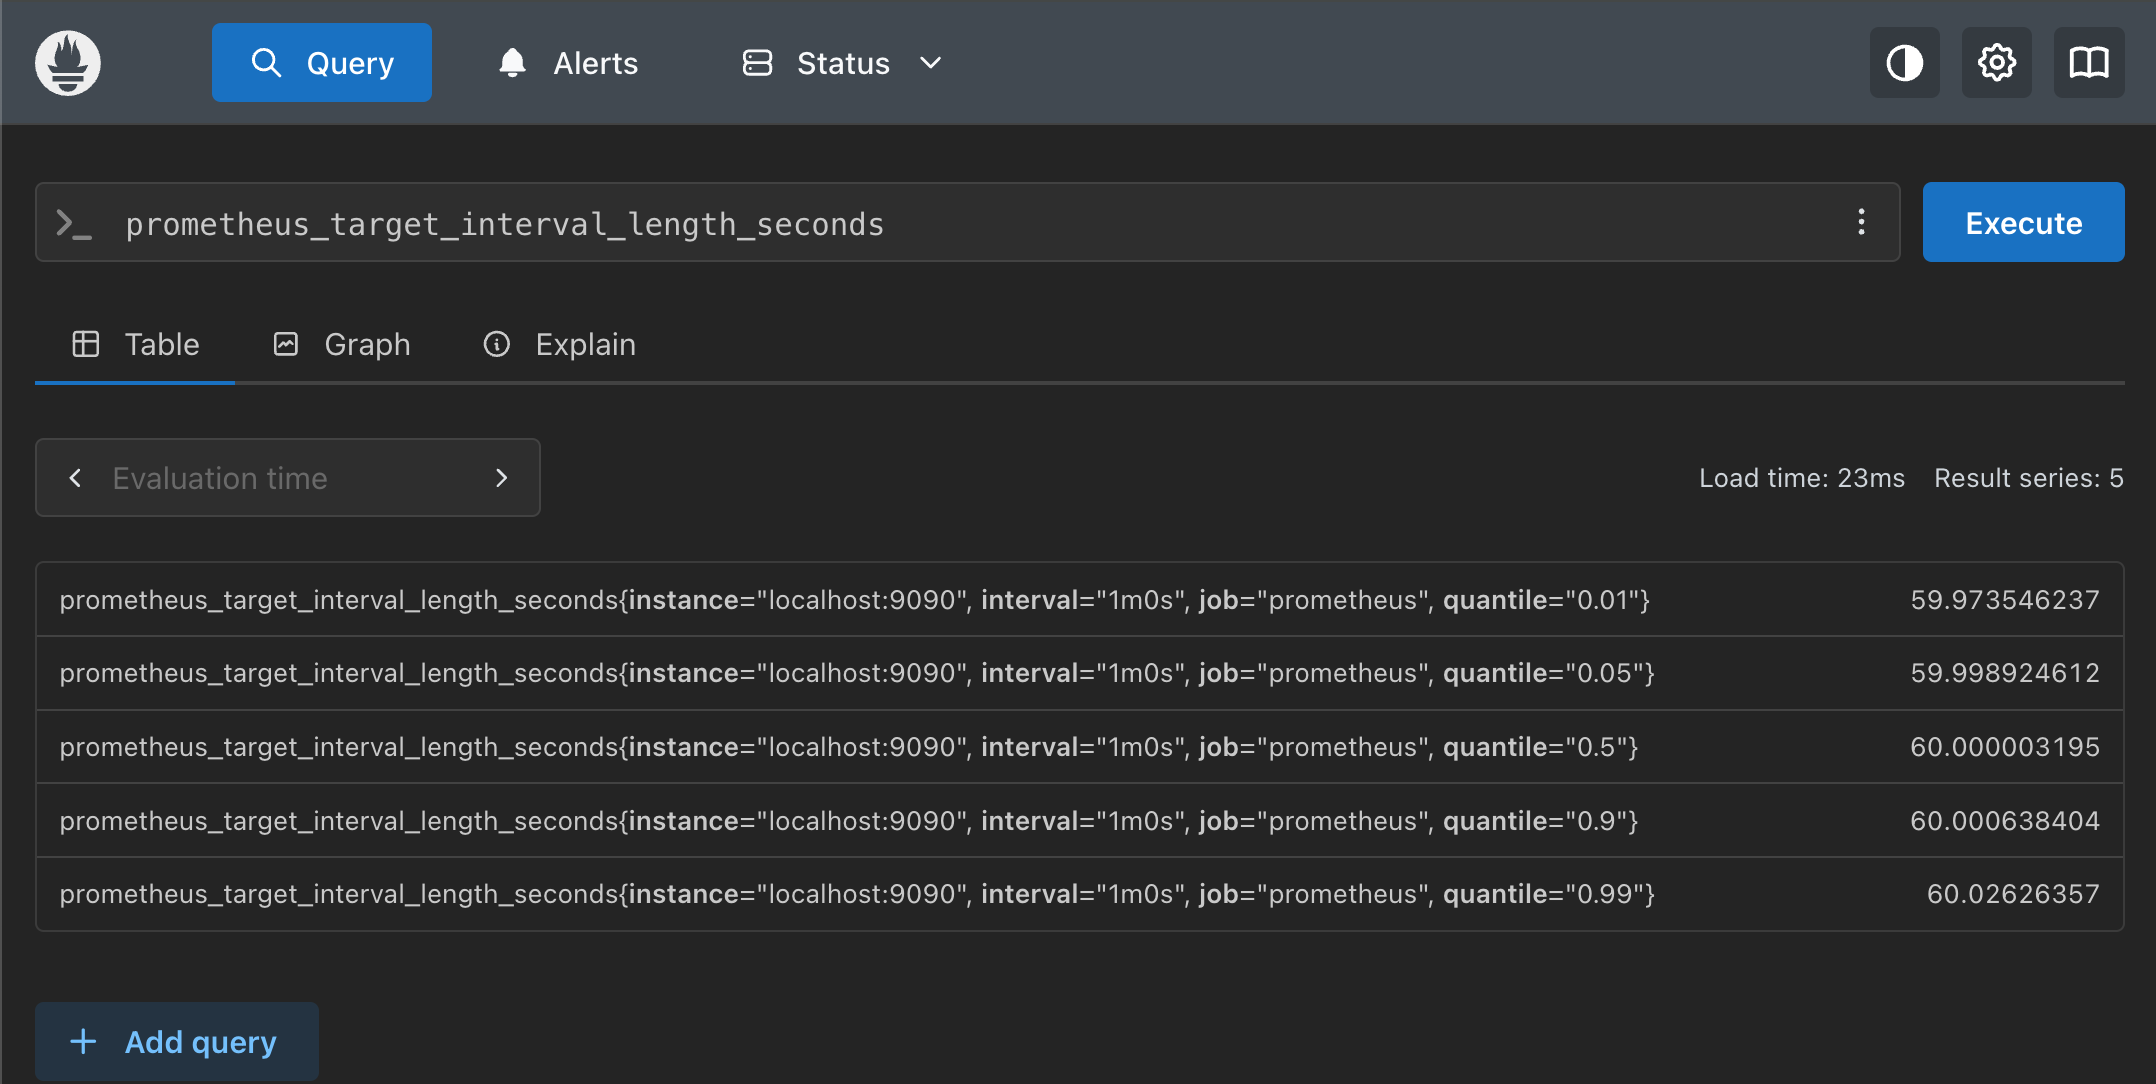
Prometheusが収集した生のメトリクスデータ表示することができました。
確認できたら、このポートフォワードはCtrl + Cで停止しておいてください。
正直なところ機能は最小限ですし、Web UIとしても少しみづらいと思います。
Grafanaで確認する
次は可視化ツールのGrafanaをデプロイして確認します。
まずはGrafanaのHelmリポジトリを追加します。
helm repo add grafana https://grafana.github.io/helm-charts

# "grafana" has been added to your repositories

helm repo update

# Hang tight while we grab the latest from your chart repositories...
# ...Successfully got an update from the "grafana" chart repository
# Update Complete. ⎈Happy Helming!⎈
Grafanaをインストールします。
helm install grafana grafana/grafana

# NAME: grafana
# LAST DEPLOYED: ...
# NAMESPACE: default
# STATUS: deployed
# REVISION: 1
# ...省略...
Grafanaはログインする必要があるので管理者パスワードを取得しておきます。
kubectl get secret grafana -o jsonpath="{.data.admin-password}" | base64 --decode ; echo

# xxxxxxxxxxxxxxxxxxxxxxxxxxx
※このパスワードは後でGrafanaにログインする際に使用するのでメモしておいてください。
Grafanaへのアクセス
GrafanaはServiceとしてデプロイされていますが、minikube環境では直接アクセスできないためこちらもポートフォワードします。
kubectl port-forward svc/grafana 3000:80

# Forwarding from 127.0.0.1:3000 -> 3000
# Forwarding from [::1]:3000 -> 3000
ブラウザでhttp://localhost:3000にアクセスします。
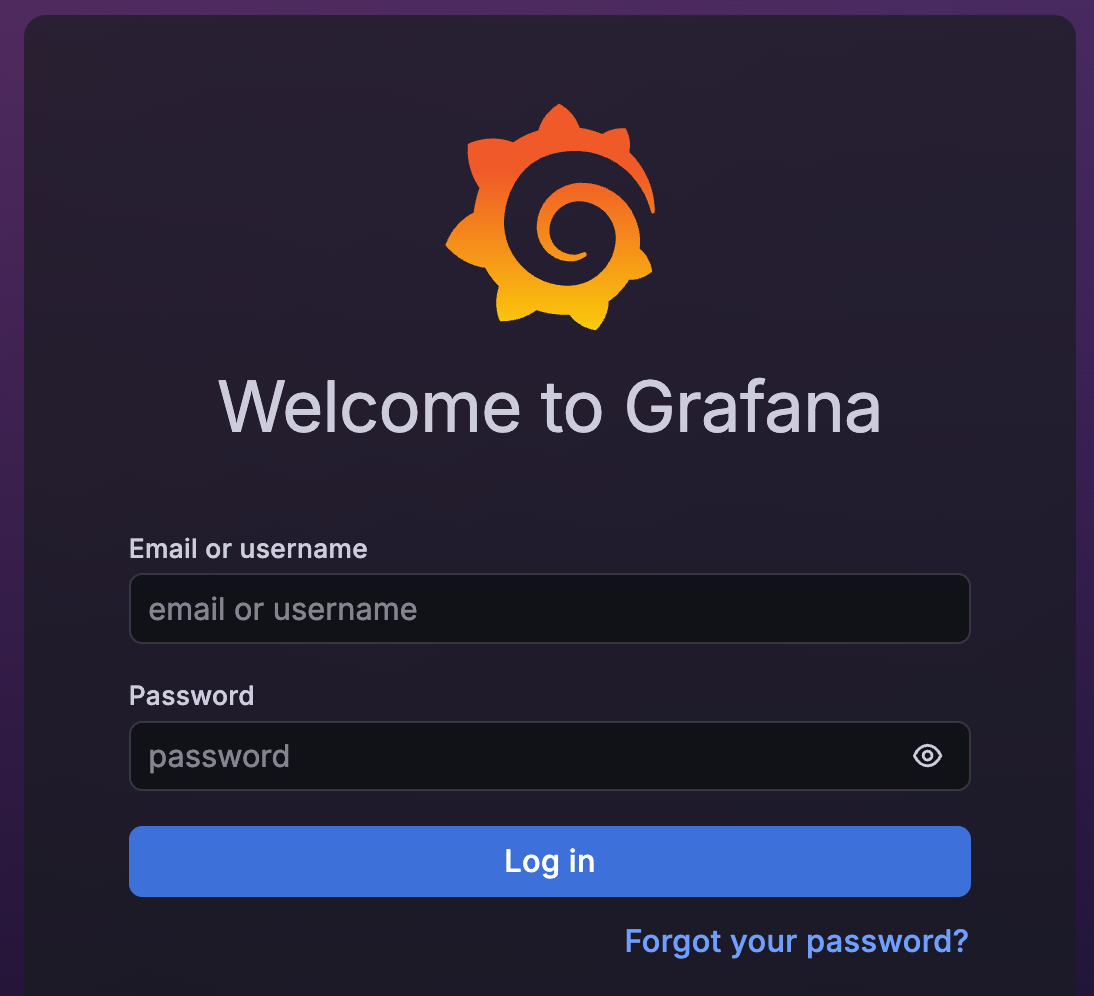
ログイン画面が表示されるので、以下の情報でログインします。
- Username:
admin - Password: 先ほど取得したパスワード
Prometheusをデータソースとして設定
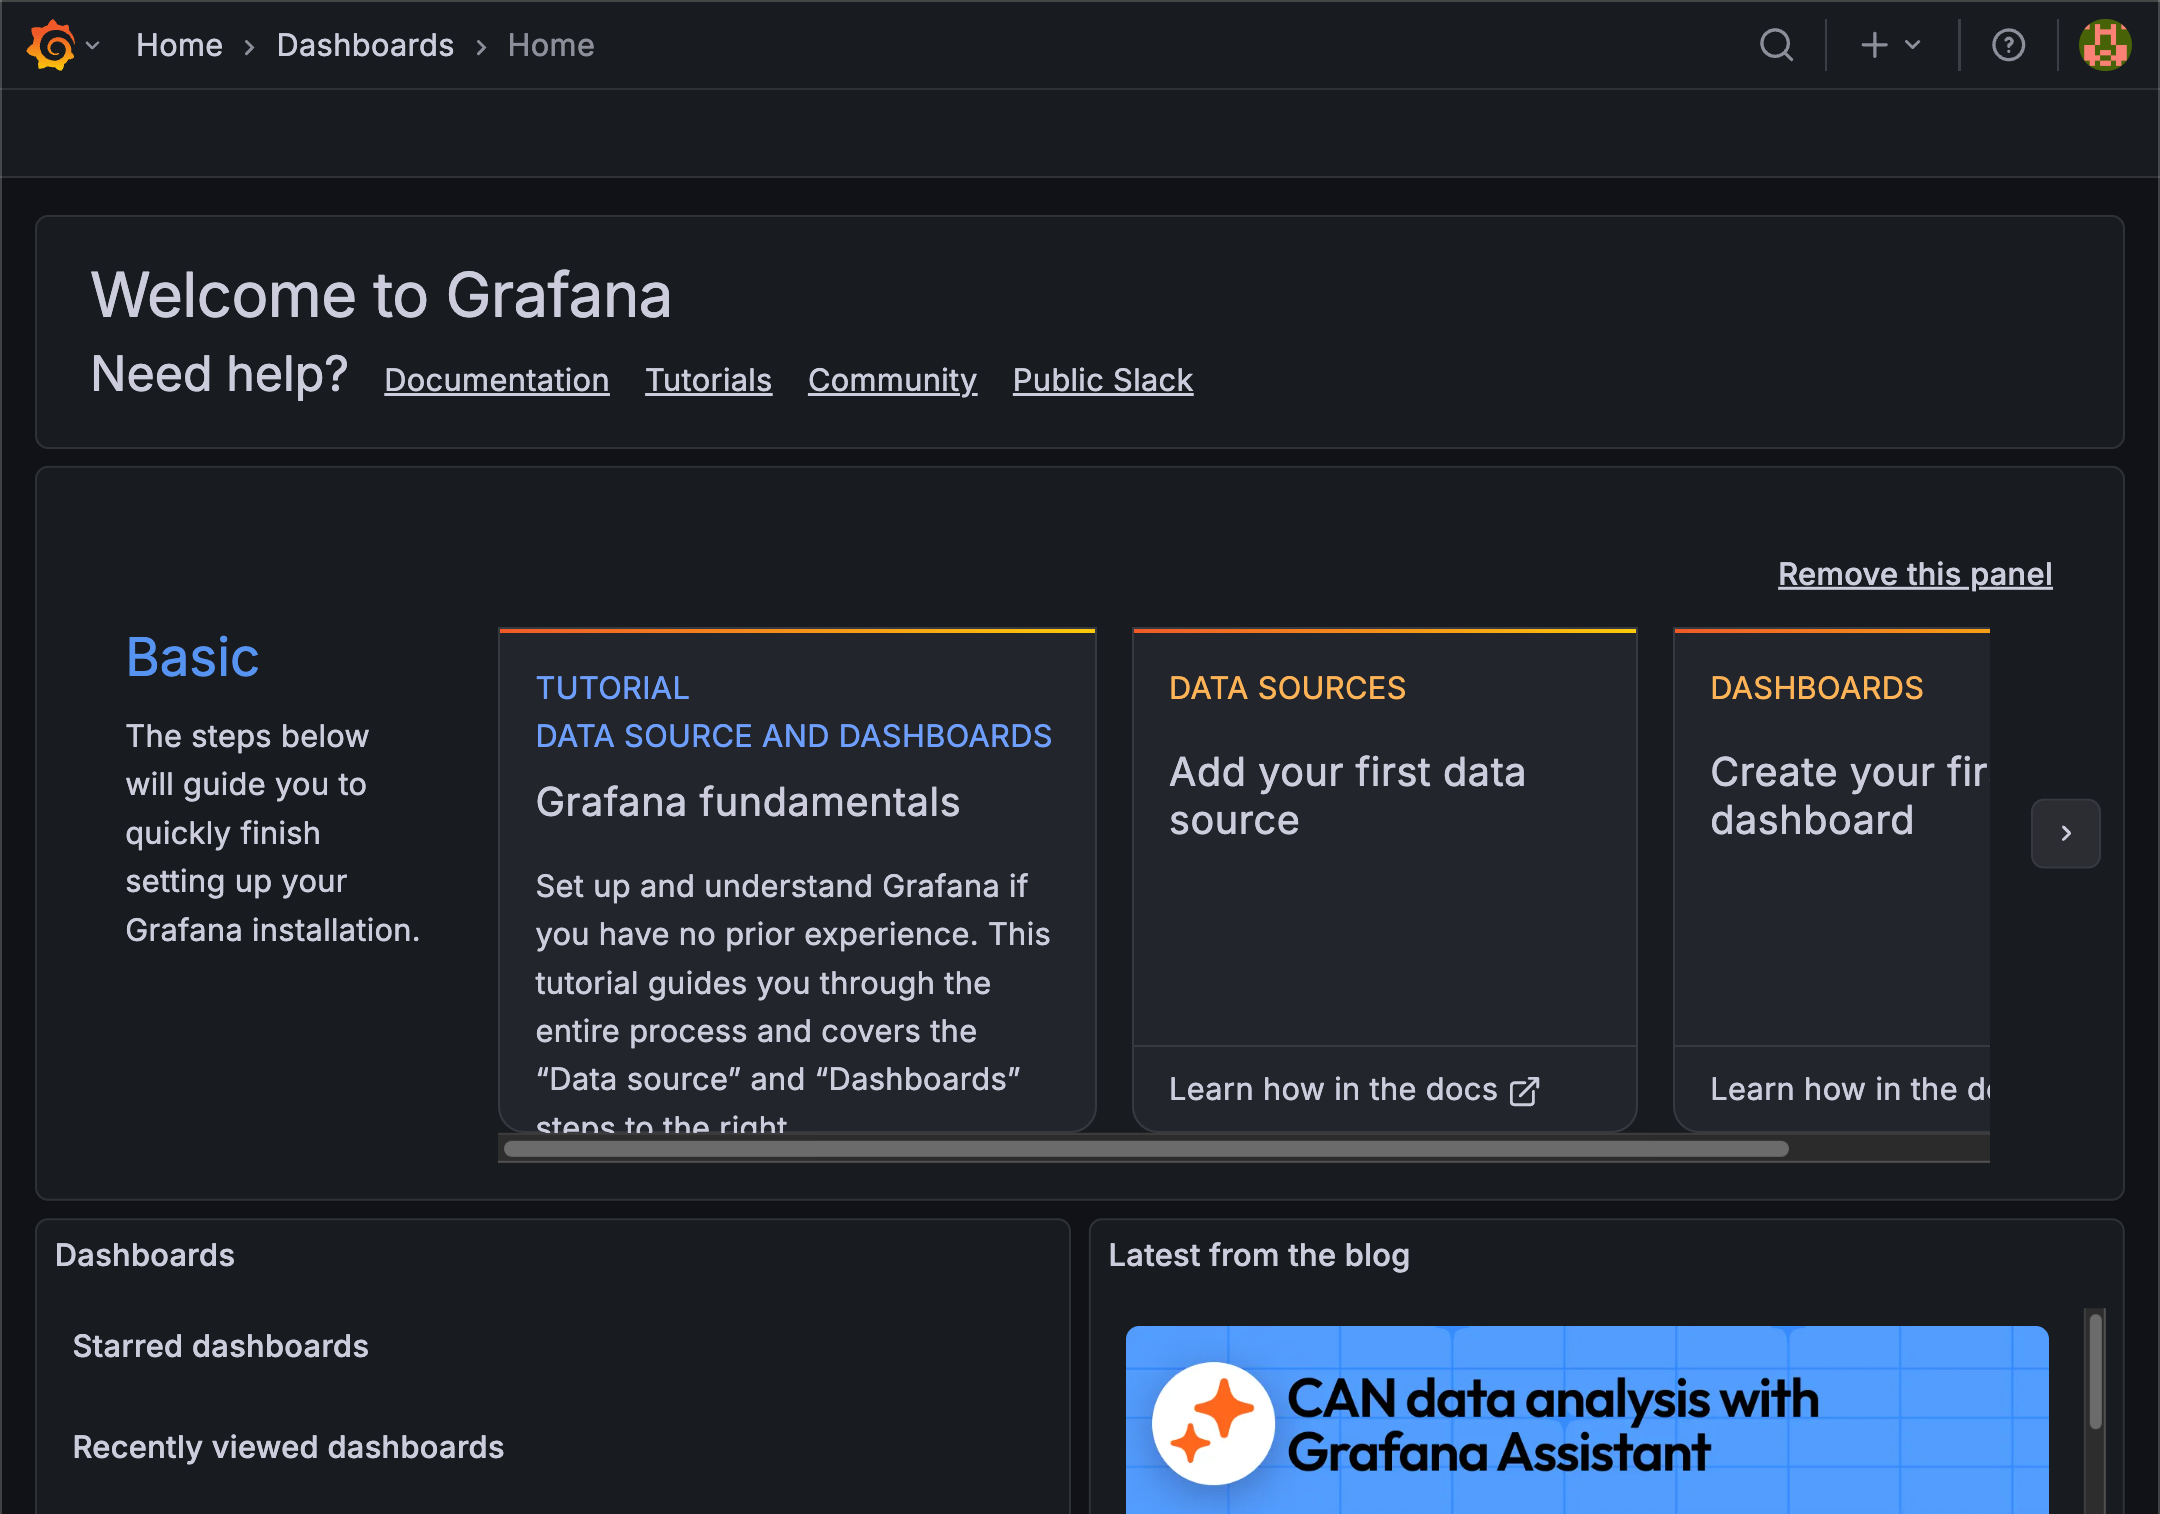
Grafanaにログインしたら、Prometheusをデータソースとして追加します。
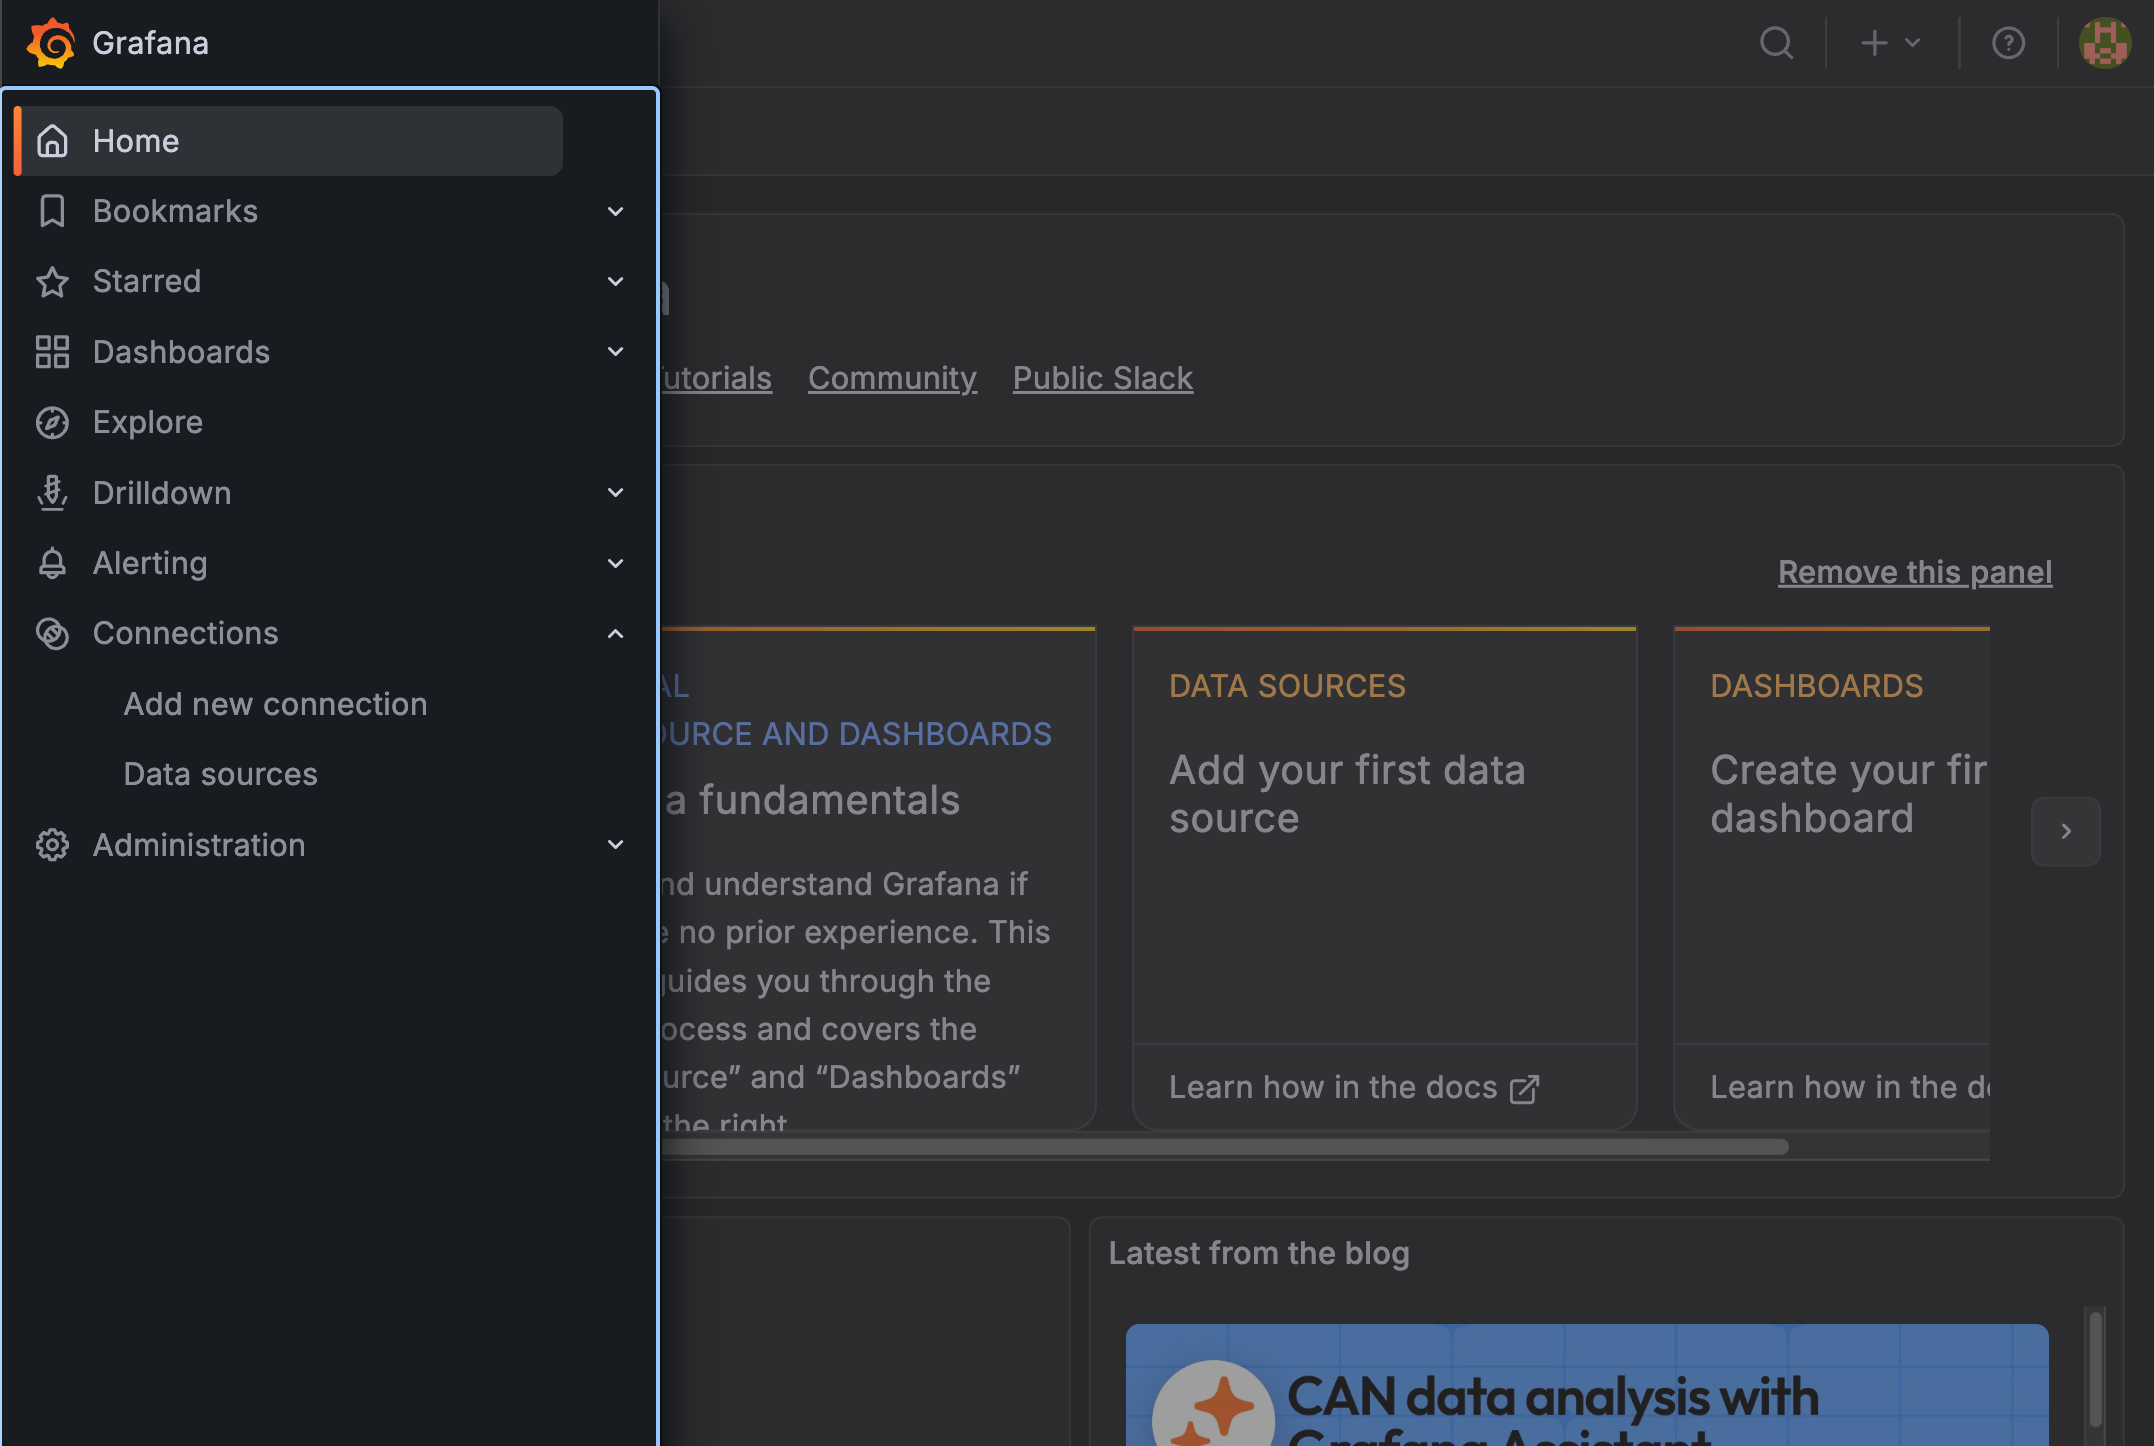
左メニューの「Connections」から「Add new connection」を選択
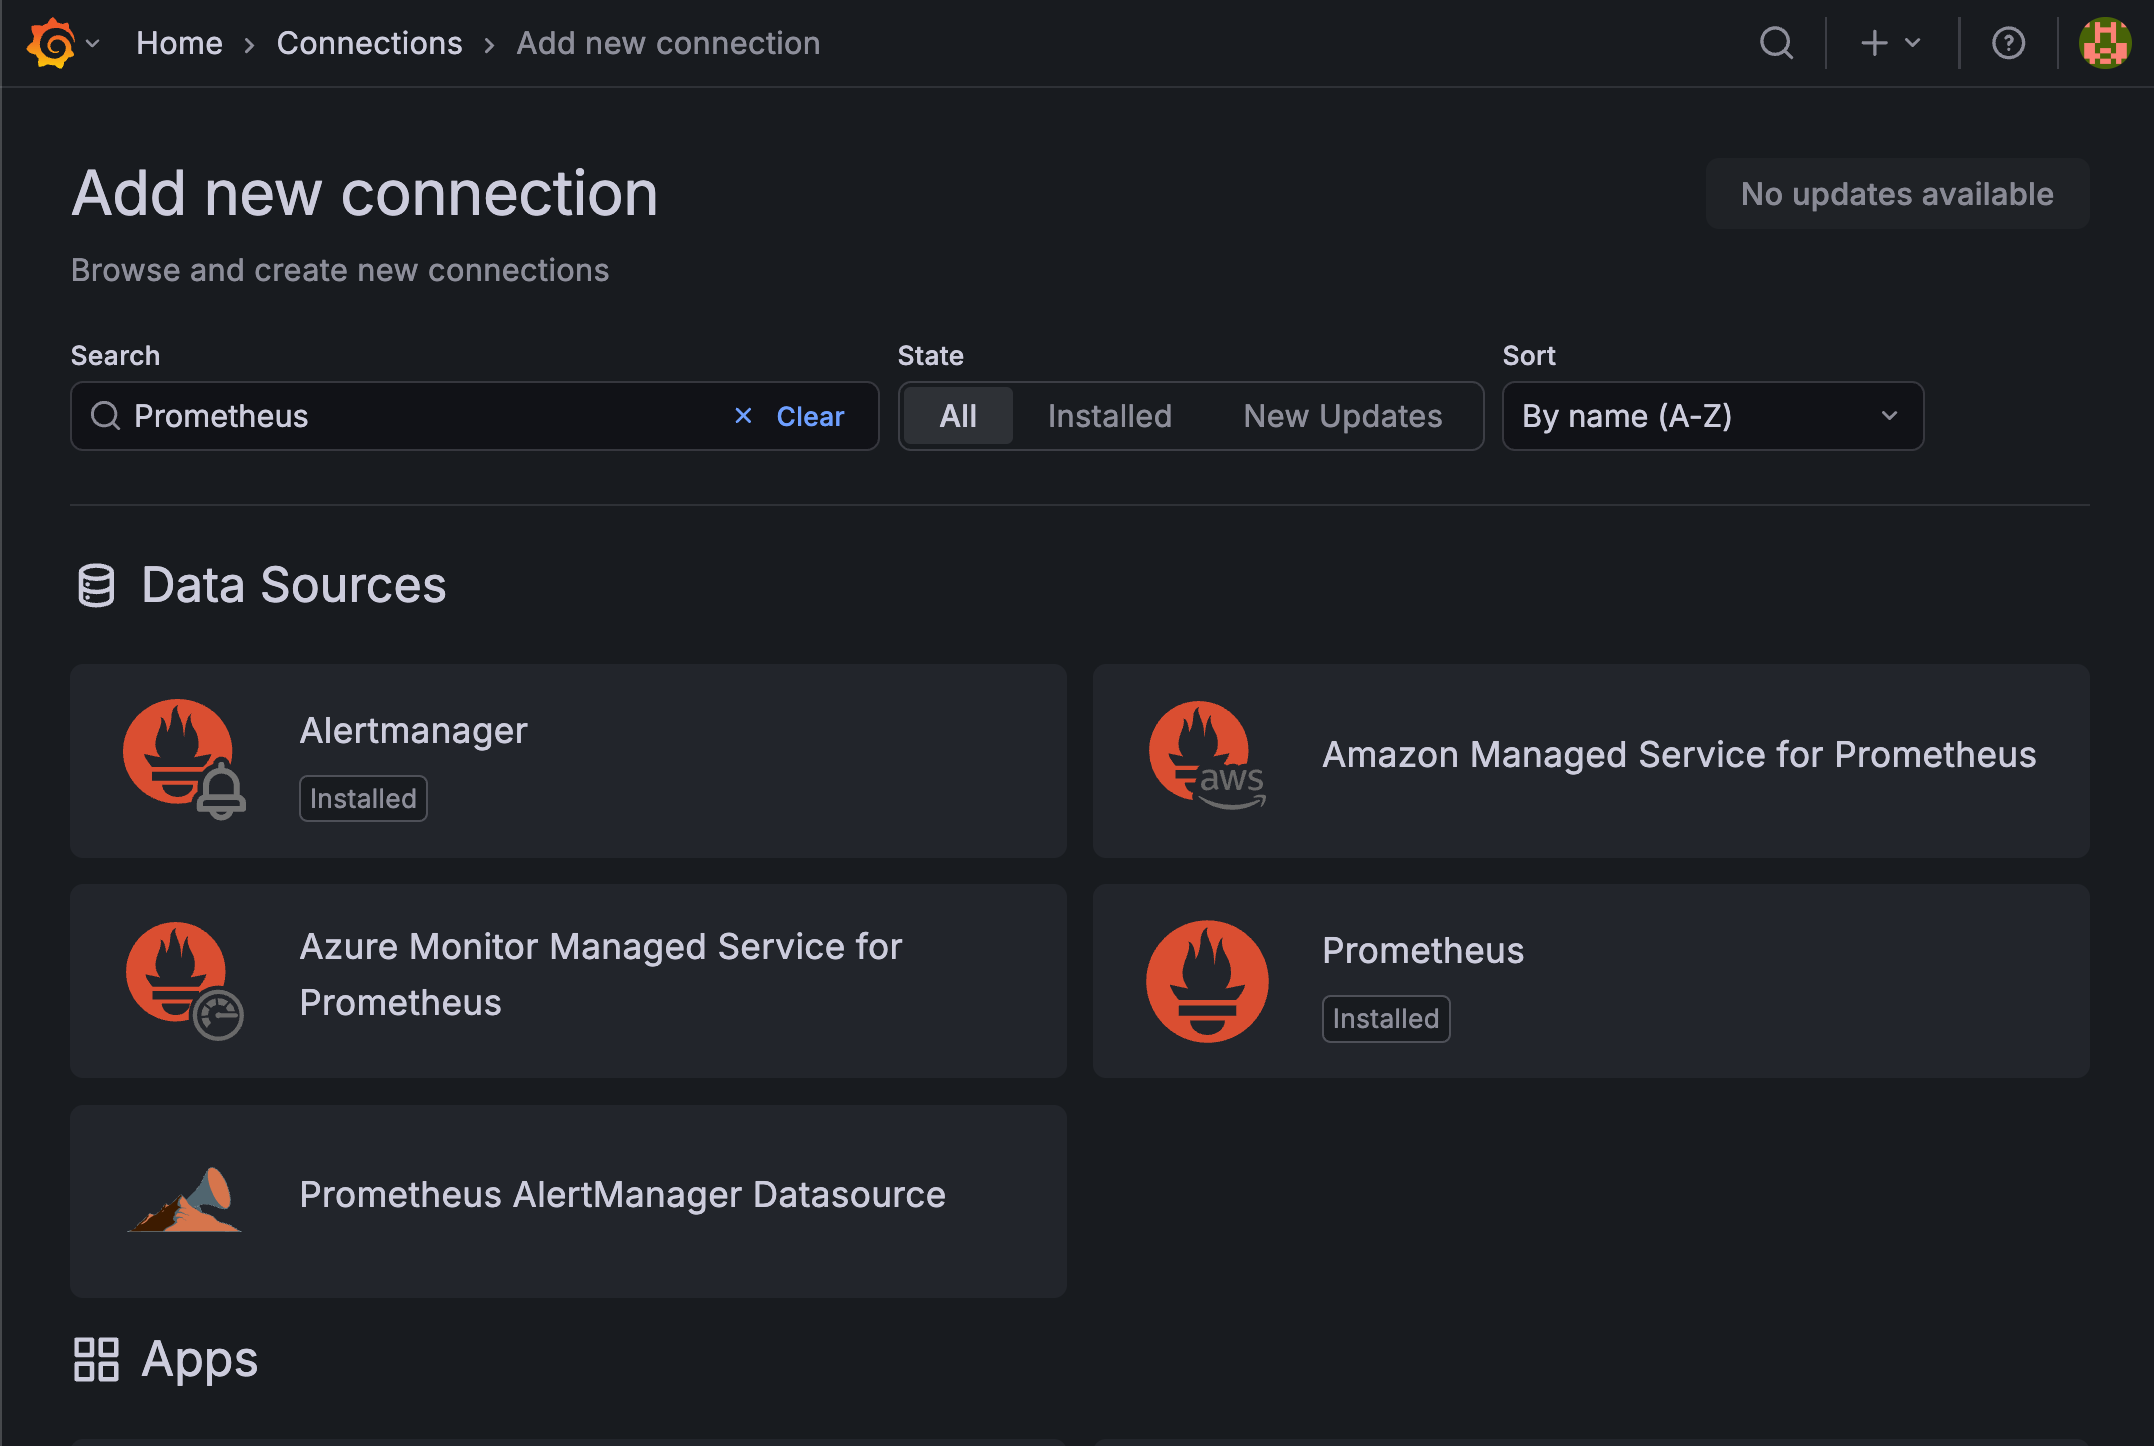
「Prometheus」を選択して、「Add New data source」を押下
以下の設定を行い、「Save & test」を押下
- Name:
Prometheus(デフォルトのまま) - URL:
http://prometheus-server
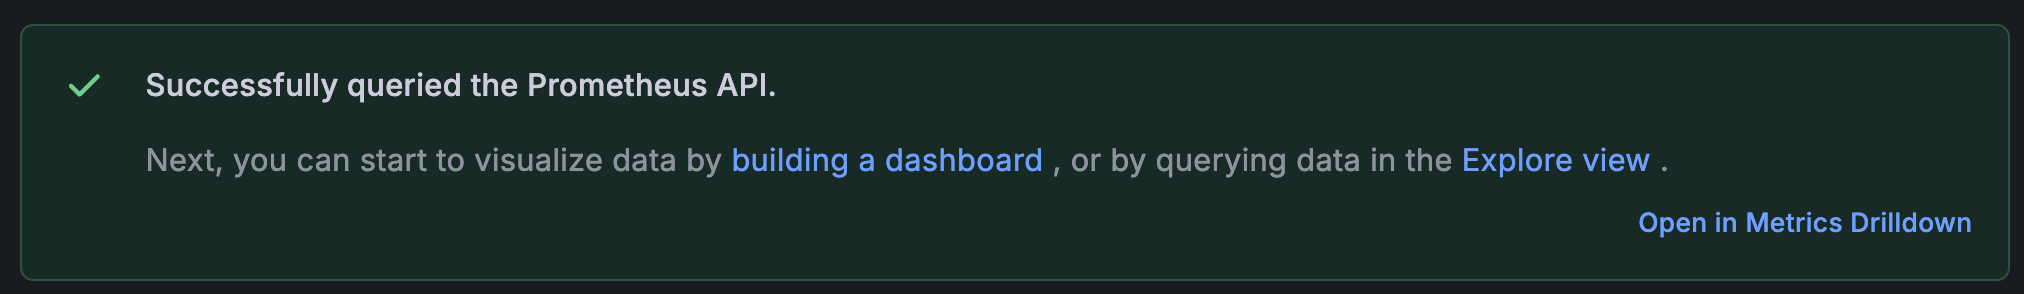
上記が表示されれば問題ありません
URLにhttp://prometheus-serverを指定しているのは、Kubernetesクラスタ内のServiceを直接名前で参照できるためです。
ダッシュボードでメトリクスを確認
Grafanaには公式のダッシュボードテンプレートが用意されているので、それをインポートして使ってみます。
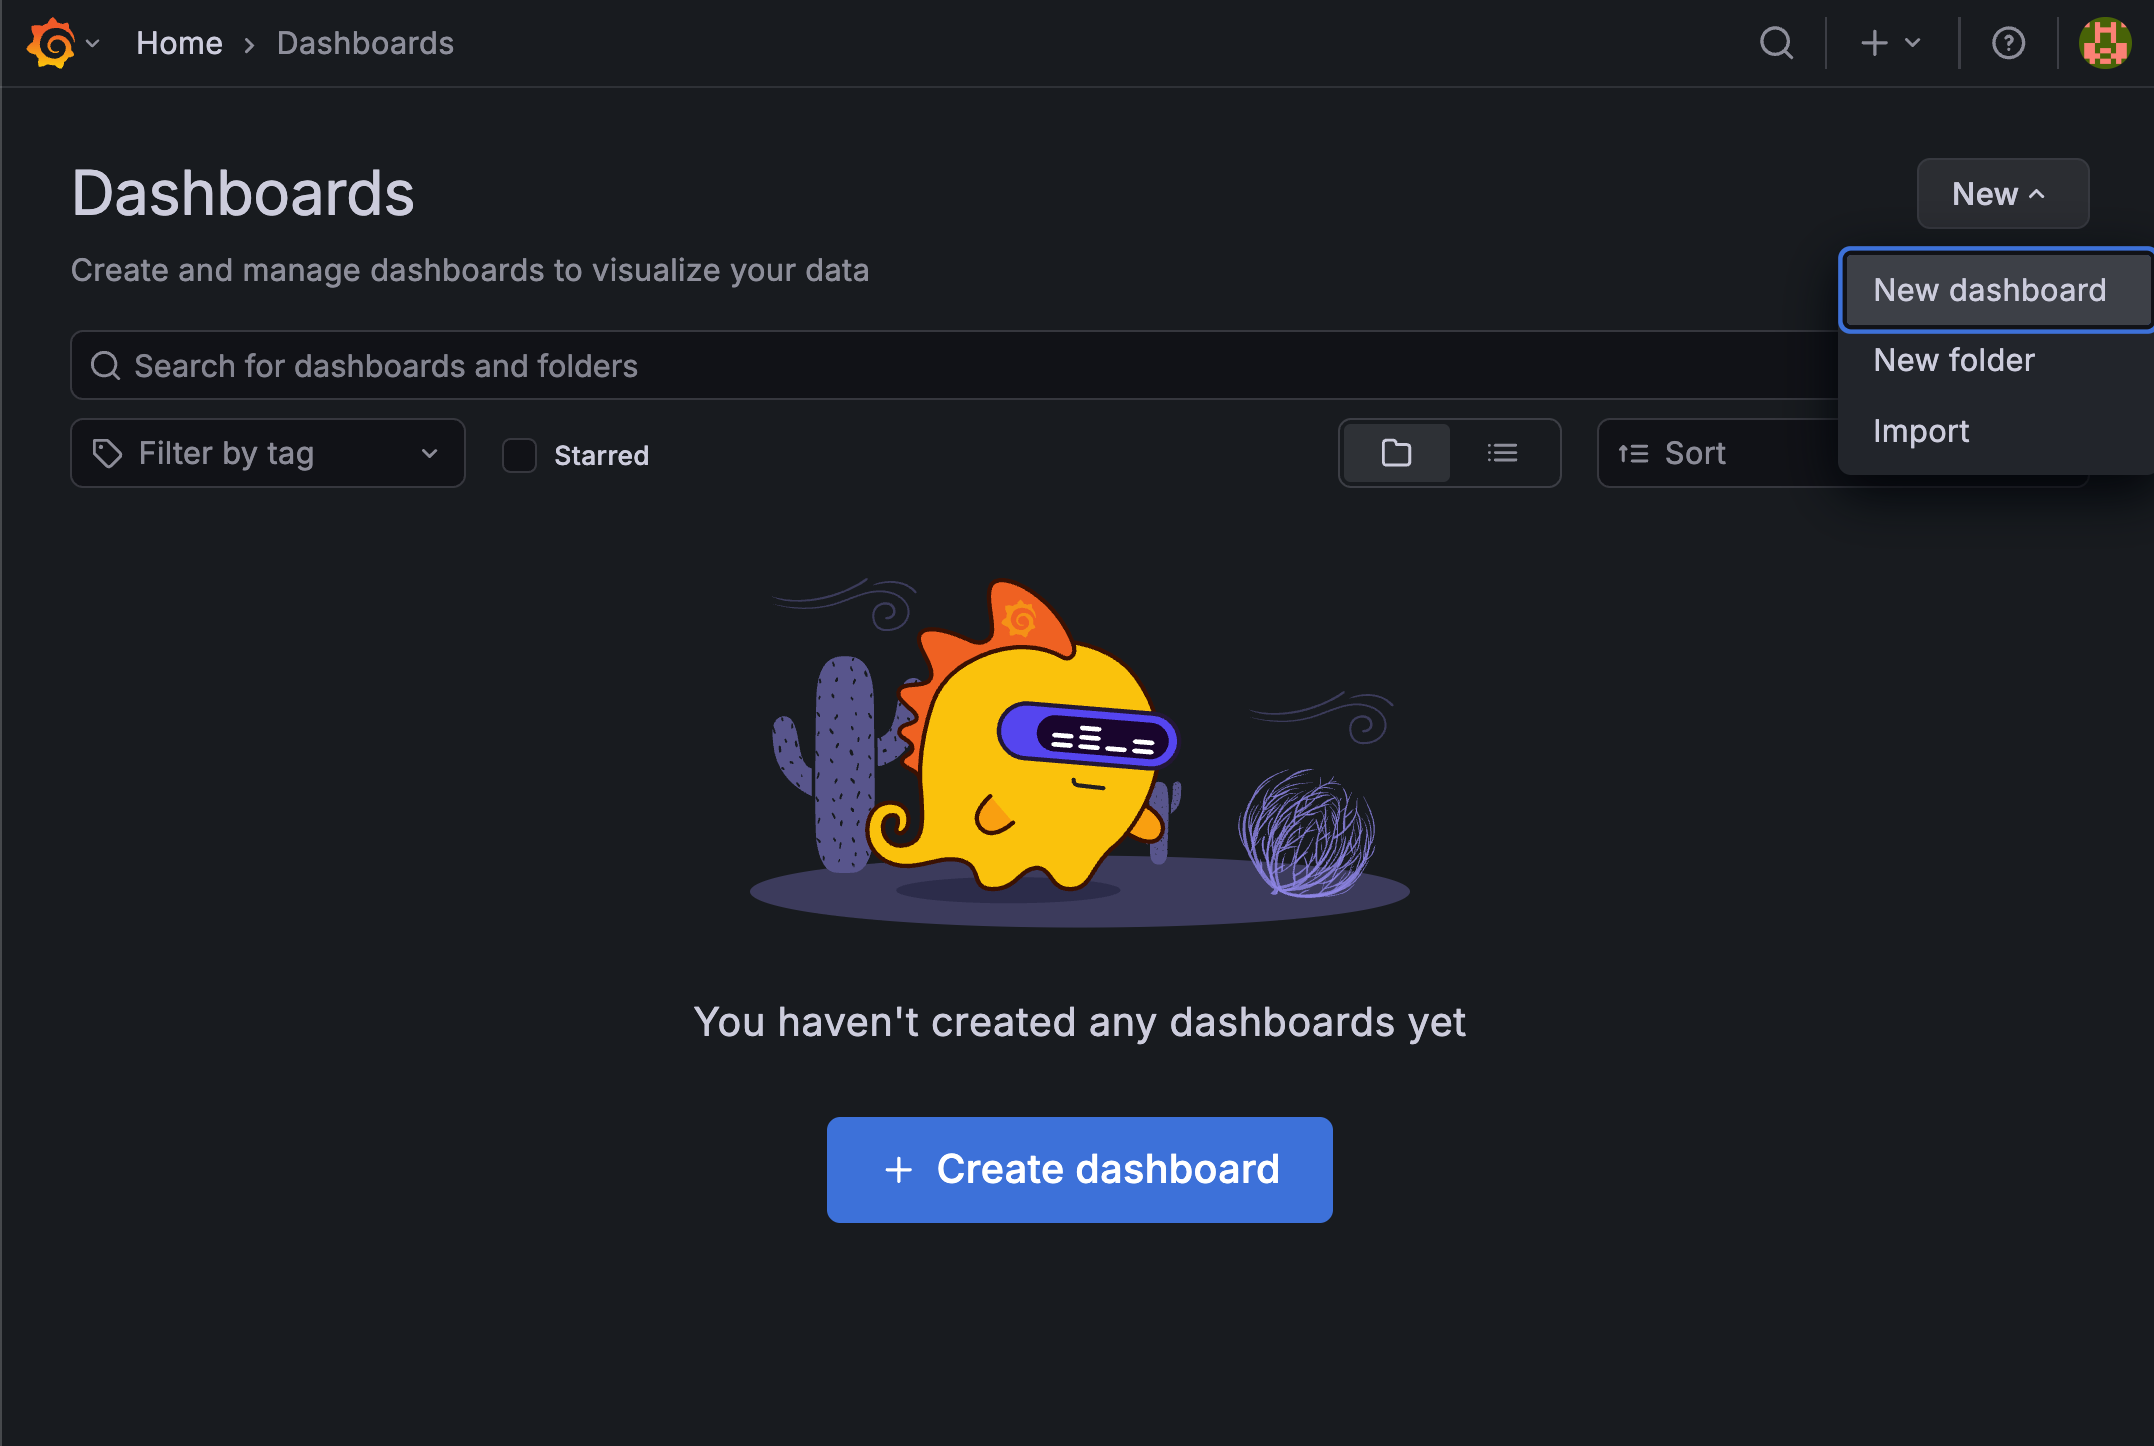
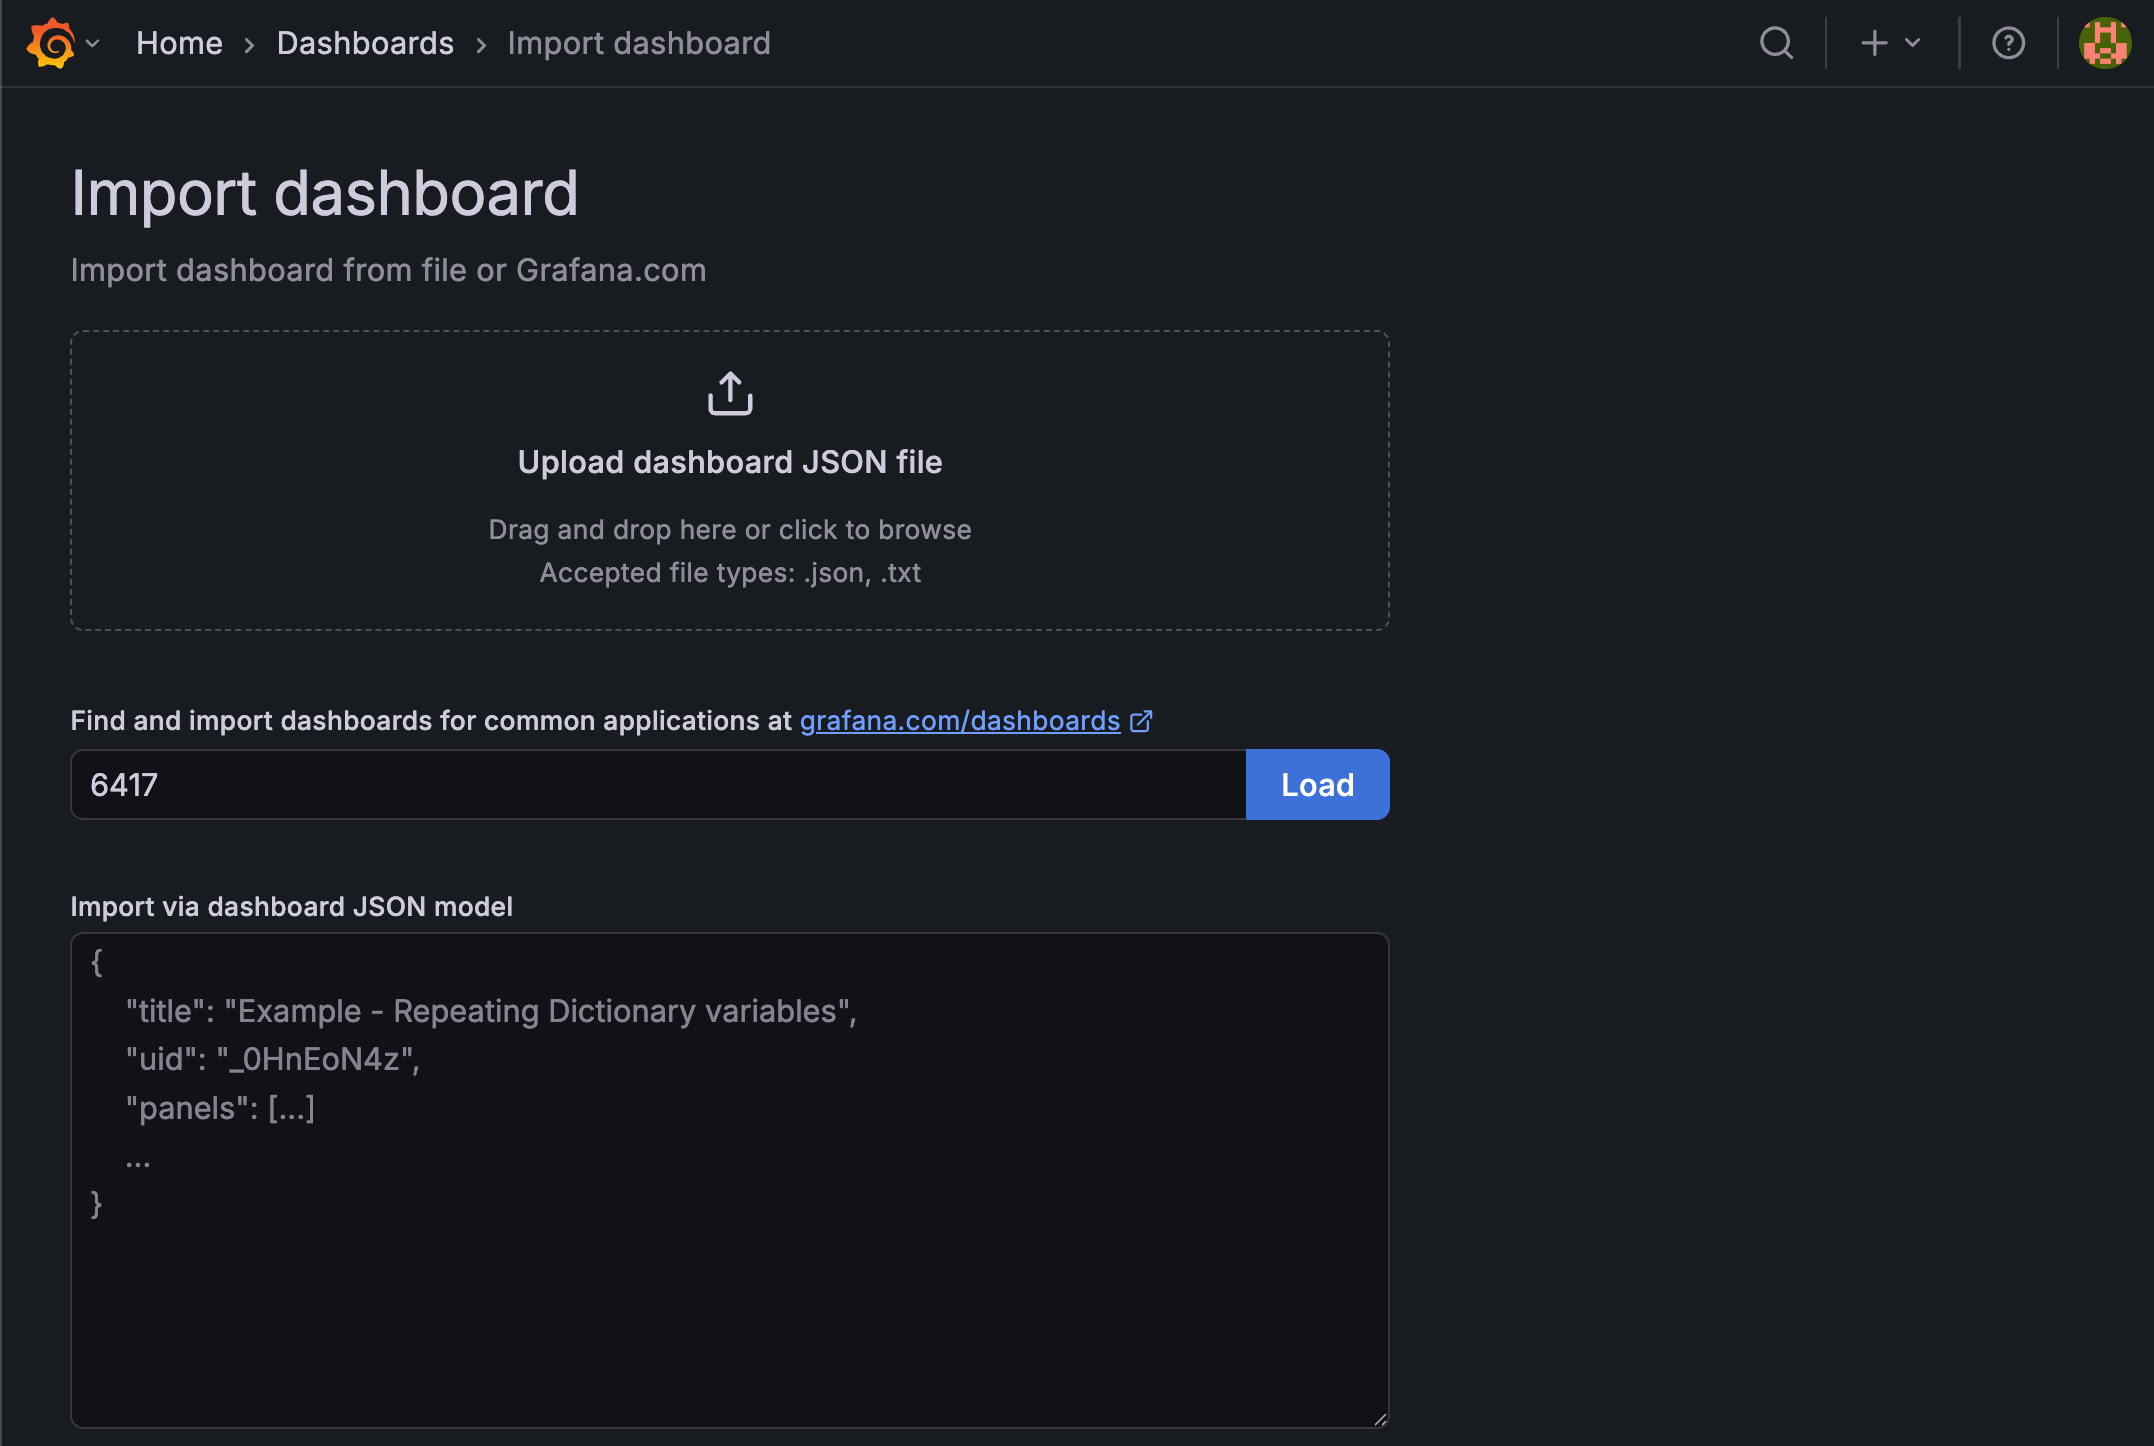
左メニューの「Dashboards」を選択して、右上の「New」→「Import」を押下
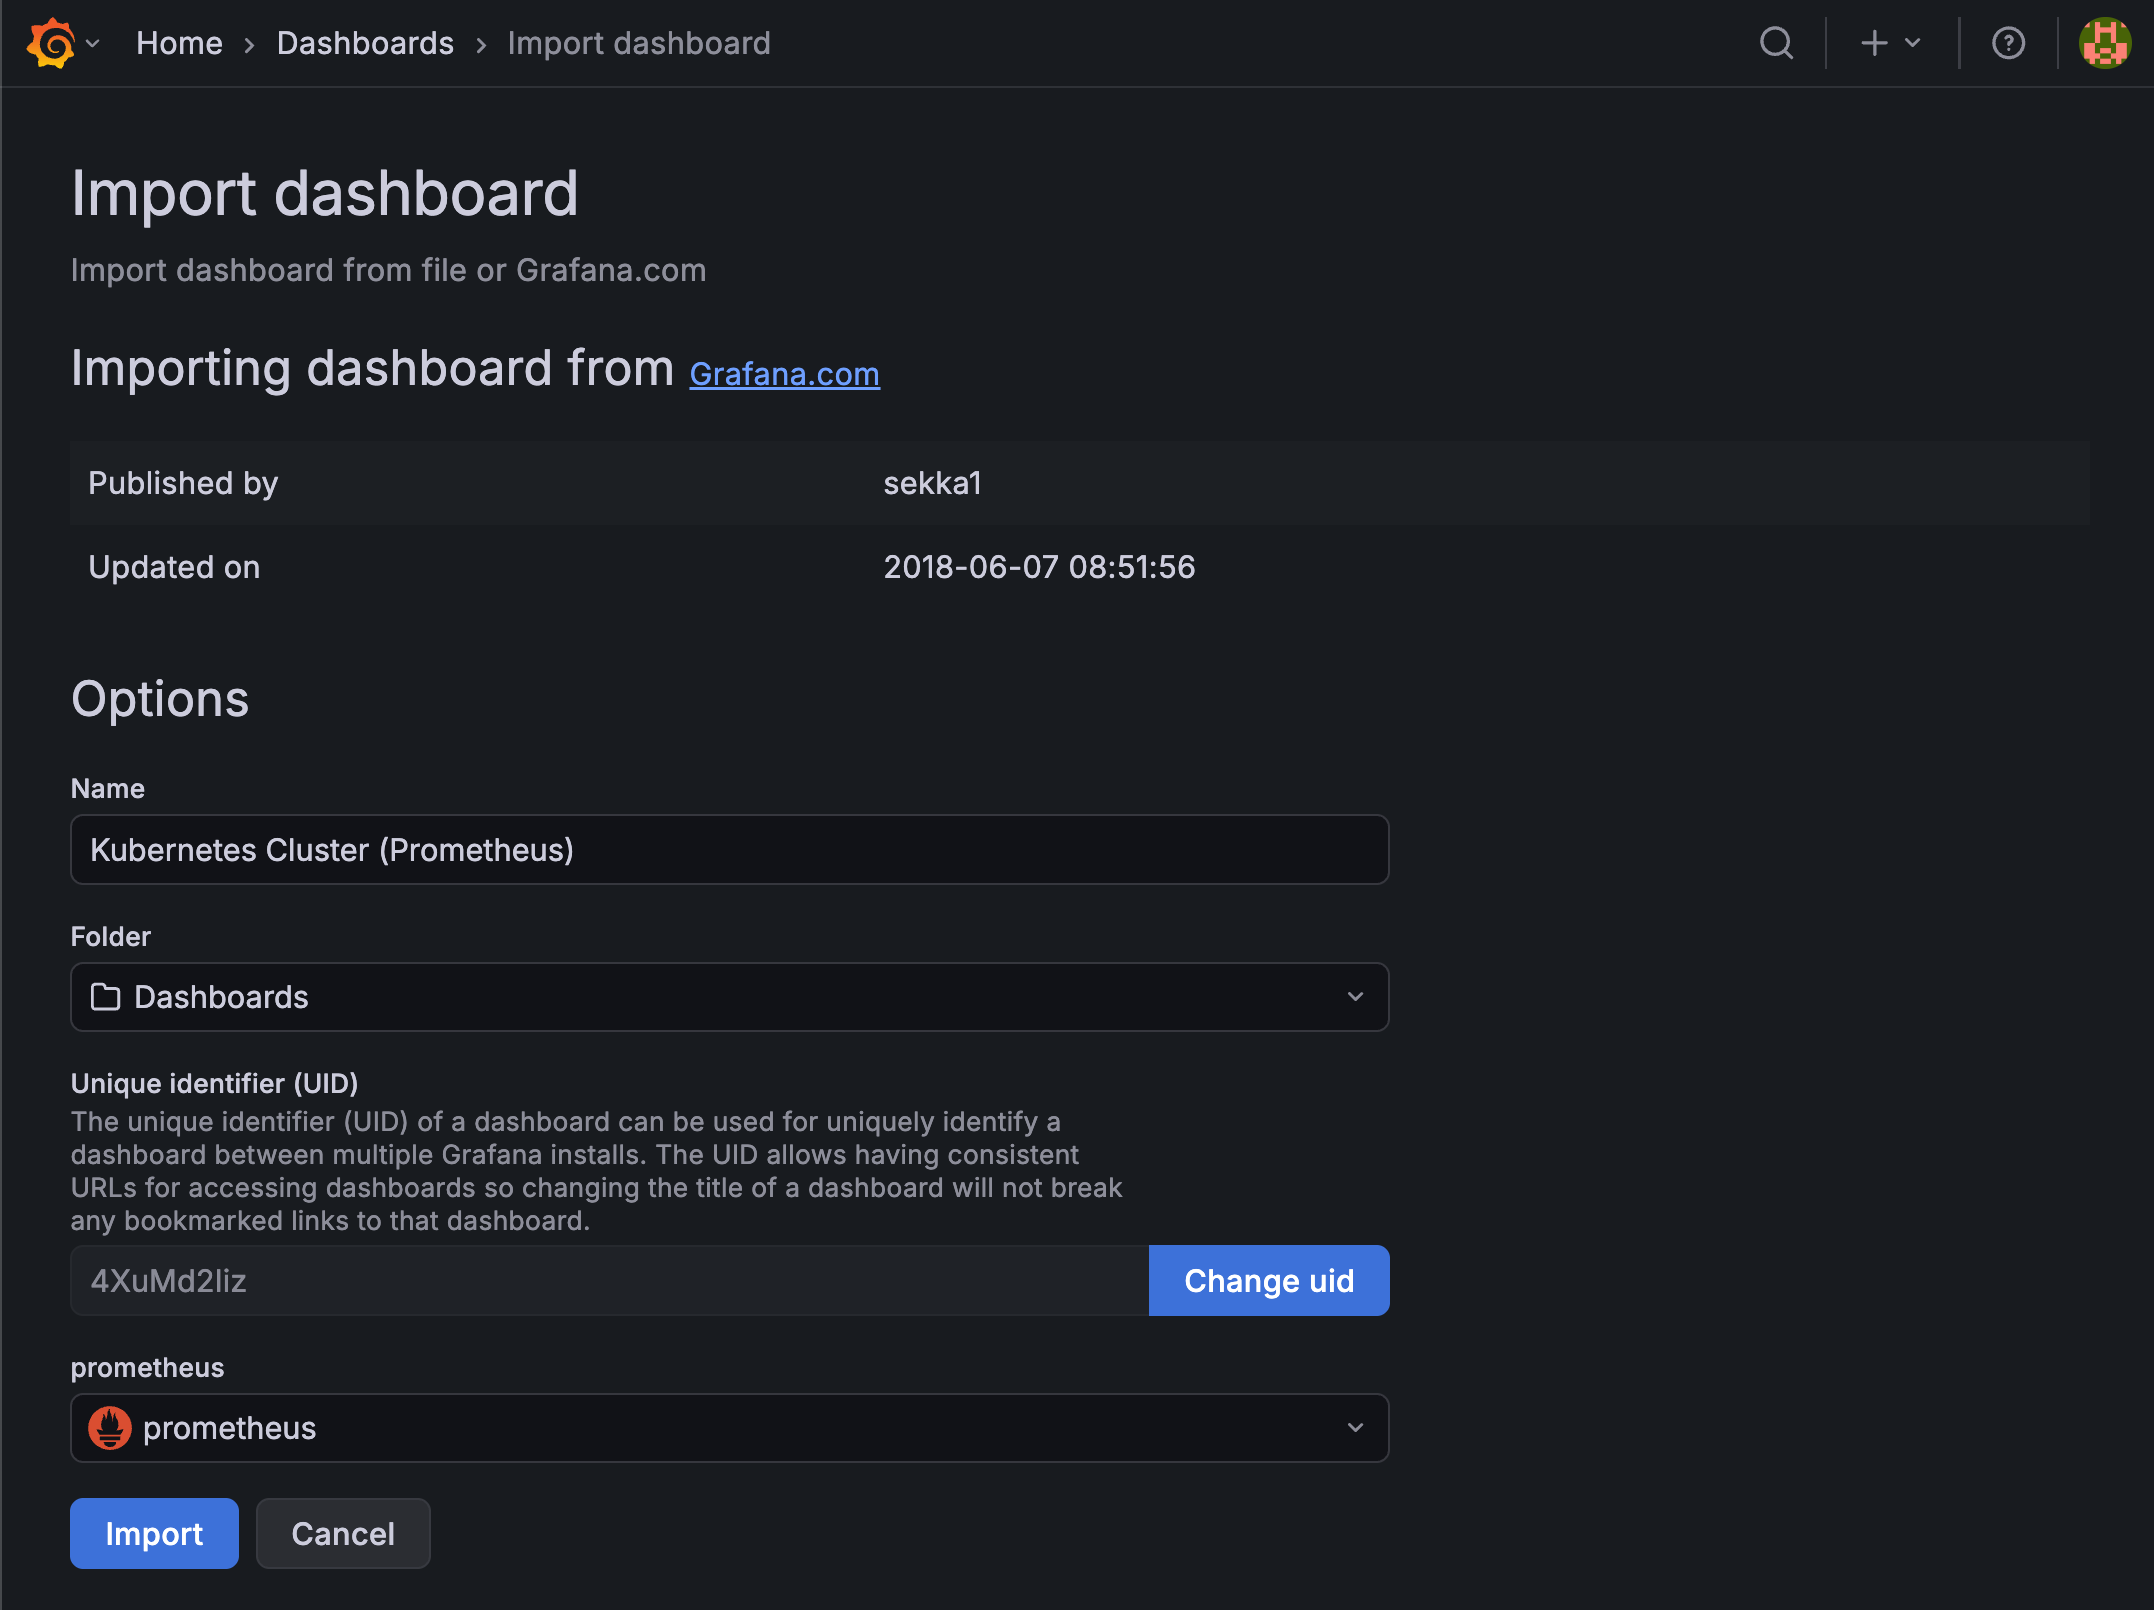
「Find and import dashboards」の欄に6417と入力して「Load」をクリック
「Import」ボタンを押下
これでダッシュボードが表示され、クラスタ全体のメトリクスが確認できるようになります。
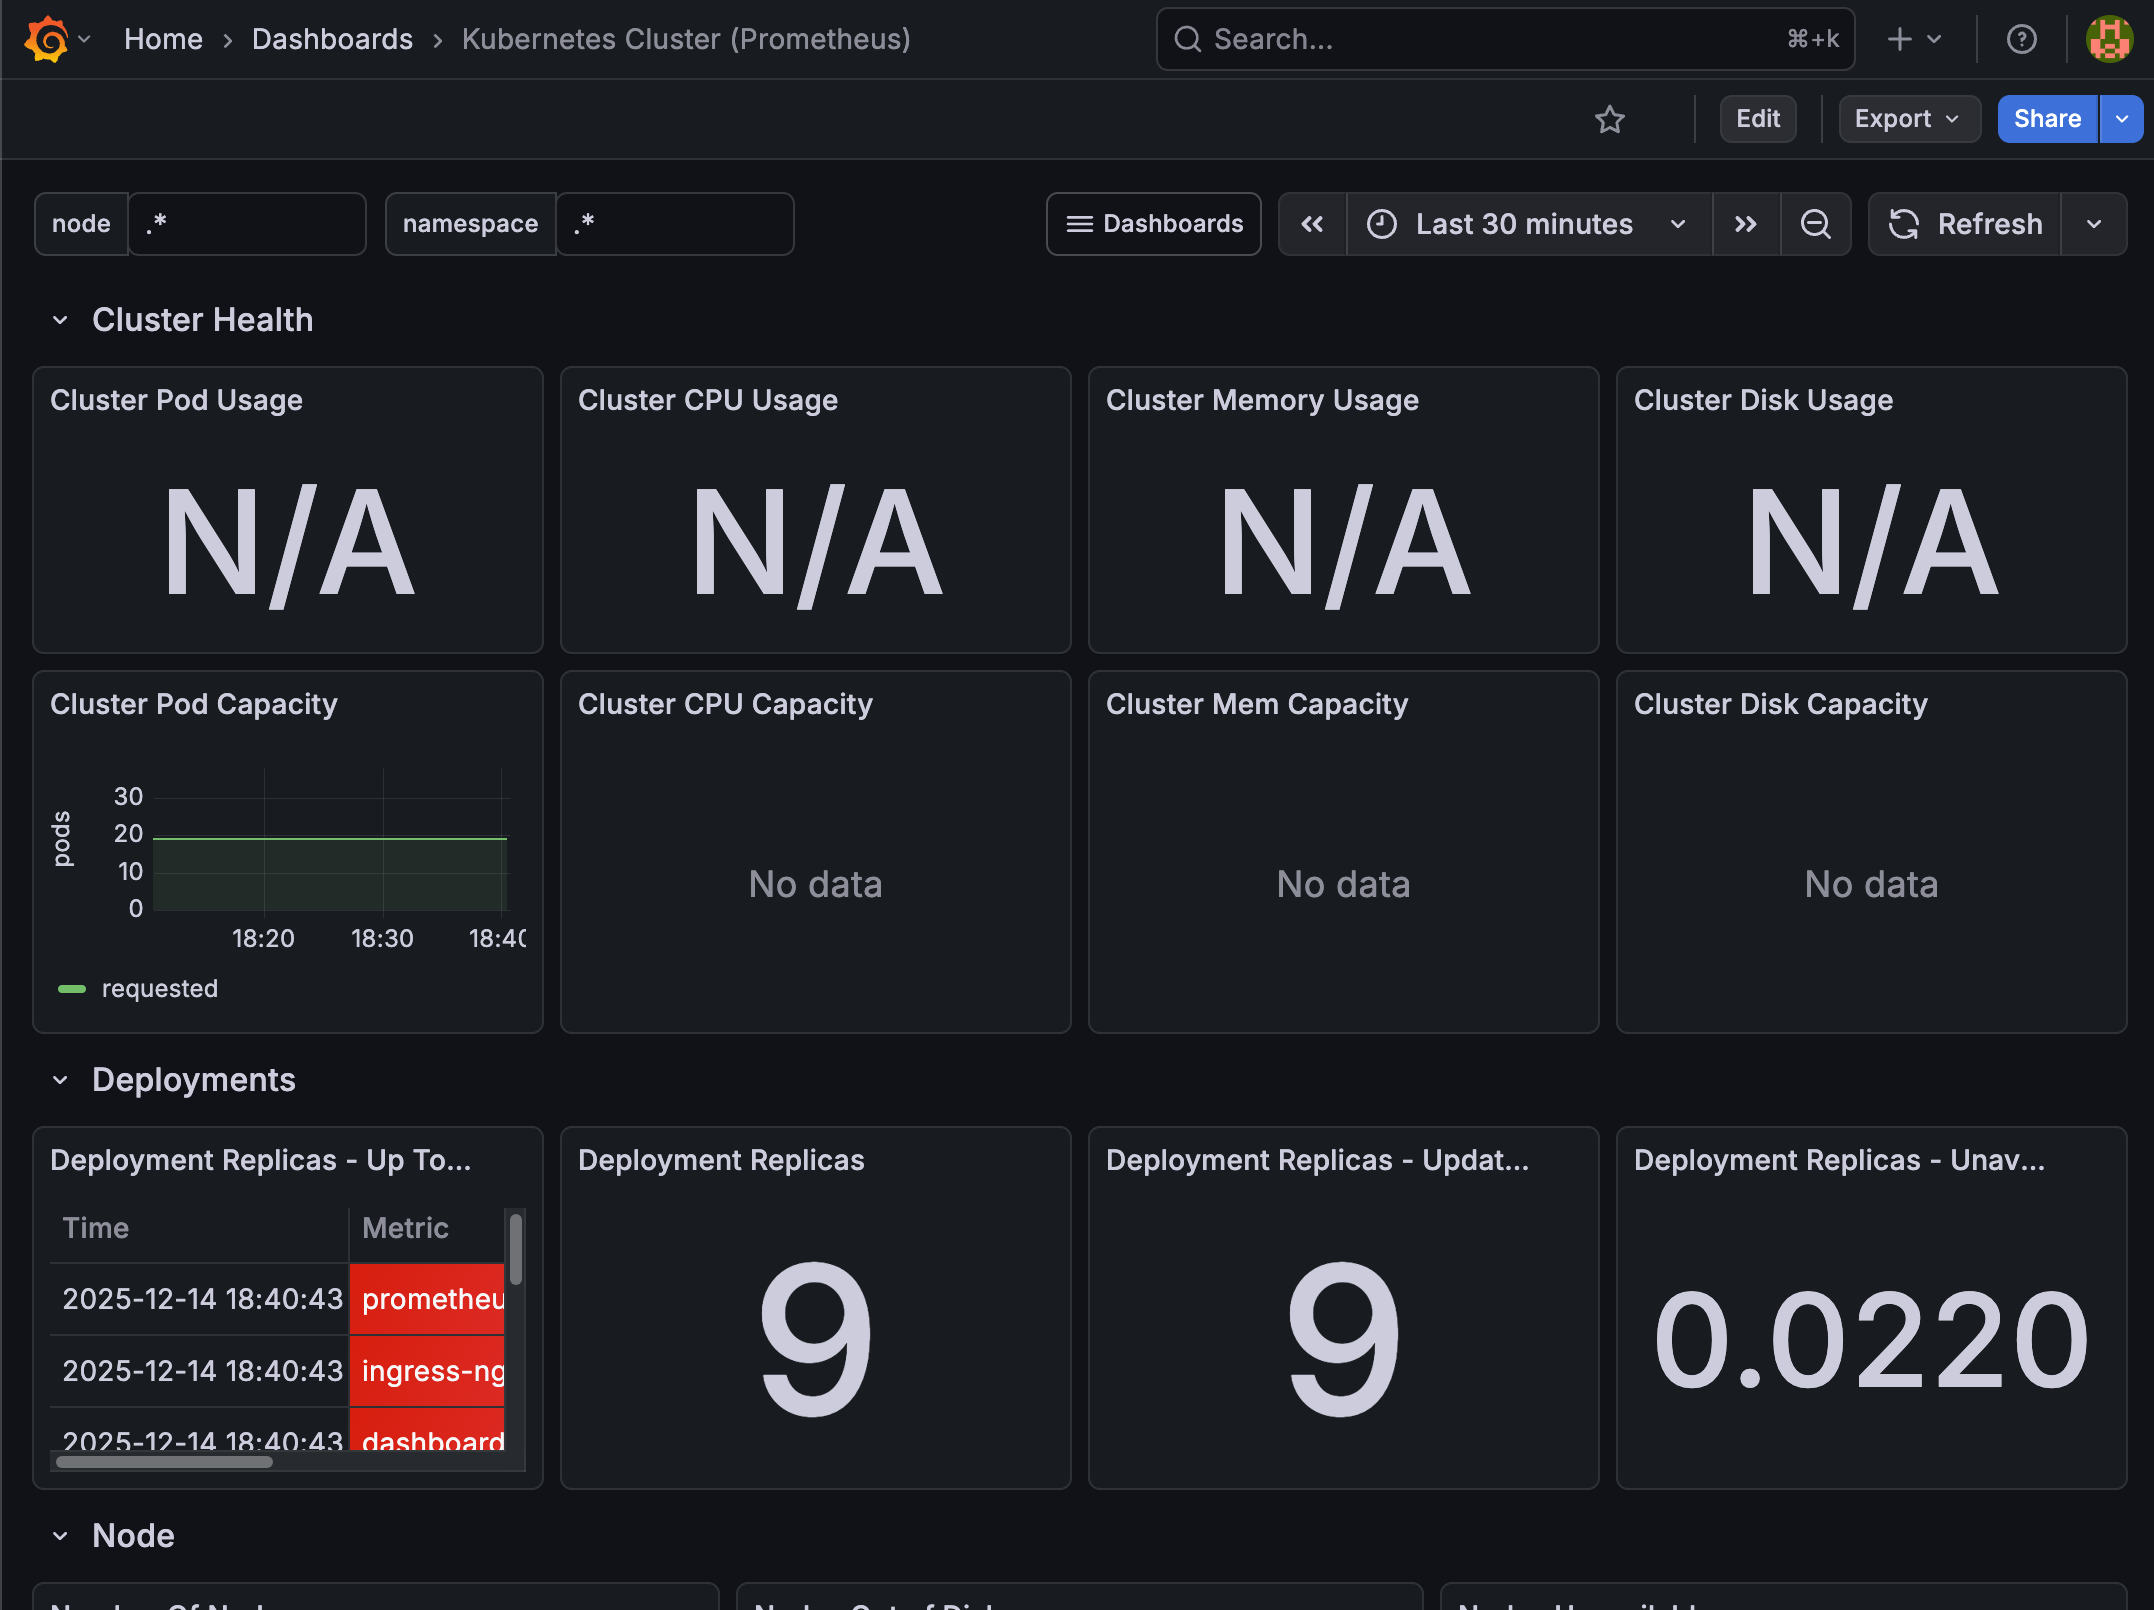
ダッシュボードで確認できる情報
- Cluster CPU Usage: クラスタ全体のCPU使用率
- Cluster Memory Usage: クラスタ全体のメモリ使用率
- Cluster Disk Usage: ディスク使用率
- Pods Running: 実行中のPod数
その他の便利なダッシュボード
Grafanaには他にも様々なダッシュボードテンプレートが用意されています。
| Dashboard ID | ダッシュボード名 | 用途 |
|---|---|---|
| 6417 | Kubernetes Cluster (Prometheus) | クラスタ全体の監視 |
| 315 | Kubernetes cluster monitoring | Node単位の詳細監視 |
| 747 | Kubernetes Pod Metrics | Deployment単位の監視 |
気になるダッシュボードがあれば、同じ手順でインポートしてみてください。
Grafana公式サイトでダッシュボードを閲覧できますのでぜひご覧ください!
クリーンアップ
実行確認は終わりですので、今回作成したリソースを削除しておきます。
helm uninstall prometheus

# release "prometheus" uninstalled

helm uninstall grafana

# release "grafana" uninstalled
まとめと次回予告
Prometheusはメトリクスの収集と保存を担当し、Grafanaはそのメトリクスを可視化してダッシュボードとして表示してくれます。
前回触れたHelmでPrometheusとGrafanaを簡単にデプロイできますし、Grafanaの公式ダッシュボードテンプレートを使えば即座に監視を開始することができます。
実際の運用ではこれらのダッシュボードを見ながらリソース不足やパフォーマンスの問題を検知して対処していくことになりますので、ぜひ活用していきたいですね!
次回は、Horizontal Pod Autoscaler (HPA)を使って負荷に応じて自動的にスケールする設定について学習していきたいと思います。
それでは、また次回!