メモ
OCIのモニタリングを確認したい
特にNWで制限かかってるときとかどんなグラフになるのか知りたい
とりあえずNWはないが、他のリソースは下記を参考にやってみる
https://4thsight.xyz/15051
対象はwindows 2019 server
E4.flex
1 ocpu
8 GB memory
47 GB boot volume
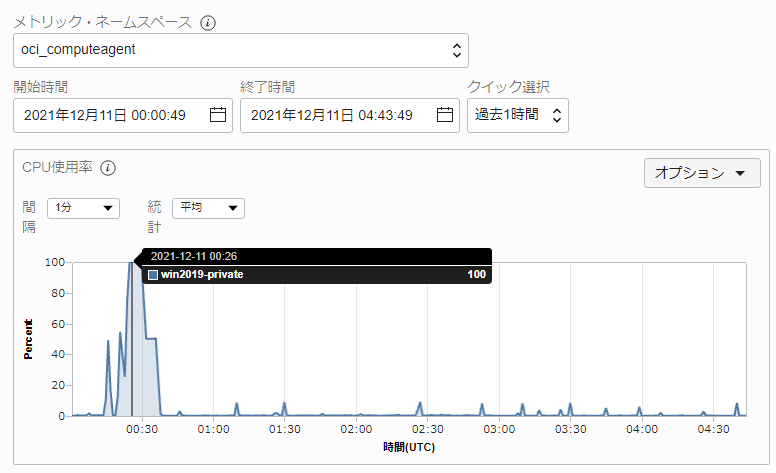
cpu
平均
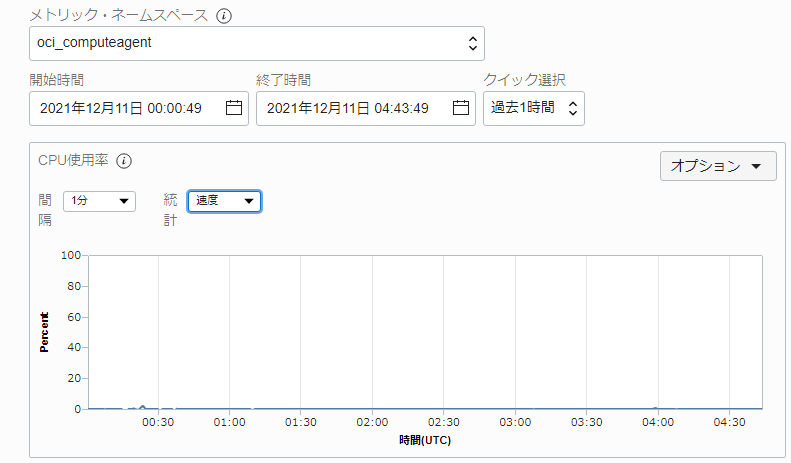
速度は意味わからん
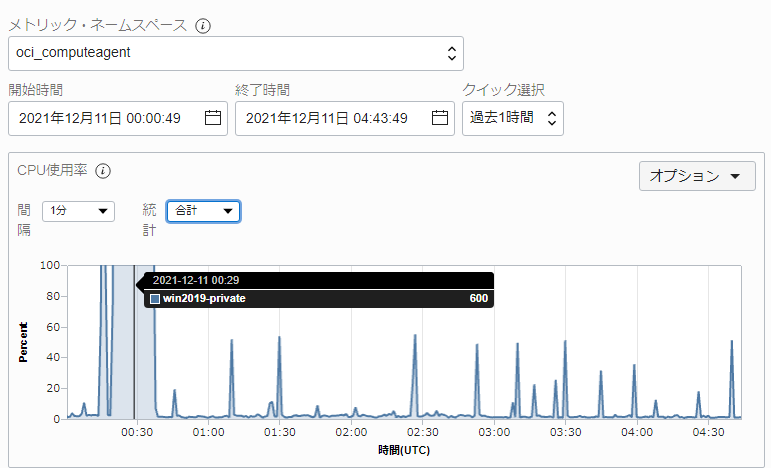
合計も600とかなので不適切
数もダメ
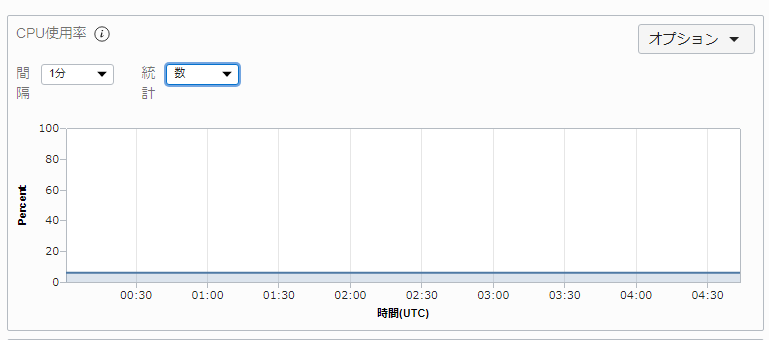
あとはまぁ使えそうか
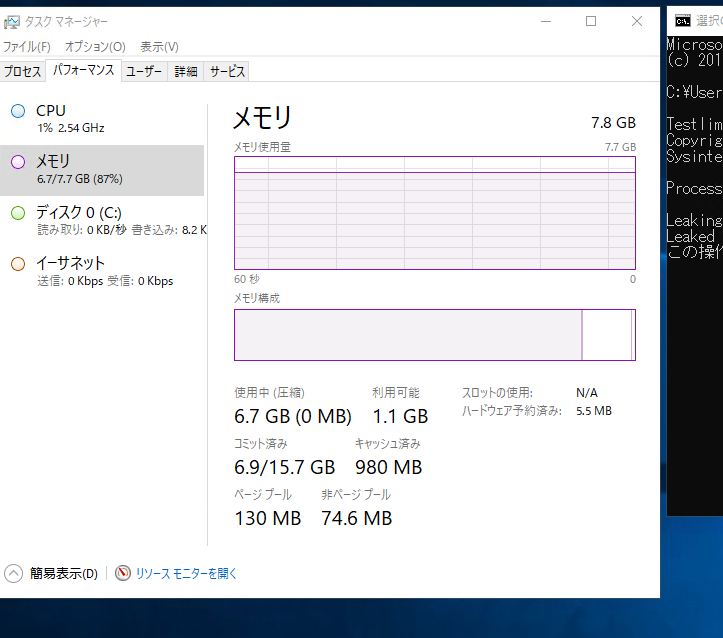
memory
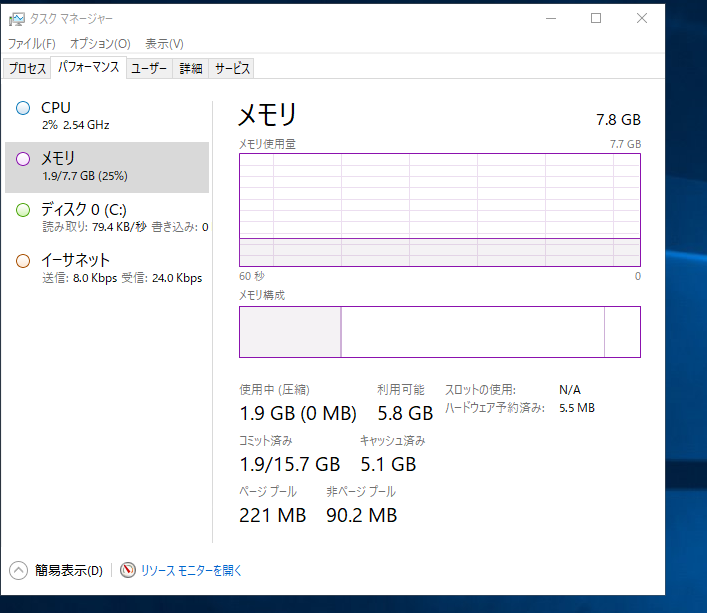
利用可能は5.8GB
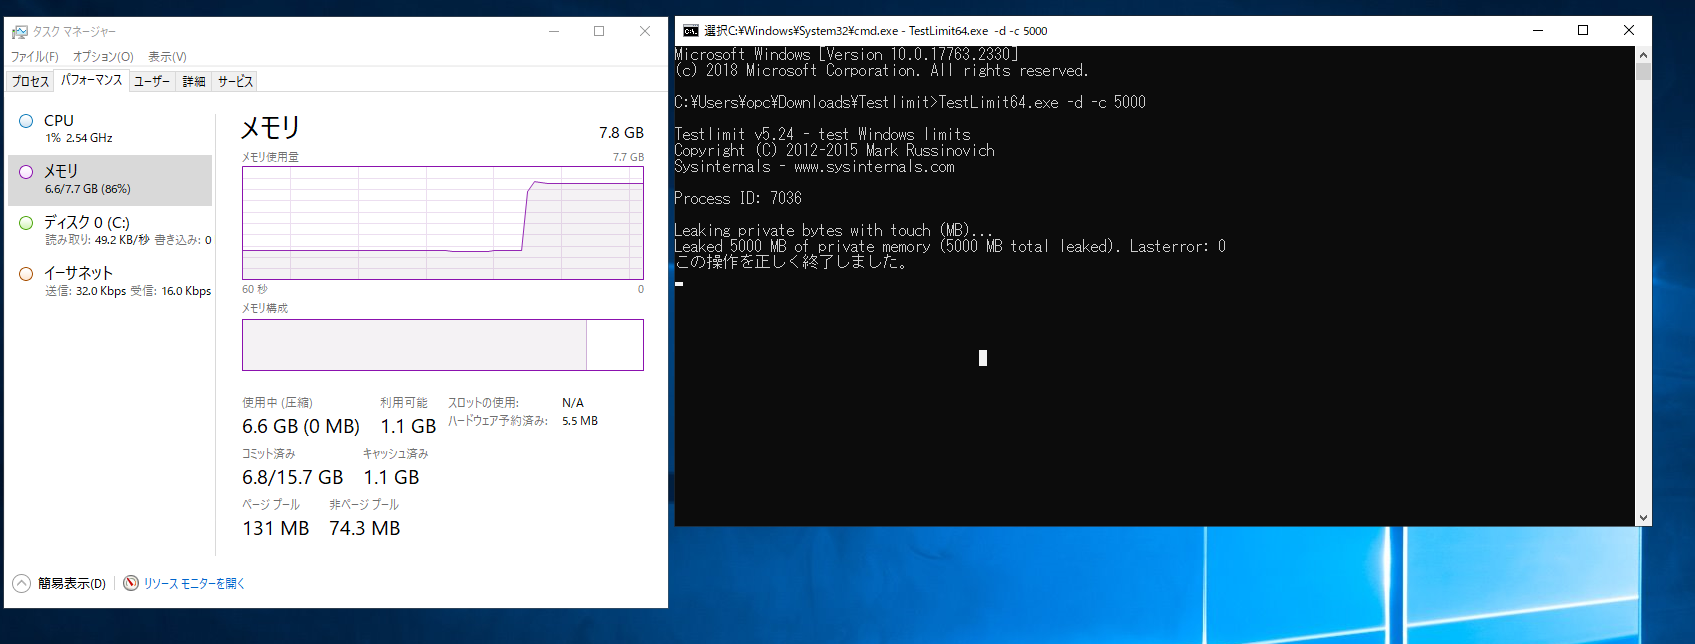
C:\Users\opc\Downloads\Testlimit>TestLimit64.exe -d -c 5000
5GB確保してみる
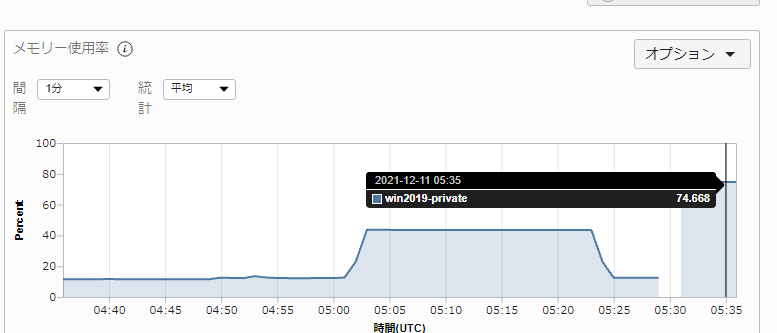
モニターでみると平均だと50%ぐらい
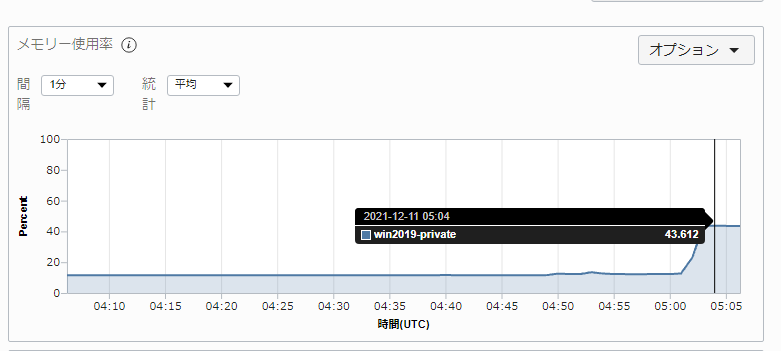
最大でも50%弱
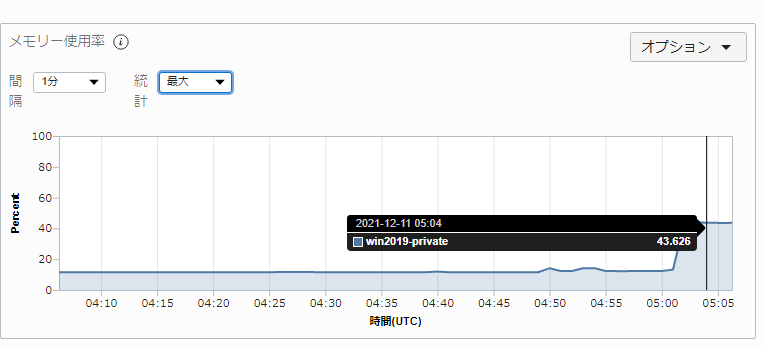
最小も変わらない
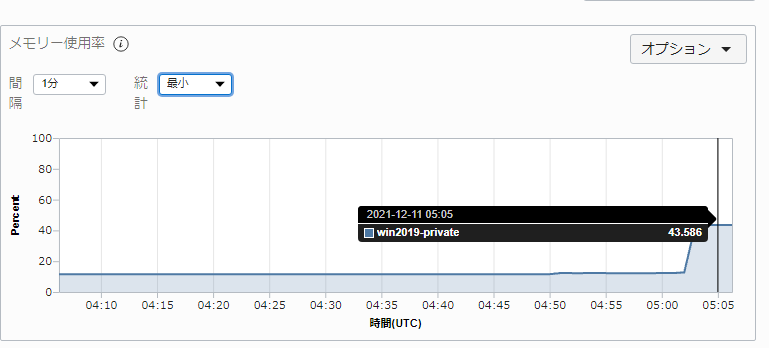
OC上では87%ぐらい使ってるのに
試しに10GBでやってみる
リモートデスクトップが落ちた。。
再度入れるようになったので入った
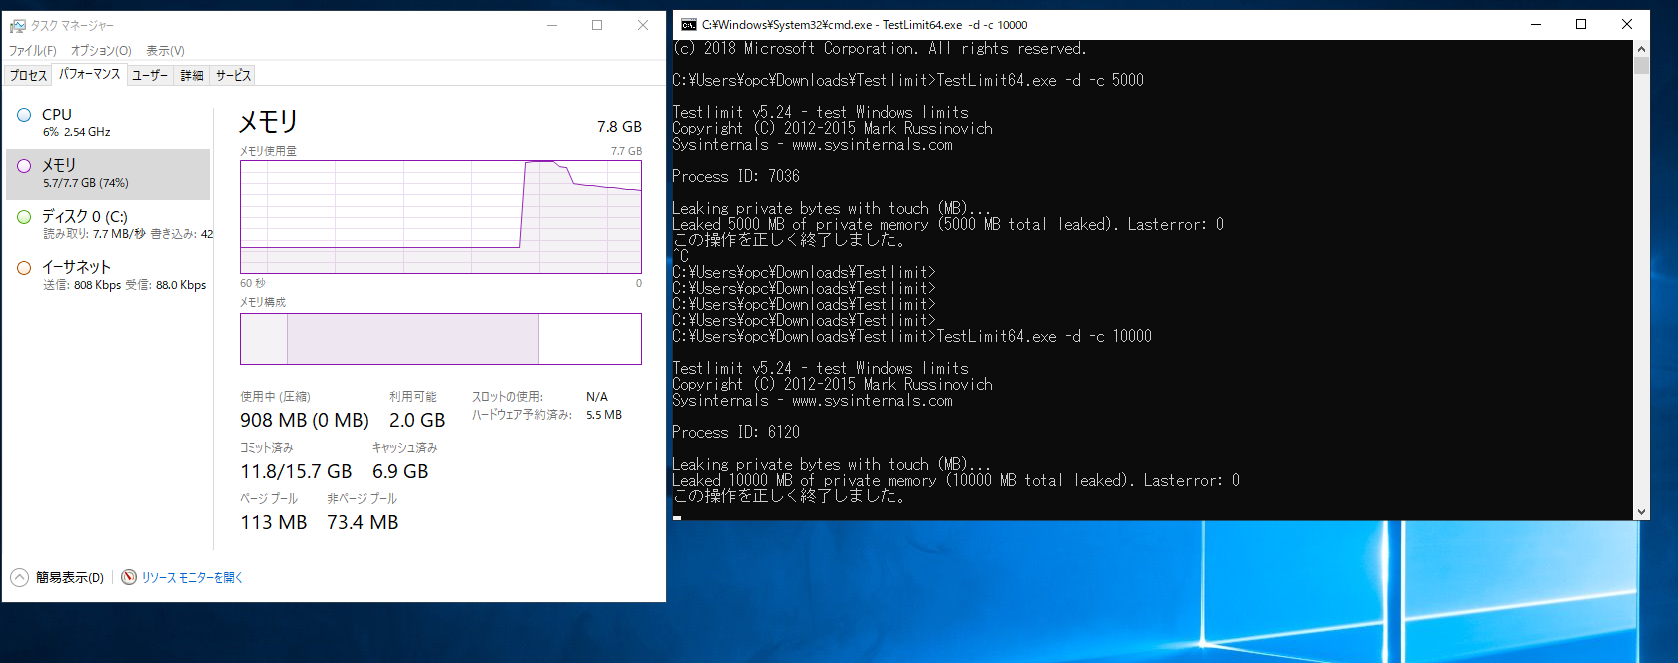
一瞬測定できなくなって80%弱を記録。100%はさすがにないのか
速度、合計、数の数値は相変わらず意味不明
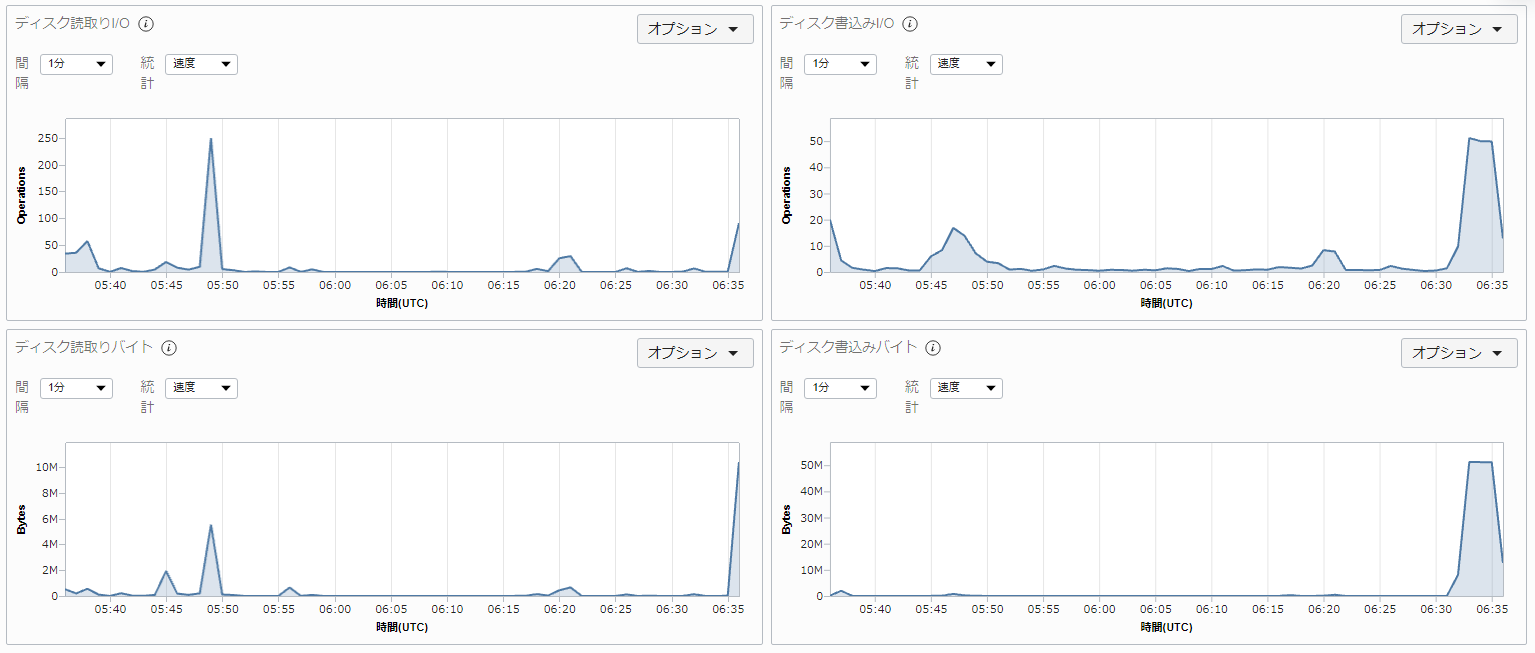
disk
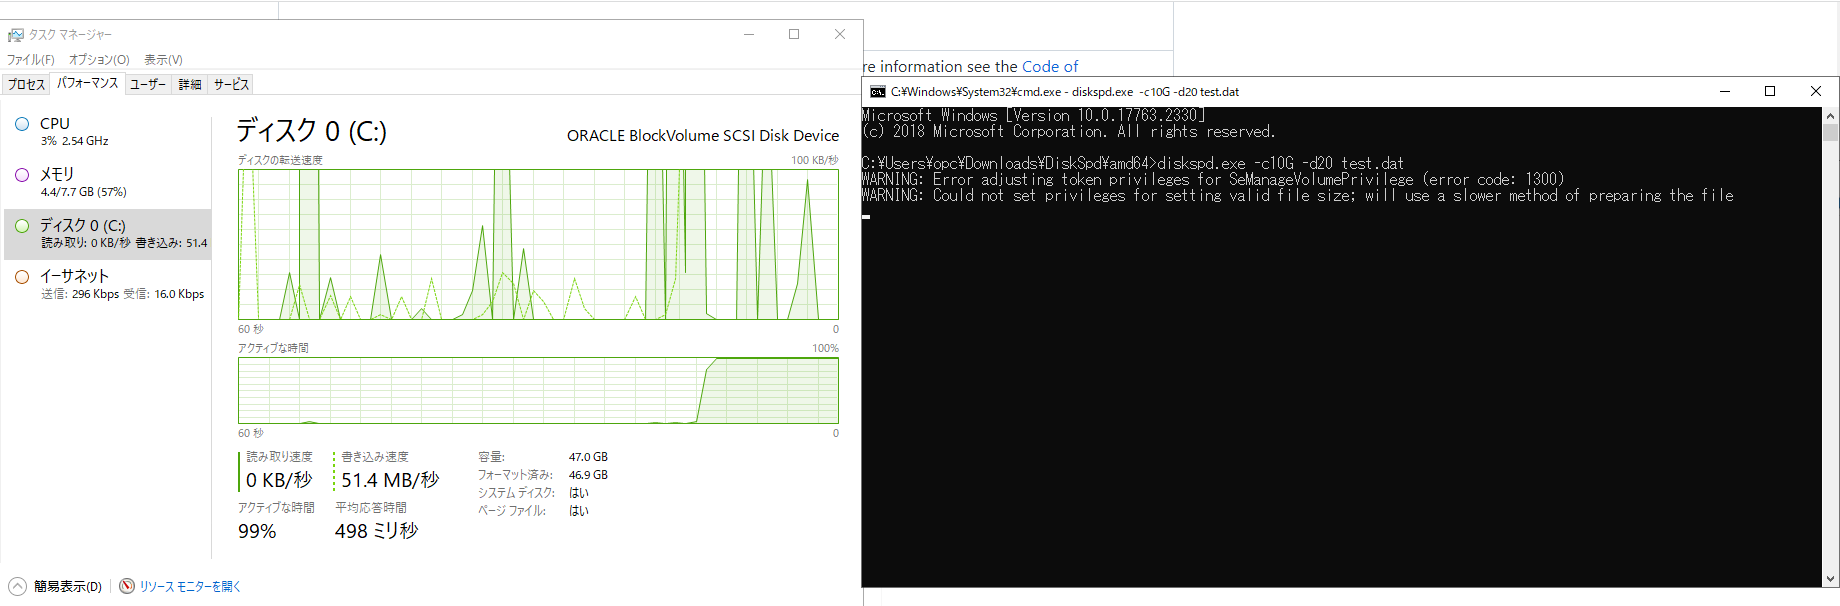
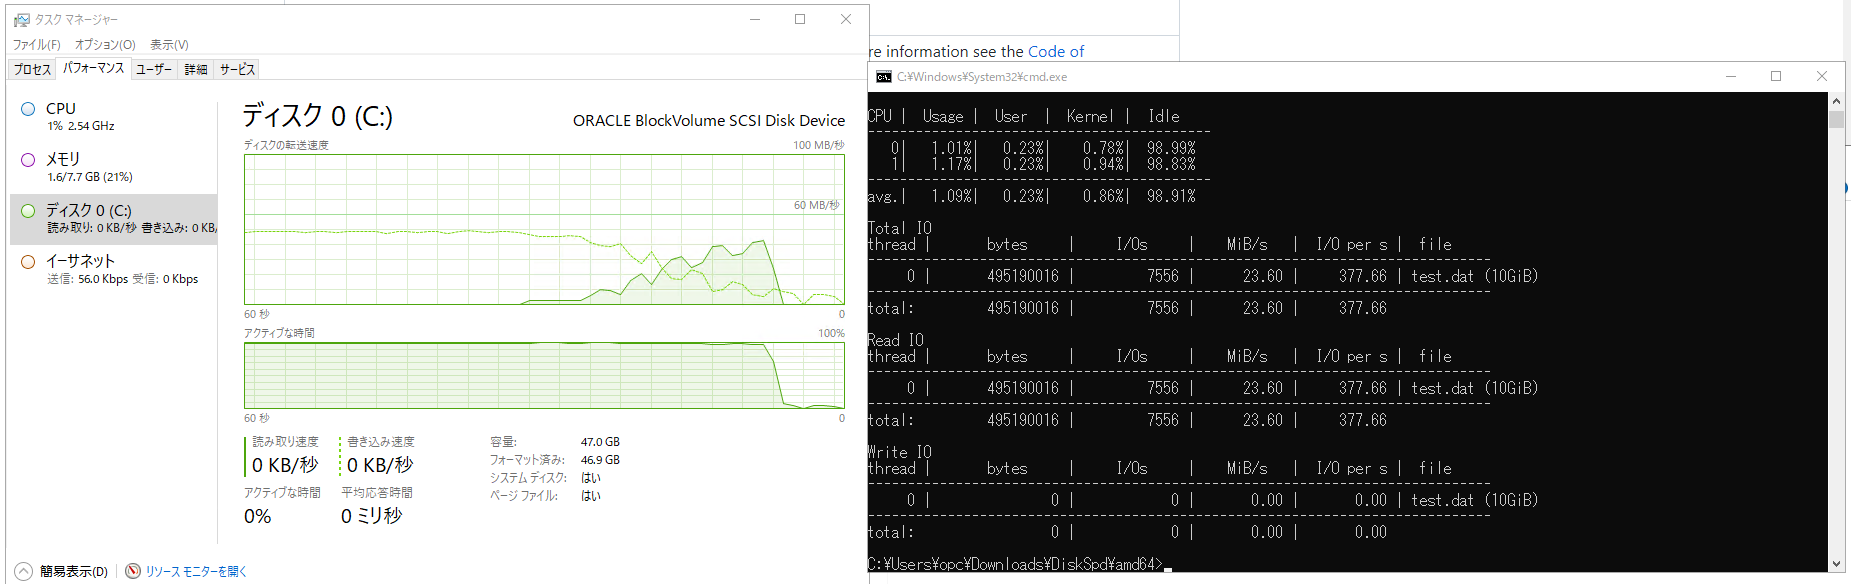
disk I/Oは速度を見るほうがよさそう