概要
scikit-learn の RandomForestClassifier のメソッドpredict_proba()は各クラス確率の推定値を出力します。このクラス確率の推定値とは具体的に何か、メモを実行結果と共に残します。
まず、1本の決定木であるDecisionTreeClassifierのpredict_proba()を理解し、その後、複数の決定木で構成される RandomForestClassifierのpredict_proba()を確認しました。
確認結果
- DecisionTreeClassifierの
predict_proba()
\begin{align}
クラスAの確率値&=\frac{そのリーフノード内のクラスAのサンプル数}{そのリーフノード内のすべてのサンプル数},\\
\\
クラスBの確率値&=\frac{そのリーフノード内のクラスBのサンプル数}{そのリーフノード内のすべてのサンプル数},\
\\
クラスC・・・
\end{align}
- RandomForestClassifierの
predict_proba()- モデル内の各決定木の各クラス確率の平均
確認過程
実行環境
- OS: Windows 10
- Python 3.9.5
- sklearn 0.24.2
- matplotlib 3.4.2
DecisionTreeClassifier のpredict_proba()
まず、決定木(分類用)1本の predict_proba() を確認します。
公式ドキュメントより
sklearn.tree.DecisionTreeClassifier
The predicted class probability is the fraction of samples of the same class in a leaf.
ふむふむ、決定木のpredict_proba()は、そのリーフノード内のサンプルに対するそのクラスのサンプルの割合を表しているのですね。
サンプルデータで確認
お馴染みのirisデータセットを使います。
from sklearn.datasets import load_iris
from sklearn.tree import DecisionTreeClassifier, plot_tree
import matplotlib.pyplot as plt

iris = load_iris()

# データ確認
print(iris.data[:5])  # 各説明変数の値(先頭5件)
# -> [[5.1 3.5 1.4 0.2]
# ->  [4.9 3.  1.4 0.2]
# ->  [4.7 3.2 1.3 0.2]
# ->  [4.6 3.1 1.5 0.2]
# ->  [5.  3.6 1.4 0.2]]
print(iris.feature_names)  # 各説明変数名
# -> ['sepal length (cm)', 'sepal width (cm)', 'petal length (cm)', 'petal width (cm)']
print(iris.target[:5])  # 正解ラベルの値(先頭5件)
# -> [0 0 0 0 0]
print(set(iris.target))  # 正解ラベルのユニーク値
# -> {0, 1, 2}
print(iris.target_names)
# -> ['setosa' 'versicolor' 'virginica']  ★ 0=setosa, 1=versicolor, 2=virginica

# 学習
X, y = iris.data, iris.target
# 今回の目的のため、木の最大深さを2に設定してシンプルなモデルに。
tree_clf = DecisionTreeClassifier(max_depth=2, random_state=42)
tree_clf.fit(X, y)
決定木をプロットします。
ここでは、最初にimportしておいた sklearn.tree.plot_tree()を使っています。
※ sklearn Vr.0.21で追加されたプロット機能です。
plot_tree(
    tree_clf,
    feature_names=iris.feature_names,
    class_names=iris.target_names,
    impurity=False,  # 不純度は今回の話には不要なので表示しない
    node_ids=True,  # 各ノードのIDを表示
    filled=True,  # ノードを各クラスのサンプル割合に応じて色付け
)
【プロット1】
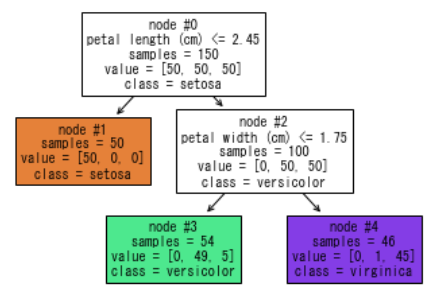
各ノード内の値の補足:
-
node #X: ノードID -
samples: そのノードのサンプル数(この例の場合) -
value: [クラス0(satosa)のサンプル数, クラス1(versicolor)のサンプル数、クラス2(virginica)のサンプル数] -
classes: そのノードのクラス
※ samples は、公式ドキュメントによると重み付けされたサンプル数が表示されるようです(この決定木ではサンプルに重みがないため、サンプル数がそのまま表示されています)。
"The sample counts that are shown are weighted with any sample_weights that might be present."
上記【プロット1】より、samples と value に関しては、以下のようなことがが分かります。
- 全サンプル数は150 ・・・node#0 の
samplesより - node#3 のサンプル数は54 ・・・node #3 の
samplesより - node#3 のサンプルの内訳は以下の通り・・・node#3 の
valueより- クラス0(setosa)が0
- クラス1(versicolor)が49
- クラス2(virginica)が5
ここで、samples を%表示, value を比率で表示するように変更します。
# プロットの描画サイズ調整(今回は小数第8位までの出力するため見やすいサイズに)
ax = plt.figure(figsize=(12, 6)).add_subplot()

plot_tree(
    tree_clf,
    feature_names=iris.feature_names,
    class_names=iris.target_names,
    impurity=False,
    node_ids=True,
    filled=True,
    proportion=True,  # 各ノードのsamplesを%表示, value を各クラスの比率で表示する
    precision=8,  # 小数第8位まで表示
    ax=ax  # 事前準備しておいたaxを適用
)
【プロット2】

オプション追加により、samples と value の表示が変わりました。
それぞれ、以下の通りであることが確認できます。
-
samples: そのノードのサンプル数が全サンプル数に占める割合(%)- node#3 の場合:
- node#3内のサンプル数54 ÷ 全サンプル数150 * 100 = 36.0(%)
- node#3 の場合:
-
value: ノード内の[クラス0(satosa)の比率, クラス1(versicolor)の比率、クラス2(virginica)の比率]- node#3 の場合:
- クラス0の比率: node#3のクラス0のサンプル数0 ÷ node#3のサンプル数54 = 0.0
- クラス1の比率: node#3のクラス1のサンプル数49 ÷ node#3のサンプル数54 = 0.90740741
- クラス2の比率: node#3のクラス2のサンプル数5 ÷ node#3のサンプル数54 = 0.09259259
- node#3 の場合:
テストデータを作成し、predict_proba() の出力(各クラス確率の推定値)を確認します。
【プロット2】で確認した各クラスの比率ですね。
# 【テストデータA】node#3に入る
tree_clf.predict_proba([[5.1, 3.5, 2.5, 1.7]])
# -> array([[0.        , 0.90740741, 0.09259259]])

# 【テストデータB】node#1に入る
tree_clf.predict_proba([[5.1, 3.5, 1.4, 0.2]])
# -> array([[1., 0., 0.]])
RandomForestClassifier のpredict_proba()
次に複数の決定木を並列に扱うランダムフォレスト(分類用)の predict_proba() を確認します。
公式ドキュメントより
sklearn.ensemble.RandomForestClassifier
The predicted class probabilities of an input sample are computed as the mean predicted class probabilities of the trees in the forest.
ふむふむ、モデル内の決定木1本1本が出してくるクラス確率の推定値の平均だそうです。
サンプルデータで確認
引き続きirisデータセットで確認します。
まず、ランダムフォレストのモデルを作成します。
木の数2、と小さい値を指定しました(オプション n_estimators=2)
from sklearn.ensemble import RandomForestClassifier

rf_clf = RandomForestClassifier(n_estimators=2, max_depth=2, random_state=42)
rf_clf.fit(X, y)
次に、決定木の確認で使用した【テストデータA】を使い ランダムフォレストの predict_proba() の出力を確認します。
rf_clf.predict_proba([[5.1, 3.5, 2.5, 1.7]])
# -> array([[0.        , 0.48039216, 0.51960784]])
RandomForestClassifier の predict_proba() は、決定木1本1本が出してくるクラス確率の推定値の平均 ということなので、決定木ごとにクラス確率の推定値を見てみます。
print(f"ランダムフォレスト内の決定木の数: {len(rf_clf.estimators_)}", end="\n\n")

fig = plt.figure(figsize=(25, 6))
for idx, tree in enumerate(rf_clf.estimators_):
    print(f"tree_{idx}")
    print(f"- サンプル数: {tree.tree_.n_node_samples[0]}")  # ルートノードのサンプル数 = この決定木のサンプル数
    print(f"- tree_{idx}のpredict_proba()の出力: {tree.predict_proba([[5.1, 3.5, 2.5, 1.7]])}", end="\n\n")
    ax = fig.add_subplot(1, 2, idx+1)
    plot_tree(
        tree,
        feature_names=iris.feature_names,
        class_names=iris.target_names,
        impurity=False,
        node_ids=True,
        filled=True,
        proportion=True,
        precision=8,
        ax=ax,
    )

# -> ランダムフォレスト内の決定木の数: 2
#
# -> tree_0
# -> - サンプル数: 101
# -> - tree_0のpredict_proba()の出力: [[0.         0.96078431 0.03921569]]
#
# -> tree_1
# -> - サンプル数: 97
# -> - tree_1のpredict_proba()の出力: [[0. 0. 1.]]

2つの決定木の predict_proba(【テストデータA】) の出力を上記コード内のコメントに記載しました。
クラス毎に平均を計算してみます.
| クラス0(setosa) | クラス1(versicolor) | クラス2(virginica) | |
|---|---|---|---|
| tree_0 のクラス確率の推定値 | 0.0 | 0.96078431 | 0.03921569 |
| tree_1 のクラス確率の推定値 | 0.0 | 0.0 | 1.0 |
| 平均 | 0.0 | 0.480392155 | 0.519607845 |
ここで、ランダムフォレストの predict_proba(【テストデータA】) の出力を再掲。
rf_clf.predict_proba([[5.1, 3.5, 2.5, 1.7]])
# -> array([[0.        , 0.48039216, 0.51960784]])
微細な誤差はありますが、上記で計算した各クラス確率の推定値の平均とほぼ一致しました。
データを見ながら具体的に predict_proba() について確認しました。
補足
RandomForestClassifier の predict() で予測されるクラスは、木々の多数決で決まるのではなく、クラス確率の推定値( predict_proba()の出力 )が最も高いクラスです。(RandomForestClassifier.predict() の説明より)
その predict_proba() は、上記で見てきた通り、各決定木が出してくるクラス確率の推定値の平均です。
scickit-learn のランダムフォレストの実装が原著と異なる点として、この点が挙げられています。
(ここより)
In contrast to the original publication [B2001], the scikit-learn implementation combines classifiers by averaging their probabilistic prediction, instead of letting each classifier vote for a single class.