課題
2つのリストA, Bがあり、リストBの中にリストAの項目があるかどうかをできるだけ早く検索する。
ただし、A, Bともにすでにソートされているものとする。
制約
- A, Bともにわりと大きい(1000以上、10000以上もありうる)
- A, Bは整数のリスト
業務中に考えたコード
ソートされているコードを検索するのであれば、二分木探索(bisect)が一番早いはずなので、
Aをcompare_source、Bをcompare_targetとおいて、下記ようなのコードにするのがO(|A| * log(|B|))で早いと判断した。
item_index = 0
target_size = len(self.compare_target)

for i, source in enumerate(self.compare_source):
    item_index = bisect.bisect_left(self.compare_target, source, lo=item_index)
    if target_size > item_index and self.compare_target[item_index] == source:
        self.compare_results[i] = True
AもBもソートされているので、A[i]を超える一番小さなBの要素をB[j]としたら、A[i + 1]はB[j]~B[len(B)]までの間にあるので、
それに着目して計算量をできるだけ減らしてみた。
対抗馬はBをsetにしてA[i] in set(B)のように計算することで、検索の計算量はO(|A|)だが、setの作成コストがかかるはず。
Bの分量が十分大きければ計算量の差より作成コストが小さくなるはずだが、どうだろうか。
検証用コード
実際に検証に使ったコードは下記のとおり。
import random
import datetime as dt
import numpy as np
import bisect
import matplotlib.pyplot as plt


def test_method(tester: "TestClass") -> int:
    """ 作業時間を計測し、かかった時間を返す

    :param tester: テストを行いたいクラス
    :return: かかった時間(マイクロ秒)
    """
    tester.setup()
    start_time = dt.datetime.now()
    tester.work()
    end_time = dt.datetime.now()
    work_time = end_time - start_time
    return work_time.seconds * 10 ** 6 + work_time.microseconds


class CompareList:
    def __init__(self, source_list: list[int], check_list: list[int]):
        self.compare_source = source_list
        self.compare_target = check_list
        self.compare_results = np.zeros(len(self.compare_source), bool)

    def count_found_items(self):
        return self.compare_results.sum()


class TestClass:
    def setup(self):
        pass

    def work(self):
        raise NotImplementedError

    @property
    def result(self):
        raise NotImplementedError


class FindByBisect(CompareList, TestClass):
    def __init__(self, source_list: list[int], check_list: list[int]):
        super().__init__(source_list, check_list)

    def work(self):
        item_index = 0
        target_size = len(self.compare_target)

        for i, source in enumerate(self.compare_source):
            item_index = bisect.bisect_left(self.compare_target, source, lo=item_index)
            if target_size > item_index and self.compare_target[item_index] == source:
                self.compare_results[i] = True

    @property
    def result(self):
        return self.count_found_items()


class FindByDict(CompareList, TestClass):
    def __init__(self, source_list: list[int], check_list: list[int]):
        super().__init__(source_list, check_list)

    def work(self):
        compare_set = set(self.compare_target)
        for i, source in enumerate(self.compare_source):
            if source in compare_set:
                self.compare_results[i] = True

    @property
    def result(self):
        return self.count_found_items()


def test_time(source_size: int, target_size: int):
    print(f"{source_size} 準備開始", end="")
    size = max(source_size, target_size)
    source = sorted([random.randint(0, size) for _ in range(source_size)])
    target = sorted([random.randint(0, size) for _ in range(target_size)])

    print(f"\r{source_size} 計測開始", end="")
    bisect_tester = FindByBisect(source, target)
    dict_tester = FindByDict(source, target)

    bisect_time = test_method(bisect_tester) / 1000
    set_time = test_method(dict_tester) / 1000

    assert bisect_tester.result == dict_tester.result

    print(f"\r{source_size} 計測完了")

    return bisect_time, set_time


if __name__ == '__main__':
    target_mul = 10
    start_items = 100
    test_points = [start_items * 2 ** i for i in range(15)]
    test_time_results = [test_time(x, x * target_mul) for x in test_points]

    fig = plt.figure()

    axis = fig.add_subplot(xlabel='data_count', xscale='log', ylabel='time', yscale='log')

    axis.plot(test_points, test_time_results)
    fig.legend(labels=['bisect', 'set'])

    plt.show()
AとBには適当な乱数のリストを使うことにした。
Aの個数をstart_items、Bの個数をA * target_mulとして、Aの個数を倍にしながらプロットをとっていった。
start_itemsとtarget_mulを(1000,1)と(100,10)の2つで試してみた。
なお、ブラフの作成には下記のページを参考にした。
matplotlibのめっちゃまとめ
結果
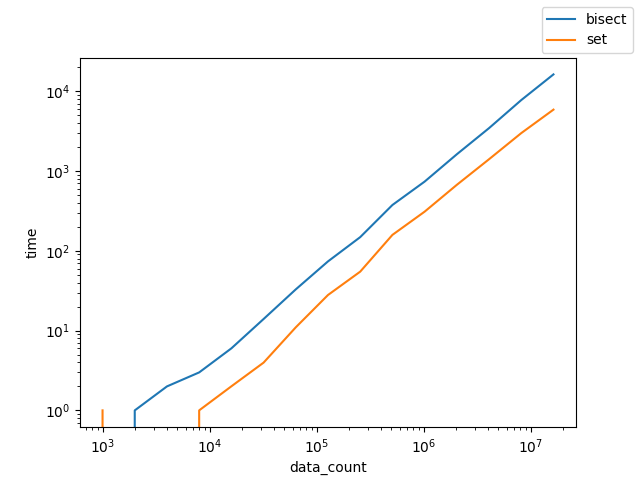
縦軸が所要時間、横軸がAの個数となる。計算量の見込みから縦軸と横軸に対数をとってある。
時間はミリ秒単位となる。
start_items, target_mul = (1000,1)の時
start_items, target_mul = (100,10)の時
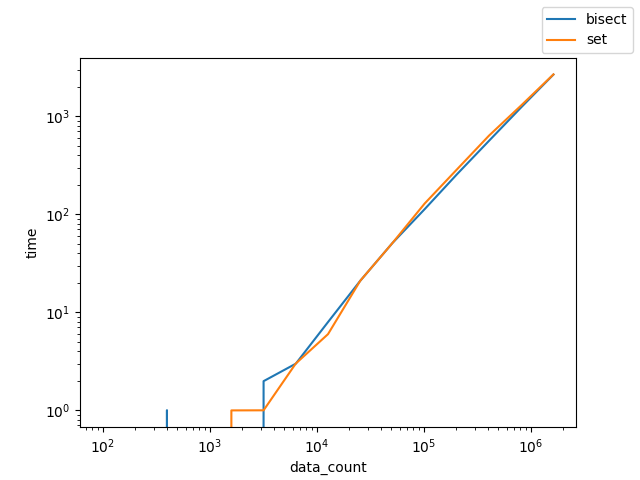
AもBも同じサイズだったときは残念ながらsetを使ったほうが早いとの結果になった。
ただ、定数倍で収まっていそうに見えるので、そこまで悪い選択肢ではなかったようだ。
Bを大きくした時は、setもbisectも同じような速度なので、setの作成コストはおそらくO(logN)なんだろうな。
追加の検証
ソートされていることを活かせばO(|A| + |B|)で行けるというツッコミをもらいました。
確かにこんな感じでもう一個クラスを作って、
class FindByAllSearch(CompareList, TestClass):
    def __init__(self, source_list: list[int], check_list: list[int]):
        super().__init__(source_list, check_list)

    def work(self):
        item_index = 0
        search_index = 0
        target_size = len(self.compare_target)
        item_size = len(self.compare_source)

        while search_index < target_size and item_index < item_size:
            if self.compare_source[item_index] == self.compare_target[search_index]:
                self.compare_results[item_index] = True
                item_index += 1
            elif self.compare_source[item_index] > self.compare_target[search_index]:
                search_index += 1
            else:
                item_index += 1

    @property
    def result(self):
        return self.count_found_items()
3つ全部同時に表示させれば簡単に対応できる。
def test_time(source_size: int, target_size: int):
    print(f"{source_size} 準備開始", end="")
    size = max(source_size, target_size)
    source = sorted([random.randint(0, size) for _ in range(source_size)])
    target = sorted([random.randint(0, size) for _ in range(target_size)])

    print(f"\r{source_size} 計測開始", end="")
    bisect_tester = FindByBisect(source, target)
    dict_tester = FindByDict(source, target)
    all_tester = FindByAllSearch(source, target)

    bisect_time = test_method(bisect_tester) / 1000
    set_time = test_method(dict_tester) / 1000
    all_time = test_method(all_tester) / 1000

    assert bisect_tester.result == dict_tester.result == all_tester.result

    print(f"\r{source_size} 計測完了")

    return bisect_time, set_time, all_time


if __name__ == '__main__':
    target_mul = 1
    test_points = [10000 * 2 ** i for i in range(10)]
    test_time_results = [test_time(x, x * target_mul) for x in test_points]

    fig = plt.figure()

    axis = fig.add_subplot(xlabel='data_count', xscale='log', ylabel='time', yscale='log')

    axis.plot(test_points, test_time_results)
    fig.legend(labels=['bisect', 'set', 'all'])

    plt.show()
これを使った検証結果は以下の通り。
劇的な差がない上、場合によっては一番遅いという結果になった。
標準ライブラリを使わなければ配列のアクセスのコストが大きすぎて、
このデータ数だと逆に時間がかかる、ということだろうか。
start_items, target_mul = (10000,1)の時

start_items, target_mul = (1000,10)の時

なお、リストをnumpyのリストにしてもこの速度関係に変化はなかった。