本記事は、めんどい太郎の Advent Calendar 2025 20日目の記事です。
はじめに
18日の記事ではMackerelでRaspberry Piを監視してみました。
今回はPrometheusを使って監視してみます。
今回はVPS上にあるPrometheusがRaspberry PiにインストールしたPrometheus Node Exporterへアクセスする形式をとります。
なぜなら、PrometheusをRaspberry Piに置いておくとログの記録でSDカードの寿命が縮まりそうだからです。
(まぁあとはすでにVPS上にPrometheusがあるから一括でやりたかったというのもある)
環境
- Raspberry Pi 4 Model B (8GB)
- OS: Raspberry Pi OS Lite (64bit)
Prometheus Node Exporterのインストール
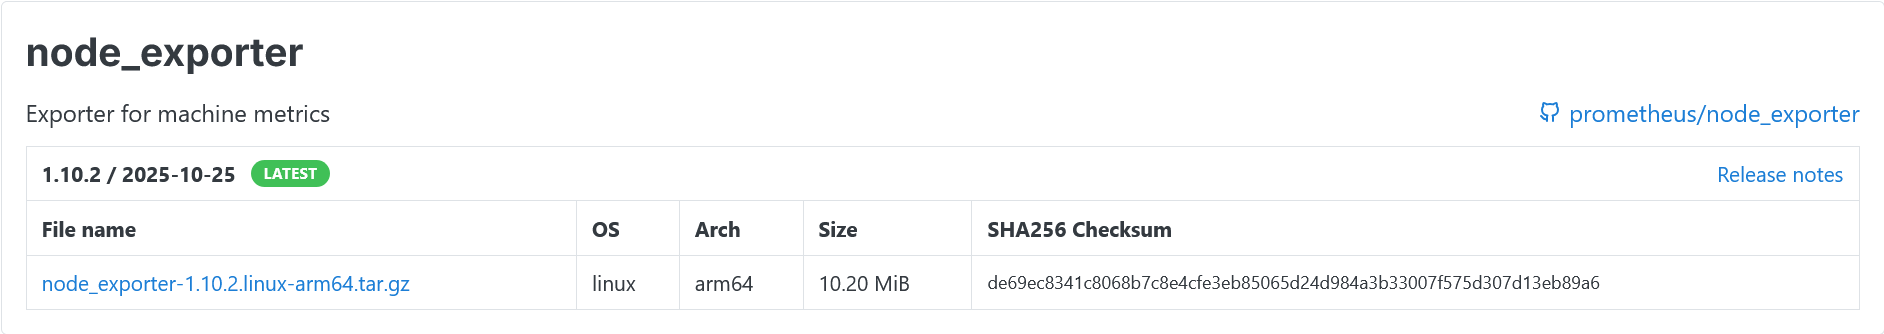
まずはダウンロードページへアクセスします。
Operating SystemをLinuxに、Architectureをarm64にします。
node_exporterにあるダウンロードリンクをコピーしておきます。
Raspberry PiへSSHでログインし、Node Exporterをダウンロードします。
下記のコマンドは実行例です。
wget https://github.com/prometheus/node_exporter/releases/download/v1.10.2/node_exporter-1.10.2.linux-arm64.tar.gz
ダウンロードしたら解凍します。
tar -xzf node_exporter-1.10.2.linux-arm64.tar.gz
実行ファイルを配置します。
cd node_exporter-1.10.2.linux-arm64
sudo cp node_exporter /usr/local/bin/
systemdの設定
次にsystemdの設定を行います。
まずはユーザを作成します。
sudo useradd --no-create-home --shell /bin/false node_exporter
次に実行ファイルへ権限を与えます。
sudo chown node_exporter:node_exporter /usr/local/bin/node_exporter
次にsystemdのユニットファイルを作成します。
[Unit]
Description=Node Exporter
Wants=network-online.target
After=network-online.target

[Service]
User=node_exporter
Group=node_exporter
Type=simple
ExecStart=/usr/local/bin/node_exporter

[Install]
WantedBy=multi-user.target
そうしたら起動します。
sudo systemctl daemon-reload
sudo systemctl start node_exporter
sudo systemctl enable node_exporter
ちゃんと動作しているか確認します。
curl localhost:9100/metrics
なんかいろいろ返ってきてエラーが出てなさそうであれば大丈夫です。
tailscaleの設定
次にRaspberry Piにtailscaleをインストールして設定します。
といっても簡単です。
まずは、tailcaleのAdmin consoleにログインします。
Add deviceボタンを押します。
Client deviceを選択します。
Linuxを選択し、表示されたコマンドをRaspberry Piで実行します。
途中、ログイン用のURLが表示されるかと思いますのでこれは作業用PCでアクセスしてログインします。
すると、machinesに表示されているかと思います。
Raspberry PiにあたるクライアントのメニューからDisable key expiryを選択します。
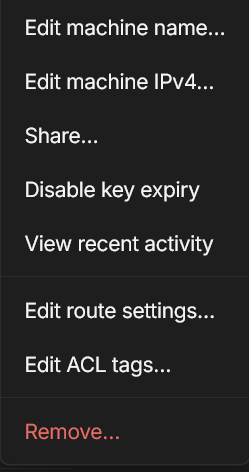
これでOKです。
Prometheusの設定
次にVPS上のPrometheusの設定を行います。
prometheus.ymlにRaspberry PiのNode Exporterを追加します。
  - job_name: 'raspberry_pi_node_exporter'
    static_configs:
      - targets: ['<Raspberry_Piのtailscale_IP>:9100']
raspberry_pi_node_exporterはお好きな名前でどうぞ。
Prometheusを再起動します。
sudo systemctl restart prometheus
Prometheusのダッシュボードを見てちゃんと追加されているかを確認してみます。
Grafanaで見てみる
ついでにGrafanaでも見てみます。
Grafanaの探検からクエリを選び、ソースをPrometheusにします。
Aをcodeにして次の式を入れます。
node_memory_MemAvailable_bytes{job="raspberry_pi_node_exporter"} / node_memory_MemTotal_bytes{job="raspberry_pi_node_exporter"} * -100 + 100
raspberry_pi_node_exporterは先ほどJobとして指定したものにしてください。
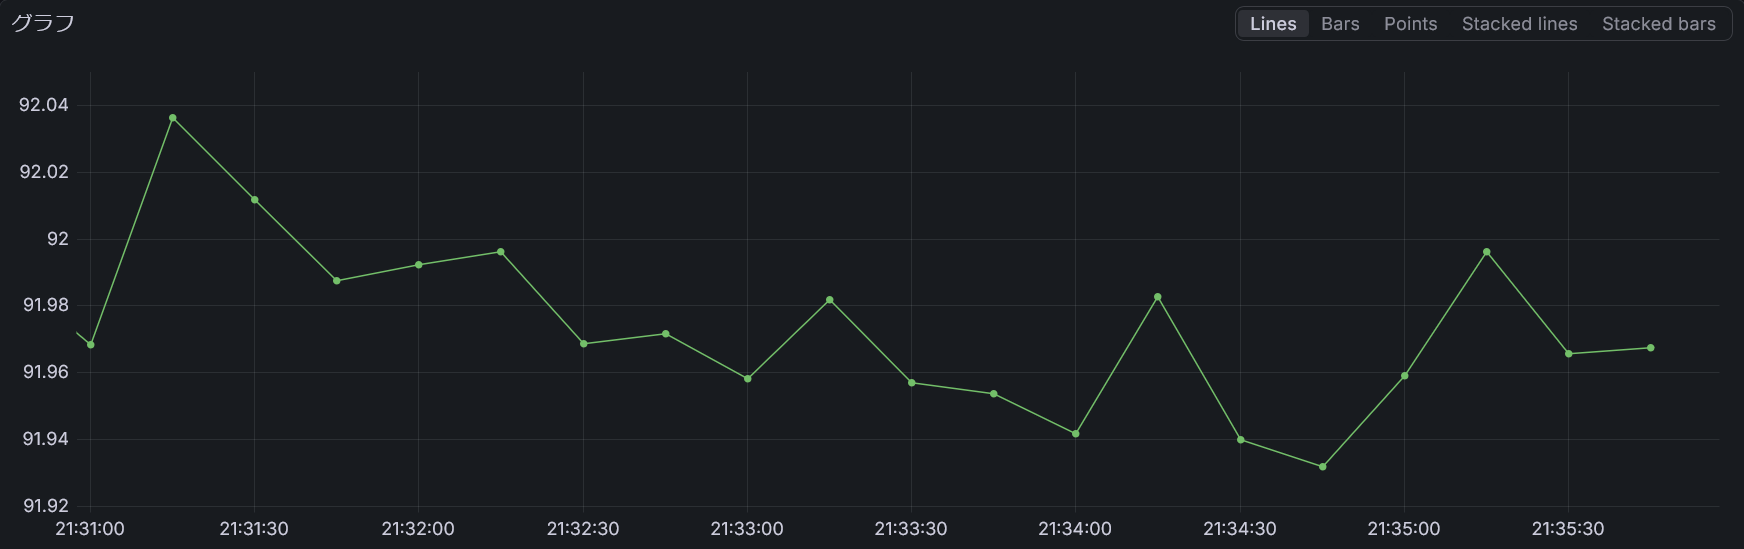
いい感じに取得できました!
(使用率が高いのは気にしないでください。)
おわりに
今回はPrometheusを使ってRaspberry Piの監視をする設定をしてみました。
Prometheusは柔軟に監視できるので便利ですね。
しかもオープンソースです。めっちゃ便利。
今回ちらっと出てきたGarfanaを使うといい感じに可視化できます。
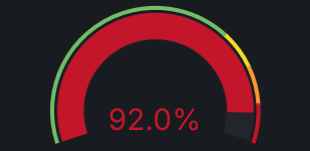
こんな感じの表示にすることもできます。見やすい。
ぜひ試してみてください。
(もしかしたら記事にするかも)
それでは!