多層パーセプトロン(Multilayer perceptron、MLP)は、順伝播型ニューラルネットワークの一種であり、少なくとも3つのノードの層からなります。
たとえば、入力層Xに4つのノード、隠れ層Hに3つのノード、出力層Oに3つのノードを配置したMLPの構成は次のようになります。
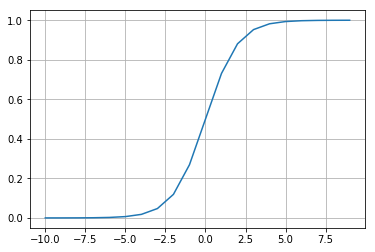
入力ノード以外の個々のノードは非線形活性化関数を使用するニューロンであり、誤差逆伝播法(バックプロパゲーション)と呼ばれる教師あり学習手法を利用することで、線形分離可能ではないデータを識別できます。非線形活性化関数として使われる関数のひとつに、シグモイド関数があります。
あやめのデータ(3品種)を例に説明します。
# 数値計算やデータフレーム操作に関するライブラリをインポートする
import numpy as np
import pandas as pd
# URL によるリソースへのアクセスを提供するライブラリをインポートする。
import urllib.request
# 図やグラフを図示するためのライブラリをインポートする。
import matplotlib.pyplot as plt
%matplotlib inline
url = "https://raw.githubusercontent.com/maskot1977/ipython_notebook/master/toydata/iris.txt"
urllib.request.urlretrieve(url, 'iris.txt')
('iris.txt', <http.client.HTTPMessage at 0x121ae59b0>)
df = pd.read_csv("iris.txt", sep="\t", index_col=0)
print(df.shape) # 何行何列か確認する
df.head() # 先頭五行の内容を確認する
(150, 5)
| Sepal.Length | Sepal.Width | Petal.Length | Petal.Width | Species | |
|---|---|---|---|---|---|
| 1 | 5.1 | 3.5 | 1.4 | 0.2 | 0 |
| 2 | 4.9 | 3.0 | 1.4 | 0.2 | 0 |
| 3 | 4.7 | 3.2 | 1.3 | 0.2 | 0 |
| 4 | 4.6 | 3.1 | 1.5 | 0.2 | 0 |
| 5 | 5.0 | 3.6 | 1.4 | 0.2 | 0 |
scikit-learnを使う方法
まず、説明変数X と 目的変数Y に分割します。
X = np.array(df.iloc[:, :4].values)
Y = np.array(df.iloc[:, 4])
sklearn の neural_network から MLPClassifier クラスをインポートし、MLPClassifier クラスのインスタンスを生成します。
from sklearn.neural_network import MLPClassifier
clf = MLPClassifier(max_iter=10000)
X と Y の関係を学習します。
clf.fit(X, Y)
MLPClassifier(activation='relu', alpha=0.0001, batch_size='auto', beta_1=0.9,
       beta_2=0.999, early_stopping=False, epsilon=1e-08,
       hidden_layer_sizes=(100,), learning_rate='constant',
       learning_rate_init=0.001, max_iter=10000, momentum=0.9,
       n_iter_no_change=10, nesterovs_momentum=True, power_t=0.5,
       random_state=None, shuffle=True, solver='adam', tol=0.0001,
       validation_fraction=0.1, verbose=False, warm_start=False)
予測精度 (accuracy score) は clf.score() で計算できます。
clf.score(X, Y)
0.98
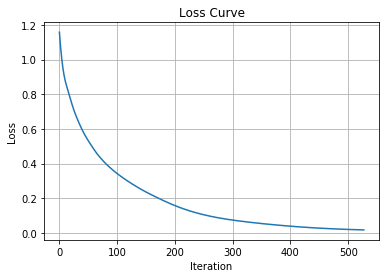
損失(教師データと予測データとのズレ)の履歴は clf.loss_curve_ に保存されています。
%matplotlib inline
import matplotlib.pyplot as plt
plt.title("Loss Curve")
plt.plot(clf.loss_curve_)
plt.xlabel("Iteration")
plt.ylabel("Loss")
plt.grid()
plt.show()
予測結果は clf.predict() で求められます。学習に用いなかった新規データを与えれば、そのデータに対する新規予測を返します。
clf.predict(X)
array([0, 0, 0, 0, 0, 0, 0, 0, 0, 0, 0, 0, 0, 0, 0, 0, 0, 0, 0, 0, 0, 0,
       0, 0, 0, 0, 0, 0, 0, 0, 0, 0, 0, 0, 0, 0, 0, 0, 0, 0, 0, 0, 0, 0,
       0, 0, 0, 0, 0, 0, 1, 1, 1, 1, 1, 1, 1, 1, 1, 1, 1, 1, 1, 1, 1, 1,
       1, 1, 1, 1, 2, 1, 1, 1, 1, 1, 1, 1, 1, 1, 1, 1, 1, 2, 1, 1, 1, 1,
       1, 1, 1, 1, 1, 1, 1, 1, 1, 1, 1, 1, 2, 2, 2, 2, 2, 2, 2, 2, 2, 2,
       2, 2, 2, 2, 2, 2, 2, 2, 2, 2, 2, 2, 2, 2, 2, 2, 2, 2, 2, 2, 2, 2,
       2, 1, 2, 2, 2, 2, 2, 2, 2, 2, 2, 2, 2, 2, 2, 2, 2, 2])
それぞれの予測に対する自信のほどは、clf.predict_proba() を使えば窺い知ることができます。
pd.DataFrame(clf.predict_proba(X)).head()
| 0 | 1 | 2 | |
|---|---|---|---|
| 0 | 0.999050 | 0.000950 | 1.762854e-10 |
| 1 | 0.995972 | 0.004028 | 2.084842e-09 |
| 2 | 0.998272 | 0.001728 | 9.007917e-10 |
| 3 | 0.995533 | 0.004467 | 4.888747e-09 |
| 4 | 0.999267 | 0.000733 | 1.519095e-10 |
このクラスで定義されているパラメーターは clf.get_params で確認できます。
clf.get_params
<bound method BaseEstimator.get_params of MLPClassifier(activation='relu', alpha=0.0001, batch_size='auto', beta_1=0.9,
       beta_2=0.999, early_stopping=False, epsilon=1e-08,
       hidden_layer_sizes=(100,), learning_rate='constant',
       learning_rate_init=0.001, max_iter=10000, momentum=0.9,
       n_iter_no_change=10, nesterovs_momentum=True, power_t=0.5,
       random_state=None, shuffle=True, solver='adam', tol=0.0001,
       validation_fraction=0.1, verbose=False, warm_start=False)>
solverパラメータに入れられるのは、'sgd', 'adam', 'lbfgs' のいずれかです。activationパラメータに入れられるのは 'identity', 'logistic', 'tanh', 'relu' のいずれかです。何か適当な値に変換して計算し直してみましょう。デフォルトパラメータより良い値が出るでしょうか?
clf = MLPClassifier(max_iter=1000, hidden_layer_sizes=(10,), activation='logistic', solver='sgd', learning_rate_init=0.01)
clf.fit(X, Y)
clf.score(X, Y)
/Users/kot/miniconda3/envs/py3new/lib/python3.6/site-packages/sklearn/neural_network/multilayer_perceptron.py:562: ConvergenceWarning: Stochastic Optimizer: Maximum iterations (1000) reached and the optimization hasn't converged yet.
  % self.max_iter, ConvergenceWarning)

0.98
このときの Warning は、「まだ値が収束してないけど、いいの?」というWarningです。
グリッドサーチを用いたハイパーパラメーターチューニング
ハイパーパラメーターとは、学習を行う前に人間があらかじめ設定しなければならないパラメーターです。これをうまく選ぶための方法の一つが、グリッドサーチです。グリッドサーチでは、考えうる全てのハイパーパラメーターの組み合わせを全通り計算して、最良の結果を出すハイパーパラメーターを選択します。
# 計算に2〜3分かかります。
results = []
for hidden_layer_sizes in [10, 100, 1000]:
    for solver in ['sgd', 'adam', 'lbfgs']:
        for activation in ['identity', 'logistic', 'tanh', 'relu']:
            for learning_rate_init in [0.1, 0.01, 0.001]:
                clf = MLPClassifier(max_iter=10000,
                       hidden_layer_sizes=(hidden_layer_sizes,),
                       activation=activation, solver=solver,
                       learning_rate_init=learning_rate_init)
                clf.fit(X, Y)
                score = clf.score(X, Y)
                results.append([hidden_layer_sizes, activation,
                       solver, learning_rate_init, score])
pd.DataFrame([dat for dat in sorted(results, key=lambda f: f[4],
            reverse=True)], columns=["hidden_layer_sizes",
            "activation", "solver", "learning_rate_init", "score"])
| hidden_layer_sizes | activation | solver | learning_rate_init | score | |
|---|---|---|---|---|---|
| 0 | 10 | logistic | lbfgs | 0.100 | 1.000000 |
| 1 | 100 | logistic | lbfgs | 0.100 | 1.000000 |
| 2 | 100 | logistic | lbfgs | 0.010 | 1.000000 |
| 3 | 100 | logistic | lbfgs | 0.001 | 1.000000 |
| 4 | 100 | tanh | lbfgs | 0.100 | 1.000000 |
| 5 | 100 | tanh | lbfgs | 0.010 | 1.000000 |
| 6 | 100 | tanh | lbfgs | 0.001 | 1.000000 |
| 7 | 1000 | logistic | lbfgs | 0.001 | 1.000000 |
| 8 | 1000 | tanh | lbfgs | 0.100 | 1.000000 |
| 9 | 1000 | tanh | lbfgs | 0.010 | 1.000000 |
| 10 | 10 | logistic | lbfgs | 0.010 | 0.993333 |
| 11 | 10 | logistic | lbfgs | 0.001 | 0.993333 |
| 12 | 10 | tanh | lbfgs | 0.100 | 0.993333 |
| 13 | 10 | tanh | lbfgs | 0.010 | 0.993333 |
| 14 | 10 | tanh | lbfgs | 0.001 | 0.993333 |
| 15 | 100 | relu | lbfgs | 0.100 | 0.993333 |
| 16 | 100 | relu | lbfgs | 0.010 | 0.993333 |
| 17 | 1000 | tanh | sgd | 0.100 | 0.993333 |
| 18 | 10 | identity | lbfgs | 0.100 | 0.986667 |
| 19 | 10 | identity | lbfgs | 0.010 | 0.986667 |
| 20 | 10 | identity | lbfgs | 0.001 | 0.986667 |
| 21 | 10 | relu | lbfgs | 0.100 | 0.986667 |
| 22 | 10 | relu | lbfgs | 0.010 | 0.986667 |
| 23 | 10 | relu | lbfgs | 0.001 | 0.986667 |
| 24 | 100 | logistic | sgd | 0.100 | 0.986667 |
| 25 | 100 | logistic | sgd | 0.010 | 0.986667 |
| ... | ... | ... | ... | ... | ... |
| 100 | 10 | identity | sgd | 0.100 | 0.666667 |
| 101 | 10 | relu | adam | 0.100 | 0.666667 |
| 102 | 100 | identity | sgd | 0.100 | 0.666667 |
| 103 | 1000 | identity | sgd | 0.100 | 0.666667 |
| 104 | 1000 | identity | adam | 0.100 | 0.460000 |
| 105 | 1000 | logistic | sgd | 0.100 | 0.420000 |
| 106 | 1000 | logistic | adam | 0.100 | 0.333333 |
| 107 | 1000 | tanh | adam | 0.100 | 0.333333 |
108 rows × 5 columns
細かいことが知りたかったら次のように「?」を使って調べてください。たとえば、今回の計算は lbfgs の成績が良かったようですが、lbfgsとは何なのか?どういう特徴を持つのか?調べてみてください。
MLPClassifier?
過学習と交差検定
上の計算では、accuracy score が 1.0 (100%) になりました。それは完璧な予測モデルでしょうか? いいえ、違います。このモデルは、知ってる問題は完璧に解けますが、未知の問題に対して対処できる保証は何もありません。機械学習の分野で「過学習」(過剰適合、overfitting)と呼ばれる現象です。これを解決するための方法論の一つとして「交差検定」があります。
機械学習ではその性能評価をするために、既知データを訓練データ(教師データ、教師セットともいいます)とテストデータ(テストセットともいいます)に分割します。訓練データを用いて訓練(学習)して予測モデルを構築し、その予測モデル構築に用いなかったテストデータをどのくらい正しく予測できるかということで性能評価を行ないます。そのような評価方法を「交差検定」(cross-validation)と呼びます。ここでは、
- 訓練データ(全データの60%)
- X_train : 訓練データの説明変数
- Y_train : 訓練データの目的変数
- テストデータ(全データの40%)
- X_test : テストデータの説明変数
- Y_test : テストデータの目的変数
とし、X_train と Y_train の関係を学習して X_test から Y_test を予測することを目指します。
from sklearn.model_selection import train_test_split
X_train, X_test, Y_train, Y_test = train_test_split(X, Y, test_size=0.40)
このtrain_test_splitは、データをランダムにシャッフルしてから、決められた割合に従ってXとYを訓練データとテストデータに分割します。ランダムにシャッフルするので、その結果は実行するたびに変わります。したがって、それを交差検定した結果も実行するたびに変わることになります。
clf = MLPClassifier(max_iter=10000)
clf.fit(X_train, Y_train)
print("Accuracy score (train):", clf.score(X_train, Y_train))
print("Accuracy score (test):", clf.score(X_test, Y_test))
Accuracy score (train): 1.0
Accuracy score (test): 0.95
普通はこれを何度も繰り返して、グリッドサーチなどのチューニング方法と組み合わせて、テストデータに対する accuracy score が最良のモデルを選択します。
scikit-learnを使わない方法
以上、多層パーセプトロンと、多層パーセプトロンだけでなく機械学習手法全般に関する事柄を、scikit-learnを使って説明しました。次は scikit-learnを使わずに多層パーセプトロンを実装することにより、多層パーセプトロンの中身の理解を目指したいと思います。
def one_hot_vectors(V): # one hot vector に変換する
    T = pd.DataFrame([])
    T[0] = [1 if v == 0 else 0 for v in V]
    T[1] = [1 if v == 1 else 0 for v in V]
    T[2] = [1 if v == 2 else 0 for v in V]
    return np.array(T)
X = np.array(df.iloc[:, :4].values)
Y = one_hot_vectors(df.iloc[:, 4])
自前 MLP クラスの作成
class MyMLP:
    def __init__(self, input_layer_size, hidden_layer_size, output_layer_size):
        init_weight = 0.01 # ランダムな初期値に対してちょっとバラツキを控えめにする

        # 隠れ層の重み行列W1とバイアスb1にランダムな初期値を与える
        self.W1 = init_weight * np.random.randn(input_layer_size, hidden_layer_size)
        self.b1 = np.zeros(hidden_layer_size)
        self.a1 = [] # 隠れ層が保持する値(シグモイド関数による変換前)
        self.z1 = [] # 隠れ層が保持する値(シグモイド関数による変換後)

        # 出力層の重み行列W2とバイアスb2にランダムな初期値を与える
        self.W2 = init_weight * np.random.randn(hidden_layer_size, output_layer_size)
        self.b2 = np.zeros(output_layer_size)
        self.a2 = [] # 出力層が保持する値(ソフトマックス関数による変換前)
        self.z2 = [] # 出力層が保持する値(ソフトマックス関数による変換後)

        self.loss_ = -1 # 誤差
        self.loss_curve_ = [] # 誤差の履歴

        print("W1.shape=", self.W1.shape)
        print("b1.shape=", self.b1.shape)
        print("W2.shape=", self.W2.shape)
        print("b2.shape=", self.b2.shape)

    def forward_propagation(self, x): # 前向き計算
        self.a1 = np.dot(x, self.W1) + self.b1 # 入力層からの入力と重み行列との線形和+バイアス
        self.z1 = sigmoid(self.a1) # シグモイド関数で変換して隠れ層からの出力とする
        self.a2 = np.dot(self.z1, self.W2) + self.b2 # 隠れ層からの入力と重み行列との線形和+バイアス
        self.z2 = softmax(self.a2) # ソフトマックス関数で変換して出力層からの出力とする
        return self.z2 # 出力層からの出力を予測結果とする

    def backward_propagation(self, x, y_pred, y_real): # 後ろ向き計算
        grads = Gradient() # 重み行列を修正するための勾配を取りまとめるクラス
        batch_num = x.shape[0] # 入力データの総数
        dy = (y_pred - y_real) / batch_num # 全データに対して誤差を算出し、データ総数で割る
        grads.W2 = np.dot(self.z1.T, dy) # 出力層の重み行列W2を修正するための勾配
        grads.b2 = np.sum(dy, axis=0) # 出力層のバイアスb2を修正するための勾配
        dz1 = np.dot(dy, self.W2.T) # 隠れ層を修正するための誤差
        da1 = sigmoid_gradient(self.a1) * dz1 # 隠れ層を修正するための勾配
        grads.W1 = np.dot(x.T, da1) # 隠れ層の重み行列W1を修正するための勾配
        grads.b1 = np.sum(da1, axis=0) # 隠れ層のバイアスb1を修正するための勾配
        return grads # 計算した勾配をまとめて返す

    # x:入力データ, t:教師データ
    def loss(self, x, y_real): # 予測結果と本当の値とのクロスエントロピー誤差を損失関数とする
        self.loss_ = cross_entropy_error(self.forward_propagation(x), y_real)
        return self.loss_

    def score(self, x, y_real): # accuracy score
        y_real = np.argmax(y_real, axis=1)
        y_pred = np.argmax(self.forward_propagation(x), axis=1)
        accuracy = np.sum(y_pred == y_real) / float(x.shape[0])
        return accuracy

class Gradient: # 重み行列を修正するための勾配を取りまとめるクラス
    def __init__(self):
        self.W1 = np.array([])
        self.b1 = np.array([])
        self.W2 = np.array([])
        self.b2 = np.array([])
いくつかの重要関数
sigmoid 関数
シグモイド関数は、ニューラルネットが「神経細胞を模したモデル」であると言われてきた象徴とも言える関数で、非線形活性化関数として使われます。ただ、計算時間短縮の観点から、現在のディープラーニングなどではシグモイド関数ではなくReLU関数などが使われる傾向があります。順方向の計算に使います。
def sigmoid(x): # シグモイド関数
    return 1 / (1 + np.exp(-x))
sigmoid(5)
0.9933071490757153
x = np.array([[0.1, 0.2, 0.9], [0.3, 0.4, 0.5], [0.7, 0.6, 0.1]])
sigmoid(x)
array([[0.52497919, 0.549834  , 0.7109495 ],
       [0.57444252, 0.59868766, 0.62245933],
       [0.66818777, 0.64565631, 0.52497919]])
a = [x for x in range(-10, 10)]
b = [sigmoid(x) for x in range(-10, 10)]
plt.plot(a, b)
plt.grid()
plt.show()
sigmoid_gradient 関数
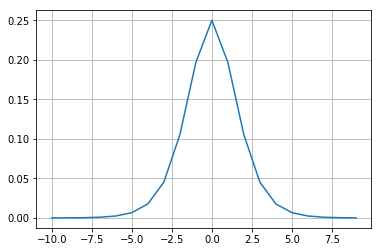
シグモイド関数の微分を使って勾配を出します。逆方向の計算で使います。シグモイド関数の微分について詳しくはこちらを参照。
def sigmoid_gradient(x): # シグモイド関数の微分
    return (1.0 - sigmoid(x)) * sigmoid(x)
a = [x for x in range(-10, 10)]
b = [sigmoid_gradient(x) for x in range(-10, 10)]
plt.plot(a, b)
plt.grid()
plt.show()
Softmax 関数
和が1になるように変換することで「確率」としての取り扱いを可能にする関数です。順方向の計算に使います。
def softmax(x): # 和が1になるように変換することで「確率」としての取り扱いを可能にする
    if x.ndim == 2:
        x = x.T
        x = x - np.max(x, axis=0)
        y = np.exp(x) / np.sum(np.exp(x), axis=0)
        return y.T
    x = x - np.max(x)
    return np.exp(x) / np.sum(np.exp(x))
x = np.array([[1, 2, 3], [3, 4, 5]])
softmax(x)
array([[0.09003057, 0.24472847, 0.66524096],
       [0.09003057, 0.24472847, 0.66524096]])
softmax(x).sum(axis=1)
array([1., 1.])
交差エントロピー誤差
交差エントロピーとは、2つの確率分布の間に定義される値で、二つの分布が異なるほど大きな値をとります。ニューラルネットワークやディープラーニングでは、ソフトマックス関数と組み合わせて、誤差(損失)の計算によく使われます。
def cross_entropy_error(y_pred, y_real): # クロスエントロピー誤差
    if y_real.ndim == 1:
        y_real = y_real.reshape(1, t.size)
        y_pred = y_pred.reshape(1, y.size)
    if y_real.size == y_pred.size:
        y_real = y_real.argmax(axis=1)
    batch_size = y_pred.shape[0]
    return -np.sum(np.log(y_pred[np.arange(batch_size), y_real] + 1e-8)) / batch_size
自作MyMLPクラスのインスタンスを生成する
作成したインスタンスはnetという変数に入れます。
net = MyMLP(input_layer_size=4, hidden_layer_size=3, output_layer_size=3)
W1.shape= (4, 3)
b1.shape= (3,)
W2.shape= (3, 3)
b2.shape= (3,)
実際の学習手順
今回は収束条件の判定は特に行わず、繰り返しの回数だけ決めておきます。学習率は、勾配降下法などで使うものと同じ概念です。
iters_num = 5000  # 繰り返しの回数
learning_rate = 0.1 # 学習率
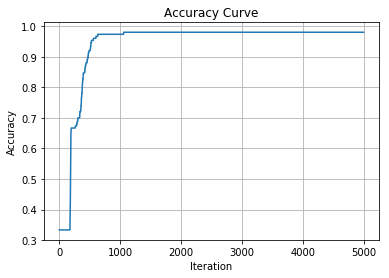
順方向の計算(前向き計算)を行なって予測値を出し、実際の値との誤差を算出し、逆方向の計算(後ろ向き計算)を行なって各種パラメータを微調整していくという流れを繰り返します。ただし、実際の計算では1個1個のサンプルに対して順方向・逆方向の計算をするのではなく、「バッチ」と呼ばれる単位でまとめて計算します。そのために行列演算を使います。
accuracy_curve = []
for i in range(iters_num):
    Y_pred = net.forward_propagation(X) # 順方向の計算
    grad = net.backward_propagation(X, Y_pred, Y) # 逆方向の計算
    net.W1 -= learning_rate * grad.W1 # 隠れ層の重み行列W1を微修正
    net.b1 -= learning_rate * grad.b1 # 隠れ層のバイアスb1を微修正
    net.W2 -= learning_rate * grad.W2 # 出力層の重み行列W2を微修正
    net.b2 -= learning_rate * grad.b2 # 出力層のバイアスb2を微修正
    accuracy_curve.append(net.score(X, Y)) # 正解率の履歴を記録
    net.loss_curve_.append(net.loss(X, Y)) # 誤差の履歴を記録
正解率
net.score(X,Y)
0.98
%matplotlib inline
import matplotlib.pyplot as plt
plt.title("Accuracy Curve")
plt.plot(accuracy_curve)
plt.xlabel("Iteration")
plt.ylabel("Accuracy")
plt.grid()
plt.show()
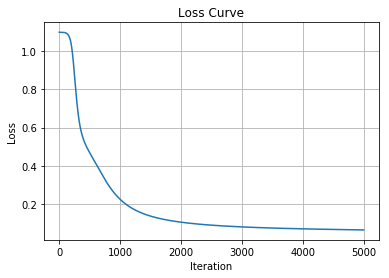
損失(誤差)
net.loss(X,Y)
0.06510128095476939
%matplotlib inline
import matplotlib.pyplot as plt
plt.title("Loss Curve")
plt.plot(net.loss_curve_)
plt.xlabel("Iteration")
plt.ylabel("Loss")
plt.grid()
plt.show()
学習済みの重み行列とバイアス
簡単なネットワーク構造であれば、学習済みの重み行列を見るとその意味について何らかの示唆が得られることがあります。例としてはこちらの「収束例」を見てください。ですがもっと層が深くなったりすると、もはや解釈不能になってしまいます。
net.W1
array([[ 1.75773083, -0.51518424, -1.27918798],
       [ 1.73947899, -1.74152022, -1.53733161],
       [-2.6436301 ,  2.73684801,  2.09798004],
       [-3.16874639,  1.30283781,  2.40213952]])
net.b1
array([ 1.93251018, -0.33044046, -1.44066299])
net.W2
array([[ 3.52793736,  2.00952545, -5.52639495],
       [-5.4866828 ,  3.5463848 ,  1.94412222],
       [-2.94702133, -1.64553748,  4.57965808]])
net.b2
array([ 1.79476641, -1.32993924, -0.46482716])
予測結果
学習済みの重み行列とバイアスを用いて順方向の計算を行うことで、既知のデータ・未知のデータに対する予測値を算出できます。
net.forward_propagation(X)
array([[9.89838688e-01, 1.01485881e-02, 1.27236547e-05],
       [9.88762250e-01, 1.12239218e-02, 1.38286276e-05],
       [9.89471490e-01, 1.05154049e-02, 1.31051691e-05],
       [9.88232680e-01, 1.17529506e-02, 1.43692525e-05],
       [9.89910932e-01, 1.00764188e-02, 1.26492384e-05],
       [9.89674961e-01, 1.03121466e-02, 1.28922736e-05],
       [9.89355530e-01, 1.06312436e-02, 1.32267515e-05],
       [9.89425542e-01, 1.05613080e-02, 1.31497377e-05],
       [9.87758239e-01, 1.22269079e-02, 1.48528401e-05],
       [9.88816856e-01, 1.11693727e-02, 1.37711819e-05],
       [9.89966857e-01, 1.00205525e-02, 1.25900857e-05],
       [9.88928482e-01, 1.10578587e-02, 1.36597320e-05],
       [9.88897767e-01, 1.10885431e-02, 1.36901738e-05],
       [9.89588566e-01, 1.03984471e-02, 1.29871247e-05],
       [9.90350690e-01, 9.63711894e-03, 1.21912159e-05],
       [9.90294753e-01, 9.69299771e-03, 1.22496608e-05],
       [9.90197222e-01, 9.79042638e-03, 1.23516946e-05],
       [9.89750885e-01, 1.02363002e-02, 1.28150619e-05],
       [9.89758816e-01, 1.02283800e-02, 1.28043710e-05],
       [9.89908626e-01, 1.00787223e-02, 1.26516880e-05],
       [9.88985249e-01, 1.10011545e-02, 1.35968166e-05],
       [9.89709486e-01, 1.02776552e-02, 1.28584465e-05],
       [9.90232195e-01, 9.75548810e-03, 1.23164375e-05],
       [9.87258266e-01, 1.27263905e-02, 1.53437798e-05],
       [9.86729936e-01, 1.32542019e-02, 1.58618563e-05],
       [9.87564033e-01, 1.24209348e-02, 1.50325853e-05],
       [9.88650837e-01, 1.13352196e-02, 1.39435354e-05],
       [9.89681593e-01, 1.03055221e-02, 1.28853018e-05],
       [9.89756545e-01, 1.02306468e-02, 1.28081420e-05],
       [9.88114645e-01, 1.18708687e-02, 1.44858812e-05],
       [9.87780616e-01, 1.22045639e-02, 1.48196293e-05],
       [9.89365756e-01, 1.06210337e-02, 1.32104884e-05],
       [9.90219145e-01, 9.76852638e-03, 1.23284077e-05],
       [9.90307359e-01, 9.68040422e-03, 1.22364782e-05],
       [9.88573133e-01, 1.14128470e-02, 1.40201707e-05],
       [9.89821630e-01, 1.01656279e-02, 1.27419876e-05],
       [9.90076029e-01, 9.91149426e-03, 1.24769325e-05],
       [9.89952755e-01, 1.00346396e-02, 1.26057205e-05],
       [9.88789651e-01, 1.11965404e-02, 1.38084367e-05],
       [9.89479109e-01, 1.05077972e-02, 1.30941237e-05],
       [9.89893541e-01, 1.00937906e-02, 1.26680027e-05],
       [9.83292420e-01, 1.66883565e-02, 1.92235182e-05],
       [9.89299833e-01, 1.06868822e-02, 1.32851116e-05],
       [9.88475531e-01, 1.15103427e-02, 1.41265989e-05],
       [9.88505202e-01, 1.14807099e-02, 1.40885515e-05],
       [9.88399117e-01, 1.15866826e-02, 1.42006414e-05],
       [9.89822874e-01, 1.01643859e-02, 1.27397481e-05],
       [9.89074744e-01, 1.09117427e-02, 1.35133595e-05],
       [9.89940646e-01, 1.00467366e-02, 1.26174513e-05],
       [9.89526227e-01, 1.04607266e-02, 1.30464482e-05],
       [1.03611303e-02, 9.88901777e-01, 7.37093104e-04],
       [8.67966951e-03, 9.89516055e-01, 1.80427511e-03],
       [7.30789009e-03, 9.89221422e-01, 3.47068803e-03],
       [4.94508033e-03, 9.72072552e-01, 2.29823676e-02],
       [6.06409912e-03, 9.85422521e-01, 8.51338022e-03],
       [4.67410268e-03, 9.67600130e-01, 2.77257670e-02],
       [6.12981781e-03, 9.85356951e-01, 8.51323154e-03],
       [1.33905510e-02, 9.85795523e-01, 8.13926514e-04],
       [8.85506778e-03, 9.89664158e-01, 1.48077453e-03],
       [5.68593236e-03, 9.79604469e-01, 1.47095990e-02],
       [7.98751135e-03, 9.88664138e-01, 3.34835055e-03],
       [7.61485426e-03, 9.88745212e-01, 3.63993345e-03],
       [9.56937435e-03, 9.89288805e-01, 1.14182028e-03],
       [4.70635602e-03, 9.69132027e-01, 2.61616170e-02],
       [1.42999360e-02, 9.85092598e-01, 6.07465669e-04],
       [1.08829903e-02, 9.88436896e-01, 6.80113747e-04],
       [3.38929661e-03, 9.05634618e-01, 9.09760849e-02],
       [1.06470000e-02, 9.88531267e-01, 8.21733323e-04],
       [2.01163336e-03, 7.21057711e-01, 2.76930656e-01],
       [9.51798695e-03, 9.89083325e-01, 1.39868775e-03],
       [9.10098394e-04, 4.20892068e-01, 5.78197833e-01],
       [1.09438136e-02, 9.88250192e-01, 8.05994484e-04],
       [1.07368499e-03, 4.77997173e-01, 5.20929142e-01],
       [6.02429297e-03, 9.85273943e-01, 8.70176383e-03],
       [1.02378368e-02, 9.88879530e-01, 8.82632785e-04],
       [1.00400487e-02, 9.89030982e-01, 9.28969712e-04],
       [6.87247465e-03, 9.88544039e-01, 4.58348674e-03],
       [3.10433838e-03, 8.85292812e-01, 1.11602850e-01],
       [4.89143745e-03, 9.72080648e-01, 2.30279143e-02],
       [1.65504095e-02, 9.83036475e-01, 4.13115777e-04],
       [9.33527684e-03, 9.89091199e-01, 1.57352431e-03],
       [1.11903024e-02, 9.87980675e-01, 8.29022496e-04],
       [1.08055180e-02, 9.88295223e-01, 8.99258839e-04],
       [9.14364208e-05, 6.83472017e-02, 9.31561362e-01],
       [2.33159279e-03, 7.74644533e-01, 2.23023874e-01],
       [6.91168330e-03, 9.87641432e-01, 5.44688474e-03],
       [7.92509184e-03, 9.89590769e-01, 2.48413952e-03],
       [5.73381267e-03, 9.83424335e-01, 1.08418521e-02],
       [8.97287765e-03, 9.89101137e-01, 1.92598573e-03],
       [6.15176895e-03, 9.84602565e-01, 9.24566570e-03],
       [4.28319021e-03, 9.56325834e-01, 3.93909756e-02],
       [6.10732447e-03, 9.85358703e-01, 8.53397252e-03],
       [9.27847618e-03, 9.89224368e-01, 1.49715617e-03],
       [1.28831339e-02, 9.86295149e-01, 8.21716800e-04],
       [6.12670229e-03, 9.84769468e-01, 9.10382941e-03],
       [9.46088609e-03, 9.89116458e-01, 1.42265612e-03],
       [7.89866824e-03, 9.89068952e-01, 3.03238013e-03],
       [9.42644300e-03, 9.89298685e-01, 1.27487159e-03],
       [2.42935361e-02, 9.75236351e-01, 4.70112627e-04],
       [8.18918605e-03, 9.89173926e-01, 2.63688758e-03],
       [3.68437903e-06, 4.82190123e-03, 9.95174414e-01],
       [1.10708853e-05, 1.19788810e-02, 9.88010048e-01],
       [1.11717972e-05, 1.20858060e-02, 9.87903022e-01],
       [1.38565918e-05, 1.44377465e-02, 9.85548397e-01],
       [5.22287456e-06, 6.43744013e-03, 9.93557337e-01],
       [5.32815103e-06, 6.54757701e-03, 9.93447095e-01],
       [1.62121904e-05, 1.63691562e-02, 9.83614632e-01],
       [1.15223824e-05, 1.24039317e-02, 9.87584546e-01],
       [7.76460362e-06, 8.94346177e-03, 9.91048774e-01],
       [7.22003392e-06, 8.41707044e-03, 9.91575710e-01],
       [3.35626915e-04, 1.95676053e-01, 8.03988320e-01],
       [2.04023708e-05, 1.98781972e-02, 9.80101400e-01],
       [2.28981561e-05, 2.18697950e-02, 9.78107307e-01],
       [6.77202850e-06, 7.97593222e-03, 9.92017296e-01],
       [4.61623907e-06, 5.80743423e-03, 9.94187950e-01],
       [1.32464060e-05, 1.38928827e-02, 9.86093871e-01],
       [4.90539553e-05, 4.10085231e-02, 9.58942423e-01],
       [1.18473700e-05, 1.26892539e-02, 9.87298899e-01],
       [3.37201132e-06, 4.48197645e-03, 9.95514652e-01],
       [4.42613253e-05, 3.76818461e-02, 9.62273893e-01],
       [1.04776218e-05, 1.14550549e-02, 9.88534467e-01],
       [1.18840063e-05, 1.26880022e-02, 9.87300114e-01],
       [4.97304911e-06, 6.18426016e-03, 9.93810767e-01],
       [2.59326084e-04, 1.59338162e-01, 8.40402512e-01],
       [1.83401455e-05, 1.82010198e-02, 9.81780640e-01],
       [8.06344231e-05, 6.17800253e-02, 9.38139340e-01],
       [5.33632027e-04, 2.81765701e-01, 7.17700667e-01],
       [4.45036115e-04, 2.44354392e-01, 7.55200572e-01],
       [6.10251034e-06, 7.32277250e-03, 9.92671125e-01],
       [5.91994872e-04, 3.07028578e-01, 6.92379427e-01],
       [1.46669484e-05, 1.51466201e-02, 9.84838713e-01],
       [3.64858334e-04, 2.10056928e-01, 7.89578214e-01],
       [5.20309030e-06, 6.41690053e-03, 9.93577896e-01],
       [1.11161421e-03, 4.89959211e-01, 5.08929175e-01],
       [2.26774256e-05, 2.17079992e-02, 9.78269323e-01],
       [9.74308311e-06, 1.07937665e-02, 9.89196490e-01],
       [6.14783340e-06, 7.36348227e-03, 9.92630370e-01],
       [5.03645473e-05, 4.18967635e-02, 9.58052872e-01],
       [5.67759524e-04, 2.95082606e-01, 7.04349635e-01],
       [7.40362565e-05, 5.75143817e-02, 9.42411582e-01],
       [6.60640693e-06, 7.81850534e-03, 9.92174888e-01],
       [1.10376344e-04, 7.96666123e-02, 9.20223011e-01],
       [1.10708853e-05, 1.19788810e-02, 9.88010048e-01],
       [6.09442183e-06, 7.31511313e-03, 9.92678792e-01],
       [5.85034481e-06, 7.06959310e-03, 9.92924557e-01],
       [2.30182811e-05, 2.19444622e-02, 9.78032520e-01],
       [3.11075667e-05, 2.81522836e-02, 9.71816609e-01],
       [7.06686261e-05, 5.53125080e-02, 9.44616823e-01],
       [1.02982936e-05, 1.12786765e-02, 9.88711025e-01],
       [5.33929194e-05, 4.38812697e-02, 9.56065337e-01]])
np.argmax(net.forward_propagation(X), axis=1)
array([0, 0, 0, 0, 0, 0, 0, 0, 0, 0, 0, 0, 0, 0, 0, 0, 0, 0, 0, 0, 0, 0,
       0, 0, 0, 0, 0, 0, 0, 0, 0, 0, 0, 0, 0, 0, 0, 0, 0, 0, 0, 0, 0, 0,
       0, 0, 0, 0, 0, 0, 1, 1, 1, 1, 1, 1, 1, 1, 1, 1, 1, 1, 1, 1, 1, 1,
       1, 1, 1, 1, 2, 1, 2, 1, 1, 1, 1, 1, 1, 1, 1, 1, 1, 2, 1, 1, 1, 1,
       1, 1, 1, 1, 1, 1, 1, 1, 1, 1, 1, 1, 2, 2, 2, 2, 2, 2, 2, 2, 2, 2,
       2, 2, 2, 2, 2, 2, 2, 2, 2, 2, 2, 2, 2, 2, 2, 2, 2, 2, 2, 2, 2, 2,
       2, 2, 2, 2, 2, 2, 2, 2, 2, 2, 2, 2, 2, 2, 2, 2, 2, 2])
課題
- scikit-learn を使う問題
上で解説した交差検定とグリッドサーチを組み合わせることによって、教師データではなくテストデータの予測性能が最高になるパラメーターを見つけてください。そのためには、以下の1.2.の手順を踏むといいでしょう。
-
まずは、交差検定を1回ずつ行なうコードを書いてください。
-
それができたら、交差検定は5回ずつ行い、その平均値をそのモデルの平均値とするようなコードを書いてください。こちらを参考にするとヒントが得られるかもしれません。
- scikit-learn を使わない問題
上で示した MyMLP クラスは、いちおうきちんと動きますが、使い心地がいいとは言えません。そこで、scikit-learn のMLPクラスを真似して、.fit(X,Y) を使えば学習し、.predict(X) を使えば予測値を算出し、.predict_proba(X) を使えば予測に対する自信を算出できるようにMyMLPクラスを改良してください。
補足
課題を作成するにあたって、clf.predict()の出力が違ってしまうという報告がありましたので調査してみました。結論は、目的変数をどんな形にするかによって、scikit-learnは柔軟に対応してくれているようです。詳しくはこちらをご参照ください。今回の課題では、そこまでの「使い心地」は求めませんので、どちらかの出力ができれば大丈夫です。

