- グラフ理論の基礎
- matplotlibを使ったアニメーション作成
をここでは取り扱います。
グラフ理論の基礎
グラフ理論の基礎
https://qiita.com/maskot1977/items/e1819b7a1053eb9f7d61
という記事を過去に書きまして、たくさんの方から「いいね」をいただいておりますが、今回はその内容をアニメーションで分かりやすくしたいと思います。
matploblib を用いたアニメーション
簡単なアニメーションは次のようにして描けます。
# -*- coding: UTF-8 -*-
import math
import matplotlib.pyplot as plt
import matplotlib.animation as animation
from IPython.display import HTML

fig = plt.figure()

ims = [] # 動画=静止画の集合を格納するリスト
for i in range(360):
    rad = math.radians(i)
    x1, y1 = math.cos(rad), math.sin(rad)
    x2, y2 = math.cos(rad * 2), math.sin(rad * 2)
    im = plt.scatter(x1, y1) # 静止画の部品1(リスト型ではないもの)
    im2 = plt.scatter(x2, y2) # 静止画の部品2(リスト型ではないもの)
    im3 = plt.plot([x1, x2], [y1, y2]) # 静止画の部品3(リスト型のもの)
    image = [im, im2] + im3 # 1つのリストが1つの静止画を表す
    ims.append(image) # 静止画を1つ追加する

# 動画に変換する
ani = animation.ArtistAnimation(fig, ims, interval=10, repeat_delay=1000)

ani.save("Animation1.gif", writer='pillow') # gif ファイルとして保存
HTML(ani.to_jshtml()) # HTML上で表示
※ アニメーションが終了し停止してしまった場合、画像をクリックするともう一度動かせると思います。
日本の県庁所在地データ
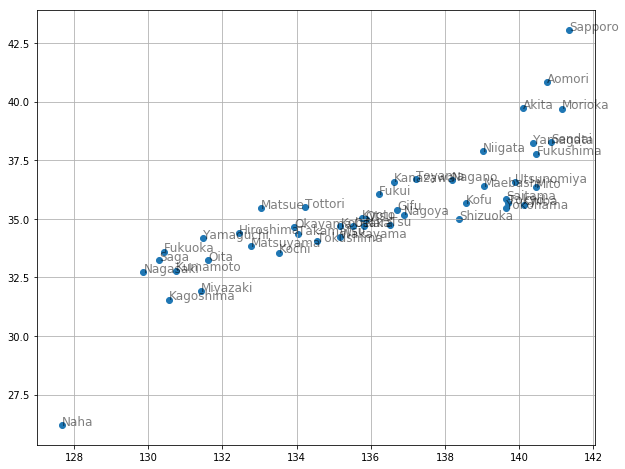
グラフ理論の基礎と同じデータを使います。県庁所在地の都市の座標データ(緯度・経度)が書かれています。県庁所在地の都市を「頂点」、都市と都市を結ぶ直線を「辺」と呼ぶことにします。辺で結ばれている都市は「隣接している」といいます。
import urllib.request
url = 'https://raw.githubusercontent.com/maskot1977/ipython_notebook/master/toydata/location.txt'
urllib.request.urlretrieve(url, 'location.txt') # データのダウンロード
('location.txt', <http.client.HTTPMessage at 0x11c9c2320>)
グラフ理論の基礎では使わなかった pandas を用いて読み込んでみます。
import pandas as pd
japan = pd.read_csv('location.txt')
japan
| Town | Longitude | Latitude | |
|---|---|---|---|
| 0 | Sapporo | 43.06417 | 141.34694 |
| 1 | Aomori | 40.82444 | 140.74000 |
| 2 | Morioka | 39.70361 | 141.15250 |
| 3 | Sendai | 38.26889 | 140.87194 |
| 4 | Akita | 39.71861 | 140.10250 |
| 5 | Yamagata | 38.24056 | 140.36333 |
| ... | ... | ... | ... |
| 45 | Kagoshima | 31.56028 | 130.55806 |
| 46 | Naha | 26.21250 | 127.68111 |
図示します。
%matplotlib inline
import matplotlib.pyplot as plt
plt.figure(figsize=(10, 8))
plt.scatter(japan['Latitude'], japan['Longitude'])
for city, x, y in zip(japan['Town'], japan['Latitude'], japan['Longitude']):
    plt.text(x, y, city, alpha=0.5, size=12)
plt.grid()
以上のデータを使って、グラフ理論の基礎アルゴリズムである深さ優先探索・幅優先探索・最良優先探索のアニメーションを作ってみましょう。
距離行列
グラフ理論の基礎では使いませんでしたが、scipyを使えば距離行列(頂点間の距離)は次のようにして求められます。
import numpy as np
from scipy.spatial import distance

mat = japan[['Latitude', 'Longitude']].values
dist_mat = distance.cdist(mat, mat, metric='euclidean') # ユークリッド距離
2点間の直線を引くために座標を得る関数
グラフの描画で2点間の直線を引くため、辺(頂点の組)の組から座標を求める関数を自作します。
def get_edges(routes):
    edges = []
    for route in routes:
        if len(route) == 2:
            town1, y1, x1 = [value for value in japan.values][route[0]]
            town2, y2, x2 = [value for value in japan.values][route[1]]
            edges.append([[x1, x2], [y1, y2]])
    return edges
使用例はこのような感じです。
get_edges([[1, 2], [3, 4], [5, 6]])
[[[140.74, 141.1525], [40.82444, 39.70361]],
 [[140.87194, 140.1025], [38.26889, 39.71861]],
 [[140.36333, 140.46778], [38.240559999999995, 37.75]]]
深さ優先探索
それでは、グラフ探索アルゴリズムの最初として、深さ優先探索をやります
隣接リストを得る関数1
グラフ探索では「隣接リスト」(どの頂点からどの頂点に行けるか)の作り方が非常に大切なわけですが、 「ある距離(threshold)以下の頂点間に辺を結ぶ」 という方針で行ってみたいと思います。グラフ理論の基礎では使わなかったnumpyと距離行列を使えば次のようにして求められます。
def neighbor(town, dist_mat=dist_mat, threshold=1): # 隣接リストを得る関数1
    return [x[0] for x in enumerate(np.where(dist_mat[town] <= threshold, True, False)) if x[1]]
使用例はこんな感じ。
neighbor(12) # 東京から距離1以内の都市は?
[7, 8, 9, 10, 11, 12, 13]
グラフ探索関数1
グラフ理論の基礎では while 文を使ってグラフ探索問題を解いていましたが、ここでは、ステップごとに途中経過を図示したいため、探索の1ステップを進めるための関数を以下のように定義しました。
def traverse(i=0): # 深さ優先探索の1ステップ
    if len(stack) != 0: # スタックが空でなければ
        next_town, current_town = stack.pop() # 次の経路(現在地と次の都市)を得る
        current_direction = [[next_town, current_town]] # 描画用
        if next_town not in visited_towns: # 次の都市が未訪問ならば
            used_routes.append([next_town, current_town]) # その経路を登録
            visited_towns.append(next_town) # 訪問済みにする
            for nei in neighbor(next_town): # 訪問した都市に隣接する都市を1個ずつ取り出す
                if nei not in visited_towns: # 未訪問ならば
                    stack.append([nei, next_town]) # 経路をスタックに入れる
    return current_direction # 描画用
深さ優先探索アニメーション1
では、アニメーション化しましょう。
# -*- coding: UTF-8 -*-
import math
import matplotlib.pyplot as plt
import matplotlib.animation as animation
from IPython.display import HTML

fig = plt.figure(figsize=(10, 8))

stack = [[12, 12]] # 始点は東京
visited_towns = [] # 訪問済みの都市を蓄える配列
used_routes = [] # 実際に使用した経路を蓄える配列
current_direction = [] # 現在チェック中の経路
ims = [] # 静止画を蓄える配列
i = 0
while len(stack) > 0: # スタックが空でなければ
    if i != 0: # 最初の1回は初期値を表示するため探索を進めない
        current_direction = traverse() # 探索を1ステップ進める
    image = [] # 1つの静止画に書き込む部品を蓄える配列
    for edge in get_edges(stack): # 赤い線は stack に入っている「候補」の経路
        image += plt.plot(edge[0], edge[1], 'r', alpha=0.5)

    for edge in get_edges(current_direction): # 青い線は 現在チェック中の経路
        image += plt.plot(edge[0], edge[1], 'b', lw=5, alpha=0.5)

    for edge in get_edges(used_routes): # 黒い線は 使用済みの経路
        image += plt.plot(edge[0], edge[1], 'k', lw=2)

    for city, x, y in zip(japan['Town'], japan['Latitude'], japan['Longitude']):
        image.append(plt.text(x, y, city, alpha=0.5, size=12)) # 都市名を表示

    if len(current_direction) > 0:
        current_town = current_direction[0][0]
        image += plt.plot(japan.iloc[current_town, :]['Latitude'],
                          japan.iloc[current_town, :]['Longitude'],
                          markersize=20, marker='o') # 丸は 現在チェック中の都市
    ims.append(image) # 静止画を1つ蓄える
    i += 1

# 動画に変換
ani = animation.ArtistAnimation(fig, ims, interval=500, repeat_delay=1000)

ani.save("Animation2.gif", writer='pillow') # gifファイルとして保存
HTML(ani.to_jshtml()) # HTML上で表示
深さ優先探索アニメーション1

※ アニメーションが終了し停止してしまった場合、画像をクリックするともう一度動かせると思います。
隣接リストを得る関数2
上の深さ優先探索では、「最後にスタックに入った都市」が次の行き先候補になります。ある都市に移動すると、それに隣接する(複数の)都市がスタックに入ります。このとき、スタックに入れる順序を考慮することで、同じ深さ優先探索でも挙動が変わります。距離の近い都市を優先的に行き先候補に選ぶように修正しましょう。
import numpy as np
def neighbor(town, dist_mat=dist_mat, threshold=1): # 隣接リストを得る関数2
    return np.argsort(dist_mat[town])[1:np.where(dist_mat[town] <= threshold, 1, 0).sum()][::-1]
深さ優先探索アニメーション2
以下のコードは、先ほどの「深さ優先探索アニメーション1」と同一です(保存する動画のファイル名が違うだけです)。 関数 neighbor を変えると、挙動がどう変わるか確認してみましょう。
# -*- coding: UTF-8 -*-
# -*- coding: UTF-8 -*-
import math
import matplotlib.pyplot as plt
import matplotlib.animation as animation
from IPython.display import HTML

fig = plt.figure(figsize=(10, 8))

stack = [[12, 12]] # 始点は東京
visited_towns = [] # 訪問済みの都市を蓄える配列
used_routes = [] # 実際に使用した経路を蓄える配列
current_direction = [] # 現在チェック中の経路
ims = [] # 静止画を蓄える配列
i = 0
while len(stack) > 0: # スタックが空でなければ
    if i != 0: # 最初の1回は初期値を表示するため探索を進めない
        if stack[0] != []: # 最後の表示のときも探索を進めない
            current_direction = traverse() # 探索を1ステップ進める
    image = [] # 1つの静止画に書き込む部品を蓄える配列
    for edge in get_edges(stack): # 赤い線は stack に入っている「候補」の経路
        image += plt.plot(edge[0], edge[1], 'r', alpha=0.5)

    for edge in get_edges(current_direction): # 青い線は 現在チェック中の経路
        image += plt.plot(edge[0], edge[1], 'b', lw=5, alpha=0.5)

    for edge in get_edges(used_routes): # 黒い線は 使用済みの経路
        image += plt.plot(edge[0], edge[1], 'k', lw=2)

    for city, x, y in zip(japan['Town'], japan['Latitude'], japan['Longitude']):
        image.append(plt.text(x, y, city, alpha=0.5, size=12)) # 都市名を表示

    if len(current_direction) > 0:
        current_town = current_direction[0][0]
        image += plt.plot(japan.iloc[current_town, :]['Latitude'],
                          japan.iloc[current_town, :]['Longitude'],
                          markersize=20, marker='o') # 丸は 現在チェック中の都市
    ims.append(image) # 静止画を1つ蓄える

    if len(stack) == 0: # 最後の表示用
        current_direction = []
        stack.append([])
    elif stack[0] == []: # 最後の脱出用
        break
    i += 1

# 動画に変換
ani = animation.ArtistAnimation(fig, ims, interval=500, repeat_delay=1000)

ani.save("Animation3.gif", writer='pillow') # gifファイルとして保存
HTML(ani.to_jshtml()) # HTML上で表示
深さ優先探索アニメーション2

※ アニメーションが終了し停止してしまった場合、画像をクリックするともう一度動かせると思います。
幅優先探索
次に、幅優先探索をしてみましょう。基本アルゴリズムはほぼ同一で、スタック(先入れ後出し)をキュー(待ち行列:先入れ先出し)にするだけです。
グラフ探索関数2
関数 traverse を書き換えます。書き換える部分は「変更点」として示した1点だけです。スタックとして用いていたリストがキューに変わるので変数名 stack を変えたいところですが、そうすると書き換える部分が多くなってしまうので、stack はそのままにしときましょう。
def traverse(i=0): # 幅優先探索の1ステップ
    if len(stack) != 0:
        next_town, current_town = stack.pop(0) # 変更点
        current_direction = [[next_town, current_town]]
        if next_town not in visited_towns:
            used_routes.append([next_town, current_town])
            visited_towns.append(next_town)
            for nei in neighbor(next_town):
                if nei not in visited_towns:
                    stack.append([nei, next_town])
    return current_direction
隣接リストを得る関数3
隣接リストを得る関数も書き換えますが、基本的には前のものとほとんど同一です。スタックがキューになるので、順番をひっくり返すだけです。
import numpy as np
def neighbor(town, dist_mat=dist_mat, threshold=1): # 隣接リストを得る関数3
    return np.argsort(dist_mat[town])[1:np.where(dist_mat[town] <= threshold, 1, 0).sum()] # 末尾だけ変更
幅優先探索アニメーション
以下のコードも、先ほどの「深さ優先探索アニメーション1」「深さ優先探索アニメーション2」と同一です(保存する動画のファイル名が違うだけです)。 関数 traverse を変えると、挙動がどう変わるか確認してみましょう。
# -*- coding: UTF-8 -*-
import math
import matplotlib.pyplot as plt
import matplotlib.animation as animation
from IPython.display import HTML

fig = plt.figure(figsize=(10, 8))

stack = [[12, 12]] # 始点は東京
visited_towns = [] # 訪問済みの都市を蓄える配列
used_routes = [] # 実際に使用した経路を蓄える配列
current_direction = [] # 現在チェック中の経路
ims = [] # 静止画を蓄える配列
i = 0
while len(stack) > 0: # スタックが空でなければ
    if i != 0: # 最初の1回は初期値を表示するため探索を進めない
        if stack[0] != []: # 最後の表示のときも探索を進めない
            current_direction = traverse() # 探索を1ステップ進める
    image = [] # 1つの静止画に書き込む部品を蓄える配列
    for edge in get_edges(stack): # 赤い線は stack に入っている「候補」の経路
        image += plt.plot(edge[0], edge[1], 'r', alpha=0.5)

    for edge in get_edges(current_direction): # 青い線は 現在チェック中の経路
        image += plt.plot(edge[0], edge[1], 'b', lw=5, alpha=0.5)

    for edge in get_edges(used_routes): # 黒い線は 使用済みの経路
        image += plt.plot(edge[0], edge[1], 'k', lw=2)

    for city, x, y in zip(japan['Town'], japan['Latitude'], japan['Longitude']):
        image.append(plt.text(x, y, city, alpha=0.5, size=12)) # 都市名を表示

    if len(current_direction) > 0:
        current_town = current_direction[0][0]
        image += plt.plot(japan.iloc[current_town, :]['Latitude'],
                          japan.iloc[current_town, :]['Longitude'],
                          markersize=20, marker='o') # 丸は 現在チェック中の都市
    ims.append(image) # 静止画を1つ蓄える

    if len(stack) == 0: # 最後の表示用
        current_direction = []
        stack.append([])
    elif stack[0] == []: # 最後の脱出用
        break
    i += 1

# 動画に変換
ani = animation.ArtistAnimation(fig, ims, interval=500, repeat_delay=1000)

ani.save("Animation4.gif", writer='pillow') # gifファイルとして保存
HTML(ani.to_jshtml()) # HTML上で表示
幅優先探索アニメーション
※ アニメーションが終了し停止してしまった場合、画像をクリックするともう一度動かせると思います。
最良優先探索と最小木
最後に、最良優先探索 です。上2つの探索では、スタック(またはキュー)に追加するときに、距離の短い都市が優先的に取り出されるように追加しました。最良優先探索では、追加された後のスタック(実際はキュー)全体をソートして、その中から距離の短い都市を優先的に取り出すようにします。その結果として「最小木」ができあがります。
スタックを並び直す関数
これまでとの変更点は、スタック全体をソートし直すだけです。
def sort_stack(stack):
    return [stack[i] for i in np.argsort([dist_mat[edge[0]][edge[1]] for edge in stack])]
最良優先探索アニメーション
以下のコードは、今までのと基本的に同じです。変更点は関数 sort_stack が追加されたことと、動画を保存するファイル名を変えただけです。
# -*- coding: UTF-8 -*-
import math
import matplotlib.pyplot as plt
import matplotlib.animation as animation
from IPython.display import HTML

fig = plt.figure(figsize=(10, 8))

stack = [[12, 12]] # 始点は東京
visited_towns = [] # 訪問済みの都市を蓄える配列
used_routes = [] # 実際に使用した経路を蓄える配列
current_direction = [] # 現在チェック中の経路
ims = [] # 静止画を蓄える配列
i = 0
while len(stack) > 0: # スタックが空でなければ
    if i != 0: # 最初の1回は初期値を表示するため探索を進めない
        if stack[0] != []: # 最後の表示のときも探索を進めない
            stack = sort_stack(stack) # 最良優先探索のためにスタックをソート
            current_direction = traverse() # 探索を1ステップ進める
    image = [] # 1つの静止画に書き込む部品を蓄える配列
    for edge in get_edges(stack): # 赤い線は stack に入っている「候補」の経路
        image += plt.plot(edge[0], edge[1], 'r', alpha=0.5)

    for edge in get_edges(current_direction): # 青い線は 現在チェック中の経路
        image += plt.plot(edge[0], edge[1], 'b', lw=5, alpha=0.5)

    for edge in get_edges(used_routes): # 黒い線は 使用済みの経路
        image += plt.plot(edge[0], edge[1], 'k', lw=2)

    for city, x, y in zip(japan['Town'], japan['Latitude'], japan['Longitude']):
        image.append(plt.text(x, y, city, alpha=0.5, size=12)) # 都市名を表示

    if len(current_direction) > 0:
        current_town = current_direction[0][0]
        image += plt.plot(japan.iloc[current_town, :]['Latitude'],
                          japan.iloc[current_town, :]['Longitude'],
                          markersize=20, marker='o') # 丸は 現在チェック中の都市
    ims.append(image) # 静止画を1つ蓄える

    if len(stack) == 0: # 最後の表示用
        current_direction = []
        stack.append([])
    elif stack[0] == []: # 最後の脱出用
        break
    i += 1

# 動画に変換
ani = animation.ArtistAnimation(fig, ims, interval=500, repeat_delay=1000)

ani.save("Animation5.gif", writer='pillow') # gifファイルとして保存
HTML(ani.to_jshtml()) # HTML上で表示
最良優先探索アニメーション

※ アニメーションが終了し停止してしまった場合、画像をクリックするともう一度動かせると思います。