さてさて前回の続きです。前回はSpring Bootで構造的なJSON形式のログを出すためのログ制御をやりましたが、今回は、そのJSONログをFluent Bitで振り分ける方法についてです。
前回の記事では
-
FWが出力する、サーバエラーなどすぐに検知したい例外
- →
"appType": "FW"かつ"level": "ERROR"なログ のこと
- →
-
FWが出力する、クライアント起因のエラーなど、検知は不要だけど記録しておきたい例外
- →
"appType": "FW"かつ"level": "WARN"なログ のこと
- →
-
FWが出力する、全てのリクエストに対する、Request/Responseのログ
- →
"appType": "FW"かつ"logType": "request_response"なログのこと
- →
-
アプリが自由に出すログ
- → その他のログ
と各種ログをJSON形式で出力するまでをやりました。これらはAWS上では CloudWatch Logsに転送して監視に検知してもらいたかったり、とりあえず安価なS3に転送して種別ごとに保存すればよかったりしますが、その転送処理は下記の通りFluent Bitの役割です。
AWS環境でのシステム構成
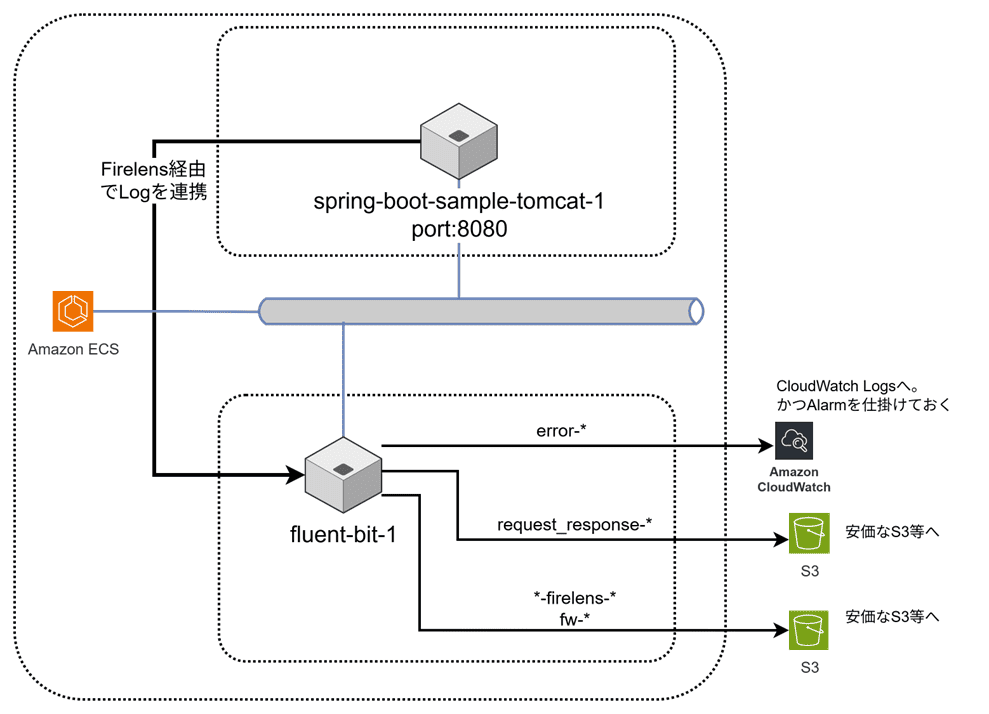
今回はこのあたりのお話です。Fluent Bit回の最終回です。
概要
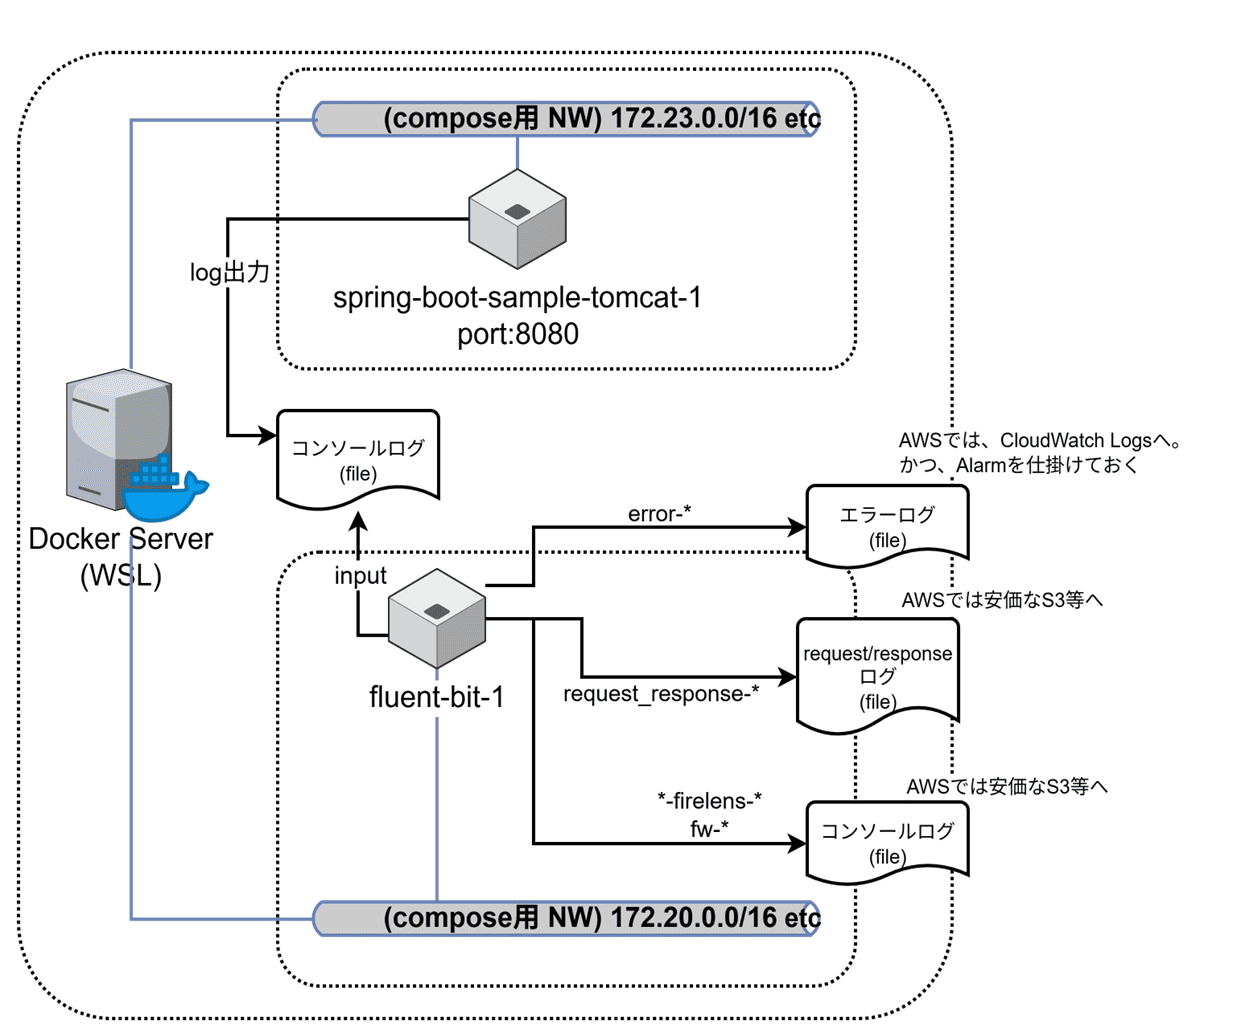
今回もまずはローカル環境で疎通するので、ログの振り分け先はローカル環境のそれぞれのファイルとします。
ローカル環境でのシステム構成
前提
- 前回記事の続きなので、前回記事を読んでいる方。
ソース
前回作業した環境をそのまま使います。
Fluent Bitで振り分けるには
いままでのログ内容も踏まえて整理すると
- FWが出力する、サーバエラーなどすぐに検知したい例外
- →
"appType": "FW"かつ"level": "ERROR"なログ のこと - ローカルでは「エラーログ」へ出力。本来は、CloudWatch Logsへ転送して、監視に検知してもらいたい
- →
- FWが出力する、クライアント起因のエラーなど、検知は不要だけど記録しておきたい例外
- →
"appType": "FW"かつ"level": "WARN"なログ のこと - ローカルではFluent Bitのコンソールへ出力。本来は、安価なS3などに保存。
- →
- FWが出力する、全てのリクエストに対する、Request/Responseのログ
- →
"appType": "FW"かつ"logType": "request_response"なログのこと - ローカルではリクエスト/レスポンス用ログへ出力。本来は、安価なS3などに保存。
- →
- アプリが自由に出すログ
- → その他のログ
- ローカルではFluent Bitのコンソールへ出力。本来は、安価なS3などに保存。
などになります。それを実現するためにFluent Bitで下記のような処理を組んでみました。
- FILTER処理
-
"appType": "FW"なログはとりあえず、fw-$container_idにrewrite_tag -
fw-*のうち"level": "ERROR"なログはerror-$container_idにrewrite_tag -
fw-*のうち"logType": "request_response"なログは、request_response-$container_idにrewrite_tag
-
- OUTPUT処理
-
error-*なログは、エラーログへ。 -
request_response-*なログは、リクエスト/レスポンス用ログへ。 -
fw-*の残りのログ(WARNとかなログ)、*-firelens-*なログ(rewrite_tag されなかったログ) は、Fluent Bitのコンソールへ。
-
先日のソースはすでに上記の設定を反映済みなので、そのFILTER部、OUTPUT部を見てみましょう。
Fluent Bitの設定ファイル(fluent-bit-test.conf)
fluentbit/test/fluent-bit-test.confです。
まずはFILTER部。
# エラーログにタグ付け
# 2. appType=FW のログを fw-$container_id に振る
[FILTER]
    Name          rewrite_tag
    Match         *-firelens-*
    Rule          $appType ^FW$ fw-$container_id false

# 3. fw-$container_id タグに対して、level=ERROR のログを error-$container_id に振る
[FILTER]
    Name          rewrite_tag
    Match         fw-*
    Rule          $level ^ERROR$ error-$container_id false

# 4. fw-$container_id タグに対して、logType=request_response のログを request_response-$container_id に振る
[FILTER]
    Name          rewrite_tag
    Match         fw-*
    Rule          $logType ^request_response$ request_response-$container_id false
つづいてOUTPUT部。
# FWが出すERROR なログは下記フォルダ
[OUTPUT]
    Name file
    Match error-*
    Path /fluent-bit/etc/output_dir

# request/response ログは下記フォルダ
[OUTPUT]
    Name file
    Match request_response-*
    Path /fluent-bit/etc/output_dir

# WARNなエラーはその他と同じ
[OUTPUT]
    Name   stdout
    Match  fw-*
    # Format json_lines

# その他のログはコンソール
[OUTPUT]
    Name   stdout
    Match  *-firelens-*
    # Format json_lines
まあわりとそのままって感じです。ちなみに
[OUTPUT]
    Name file
    Match error-*
    Path /fluent-bit/etc/output_dir
この記述は正確には、/fluent-bit/etc/output_dirディレクトリに error-*というファイル名で出力されたりします。
やってみる
Docker Compose して、ログの振り分け結果を見てみます。起動手順はココも参考に。
参考) Fluent Bit編1。ローカルのDockerで疎通確認
前回の記事で、OncePerRequestFilter 側を有効にした環境での実行結果です。
$ curl "http://localhost:8080/echoLogger" -i
HTTP/1.1 200
X-Request-Id: 62bc6e62-a054-44e3-b129-74c42c10f0e3
vary: accept-encoding
Content-Type: text/plain;charset=UTF-8
Content-Length: 16
Date: Mon, 22 Sep 2025 05:15:59 GMT

Default Message.

$
$ curl "http://localhost:8080/clientException" -i
HTTP/1.1 400
X-Request-Id: a4c51a63-a7b9-47bf-8329-d3d64dd04d9b
vary: accept-encoding
Content-Type: application/json
Transfer-Encoding: chunked
Date: Mon, 22 Sep 2025 05:16:13 GMT
Connection: close

{"code":"BAD_REQUEST","message":"クライアント起因の例外が発生しました"}

$
$ curl "http://localhost:8080/serverException" -i
HTTP/1.1 503
X-Request-Id: 5a207715-03b7-4f60-980c-bcaf376266c0
vary: accept-encoding
Content-Type: application/json
Transfer-Encoding: chunked
Date: Mon, 22 Sep 2025 05:16:20 GMT
Connection: close

{"code":"SERVICE_UNAVAILABLE","message":"サーバ起因の例外が発生しました"}
$
3リクエスト投げてみました。Fluent Bitのコンソールは(整形しています)、
fluent-bit-1  | [4] -firelens-: [1758518735.235774209,
{
    "@timestamp"=>"2025-09-22T05:25:35.2354945Z",
    "@version"=>"1",
    "message"=>"Default Message.",
    "logger_name"=>"nu.mine.kino.web.EchoController",
    "thread_name"=>"http-nio-8080-exec-1",
    "level"=>"INFO",
    "level_value"=>20000,
    "requestId"=>"62bc6e62-a054-44e3-b129-74c42c10f0e3",
    "stream"=>"stdout",
    "time"=>"2025-09-22T05:25:35.235774209Z"
}
]

fluent-bit-1  | [0] fw-: [1758518746.197561869,
{
    "@timestamp"=>"2025-09-22T05:25:46.194349458Z",
    "@version"=>"1",
    "message"=>"クライアント起因の例外が発生しました",
    "logger_name"=>"nu.mine.kino.advice.GlobalExceptionHandler",
    "thread_name"=>"http-nio-8080-exec-2",
    "level"=>"WARN",
    "level_value"=>30000,
    "stack_trace"=>"略",
    "requestId"=>"a4c51a63-a7b9-47bf-8329-d3d64dd04d9b",
    "appType"=>"FW",
    "stream"=>"stdout",
    "time"=>"2025-09-22T05:25:46.197561869Z"
}
]
-firelens-の業務アプリが出力したログ、fw-のFWが出力したWARNなログがコンソールに出ています。
つづいてエラーログ、リクエスト/レスポンス用のログ、などはこちら。
$ ls -lrt  fluentbit/test/output_dir/
total 12
-rw-r--r-- 1 root root 3004 Sep 22 14:25 request_response-
-rw-r--r-- 1 root root 6228 Sep 22 14:25 error-
2ファイルちゃんと出ています。
まずはエラーログは(整形しています)
$ cat fluentbit/test/output_dir/error-
error-: [1758518752.006094854,
{
    "@timestamp": "2025-09-22T05:25:52.004439601Z",
    "@version": "1",
    "message": "サーバ起因の例外が発生しました",
    "logger_name": "nu.mine.kino.advice.GlobalExceptionHandler",
    "thread_name": "http-nio-8080-exec-3",
    "level": "ERROR",
    "level_value": 40000,
    "stack_trace": "略",
    "requestId": "5a207715-03b7-4f60-980c-bcaf376266c0",
    "appType": "FW",
    "stream": "stdout",
    "time": "2025-09-22T05:25:52.006094854Z"
}
]
エラーログには、FWが出力した検知したいエラーログが出力されています!
最後、全リクエストに対してのリクエスト/レスポンス用ログです(整形しています)
$ cat fluentbit/test/output_dir/request_response-
request_response-: [1758518735.209561684,
{
  "@timestamp": "2025-09-22T05:25:35.187600167Z",
  "@version": "1",
  "message": "FWログ出力(Request)",
  "logger_name": "nu.mine.kino.filter.RequestLoggingFilter",
  "thread_name": "http-nio-8080-exec-1",
  "level": "INFO",
  "level_value": 20000,
  "requestId": "62bc6e62-a054-44e3-b129-74c42c10f0e3",
  "request": { "uri": "/echoLogger", "method": "GET" },
  "appType": "FW",
  "logType": "request_response",
  "stream": "stdout",
  "time": "2025-09-22T05:25:35.209561684Z"
}
]
request_response-: [1758518735.253955557,
{
  "@timestamp": "2025-09-22T05:25:35.252446024Z",
  "@version": "1",
  "message": "FWログ出力(Request/Response)",
  "logger_name": "nu.mine.kino.filter.RequestLoggingFilter",
  "thread_name": "http-nio-8080-exec-1",
  "level": "INFO",
  "level_value": 20000,
  "requestId": "62bc6e62-a054-44e3-b129-74c42c10f0e3",
  "request": { "uri": "/echoLogger", "method": "GET" },
  "response": { "status": "200", "duration": "71" },
  "appType": "FW",
  "logType": "request_response",
  "stream": "stdout",
  "time": "2025-09-22T05:25:35.253955557Z"
}
]


request_response-: [1758518746.189457543,
{
  "@timestamp": "2025-09-22T05:25:46.188132443Z",
  "@version": "1",
  "message": "FWログ出力(Request)",
  "logger_name": "nu.mine.kino.filter.RequestLoggingFilter",
  "thread_name": "http-nio-8080-exec-2",
  "level": "INFO",
  "level_value": 20000,
  "requestId": "a4c51a63-a7b9-47bf-8329-d3d64dd04d9b",
  "request": { "uri": "/clientException", "method": "GET" },
  "appType": "FW",
  "logType": "request_response",
  "stream": "stdout",
  "time": "2025-09-22T05:25:46.189457543Z"
}
]
request_response-: [1758518746.236204252,
{
  "@timestamp": "2025-09-22T05:25:46.235690802Z",
  "@version": "1",
  "message": "FWログ出力(Request/Response)",
  "logger_name": "nu.mine.kino.filter.RequestLoggingFilter",
  "thread_name": "http-nio-8080-exec-2",
  "level": "INFO",
  "level_value": 20000,
  "requestId": "a4c51a63-a7b9-47bf-8329-d3d64dd04d9b",
  "request": { "uri": "/clientException", "method": "GET" },
  "response": { "status": "400", "duration": "47" },
  "appType": "FW",
  "logType": "request_response",
  "stream": "stdout",
  "time": "2025-09-22T05:25:46.236204252Z"
}
]


request_response-: [1758518752.003461514,
{
  "@timestamp": "2025-09-22T05:25:52.002740268Z",
  "@version": "1",
  "message": "FWログ出力(Request)",
  "logger_name": "nu.mine.kino.filter.RequestLoggingFilter",
  "thread_name": "http-nio-8080-exec-3",
  "level": "INFO",
  "level_value": 20000,
  "requestId": "5a207715-03b7-4f60-980c-bcaf376266c0",
  "request": { "uri": "/serverException", "method": "GET" },
  "appType": "FW",
  "logType": "request_response",
  "stream": "stdout",
  "time": "2025-09-22T05:25:52.003461514Z"
}
]
request_response-: [1758518752.009000232,
{
  "@timestamp": "2025-09-22T05:25:52.008536779Z",
  "@version": "1",
  "message": "FWログ出力(Request/Response)",
  "logger_name": "nu.mine.kino.filter.RequestLoggingFilter",
  "thread_name": "http-nio-8080-exec-3",
  "level": "INFO",
  "level_value": 20000,
  "requestId": "5a207715-03b7-4f60-980c-bcaf376266c0",
  "request": { "uri": "/serverException", "method": "GET" },
  "response": { "status": "503", "duration": "6" },
  "appType": "FW",
  "logType": "request_response",
  "stream": "stdout",
  "time": "2025-09-22T05:25:52.009000232Z"
}
]
$
それぞれのリクエストに対して、Requestログ、Request/Responseログが出力されました!
よさそうですね。
参考)AWS の設定
最後に、AWS環境での実行結果も見てみようと思います。AWS用のFluent Bitの設定は fluent-bit/fluent-bit-custom.conf に記載があります。下記にOUTPUT部だけ抜粋しました。
# errorタグをCloudWatch Logsへ
[OUTPUT]
    Name cloudwatch_logs
    Match error-*
    region ap-northeast-1
    auto_create_group true
    log_group_name /aws/ecs/spring-boot-sample-tomcat-error
    log_stream_prefix error/
    # log_retention_days 30

# ロググループ : /aws/ecs/spring-boot-sample-tomcat-error
# ストリーム: error/error-[コンテナID?ぽいなにか]
# へ転送

[OUTPUT]
    Name s3
    Match fw-*
    region ap-northeast-1
    bucket masatomix-fluent-bit
    total_file_size 1M
    upload_timeout 1m
    use_put_object On
# 実際は、
# s3://masatomix-fluent-bit/fluent-bit-logs/fw-[コンテナID?ぽいなにか]/2025/09/22/08/16/03-xxxx
# とかになってる(日付みたいなところは、UTCなので注意。日本時間-9h)

[OUTPUT]
    Name s3
    Match request_response-*
    region ap-northeast-1
    bucket masatomix-fluent-bit-req-res
    total_file_size 1M
    upload_timeout 1m
    use_put_object On

# 実際は
# s3://masatomix-fluent-bit-req-res/fluent-bit-logs/request_response-[コンテナID?ぽいなにか]/2025/09/22/08/16/02-xxxxxxx
# とかになってる(日付みたいなところは、UTCなので注意。日本時間-9h)


[OUTPUT]
    Name s3
    Match *-firelens-*
    region ap-northeast-1
    bucket masatomix-fluent-bit
    total_file_size 1M
    upload_timeout 1m
    use_put_object On
# 実際は
# s3://masatomix-fluent-bit/fluent-bit-logs/app-firelens-[コンテナID?ぽいなにか]/2025/09/22/08/11/36-xxxxxx
# とかになってる(日付みたいなところは、UTCなので注意。日本時間-9h)
上記を含んだFluent Bit のDocker イメージを作成して、ECRへプッシュ・ECSへデプロイしましょう1。
実際にログ出力してみます。まずはコンソールより呼び出してみた結果2。
$ curl "https://xxxx.execute-api.ap-northeast-1.amazonaws.com/staging/test/echoLogger" -i
HTTP/2 200
date: Tue, 23 Sep 2025 12:24:19 GMT
content-type: text/plain;charset=UTF-8
content-length: 16
x-amzn-remapped-content-length: 16
x-amzn-remapped-connection: keep-alive
x-request-id: 38612184-d182-4395-9c43-4dedaf043fae
vary: accept-encoding
x-amzn-remapped-date: Tue, 23 Sep 2025 12:24:19 GMT

Default Message.


$ curl "https://xxxx.execute-api.ap-northeast-1.amazonaws.com/staging/test/clientException" -i
HTTP/2 400
date: Tue, 23 Sep 2025 12:24:31 GMT
content-type: application/json
content-length: 89
x-amzn-remapped-connection: close
x-request-id: 90bb9722-060d-43de-ae02-f68d7b96ee9e
vary: accept-encoding
x-amzn-remapped-date: Tue, 23 Sep 2025 12:24:31 GMT

{"code":"BAD_REQUEST","message":"クライアント起因の例外が発生しました"}


$ curl "https://xxxx.execute-api.ap-northeast-1.amazonaws.com/staging/test/serverException" -i
HTTP/2 503
date: Tue, 23 Sep 2025 12:38:20 GMT
content-type: application/json
content-length: 88
x-amzn-remapped-connection: close
x-request-id: 4c290598-2ba0-4fdd-9080-94f2c4925365
vary: accept-encoding
x-amzn-remapped-date: Tue, 23 Sep 2025 12:38:20 GMT

{"code":"SERVICE_UNAVAILABLE","message":"サーバ起因の例外が発生しました"}

$
AWS上で実際にS3へアクセスして、ログを見てみます。
まずは -firelens-の業務アプリが出力したログ。
S3の場所:s3://masatomix-fluent-bit/fluent-bit-logs/app-firelens-ccf29c03eae6445aba055b5adb95bd7a/2025/09/23/12/24/19-objectziEMW0WH (もちろん環境によって異なる値です)
{
  "date": "2025-09-23T12:24:19.341892Z",
  "@timestamp": "2025-09-23T12:24:19.341561663Z",
  "@version": "1",
  "message": "Default Message.",
  "logger_name": "nu.mine.kino.web.EchoController",
  "thread_name": "http-nio-8080-exec-10",
  "level": "INFO",
  "level_value": 20000,
  "requestId": "38612184-d182-4395-9c43-4dedaf043fae",
  "container_name": "app",
  "source": "stdout",
  "container_id": "ccf29c03eae6445aba055b5adb95bd7a-0527074092",
  "ecs_cluster": "app-server-dev-20250815-cluster",
  "ecs_task_arn": "arn:aws:ecs:ap-northeast-1:xxxx:task/app-server-dev-20250815-cluster/ccf29c03eae6445aba055b5adb95bd7a",
  "ecs_task_definition": "app-taskdefinition-dev-20250815:23",
}
ローカルで出力していたログにくらべ、いくつかのプロパティが自動で追加されています。
つづいて、fw-のFWが出力したWARNなログ。 こちらはここにありました。
S3の場所: s3://masatomix-fluent-bit/fluent-bit-logs/fw-59afea3f5a91497b91f401adb5485b44-0527074092/2025/09/23/12/24/32-objectrDd15uu8
{
    "date": "2025-09-23T12:24:31.522761Z",
    "@timestamp": "2025-09-23T12:24:31.475132036Z",
    "@version": "1",
    "message": "クライアント起因の例外が発生しました",
    "logger_name": "nu.mine.kino.advice.GlobalExceptionHandler",
    "thread_name": "http-nio-8080-exec-3",
    "level": "WARN",
    "level_value": 30000,
    "stack_trace": "nu.mine.kino.exceptions.ClientException: 省略",
    "requestId": "90bb9722-060d-43de-ae02-f68d7b96ee9e",
    "appType": "FW",
    "source": "stdout",
    "container_id": "59afea3f5a91497b91f401adb5485b44-0527074092",
    "container_name": "app",
    "ecs_cluster": "app-server-dev-20250815-cluster",
    "ecs_task_arn": "arn:aws:ecs:ap-northeast-1:xxxx:task/app-server-dev-20250815-cluster/59afea3f5a91497b91f401adb5485b44",
    "ecs_task_definition": "app-taskdefinition-dev-20250815:23"
}
次はエラーログ。こちらはCloudWatch Logs でした。該当するロググループを見てみると、
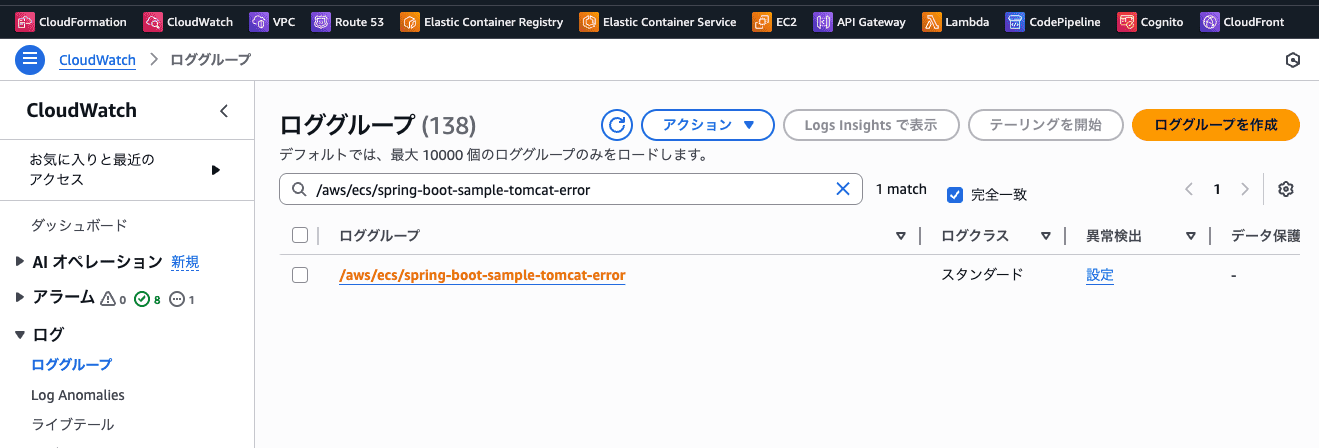
ロググループが作成されています。さらに中身を見てみると、、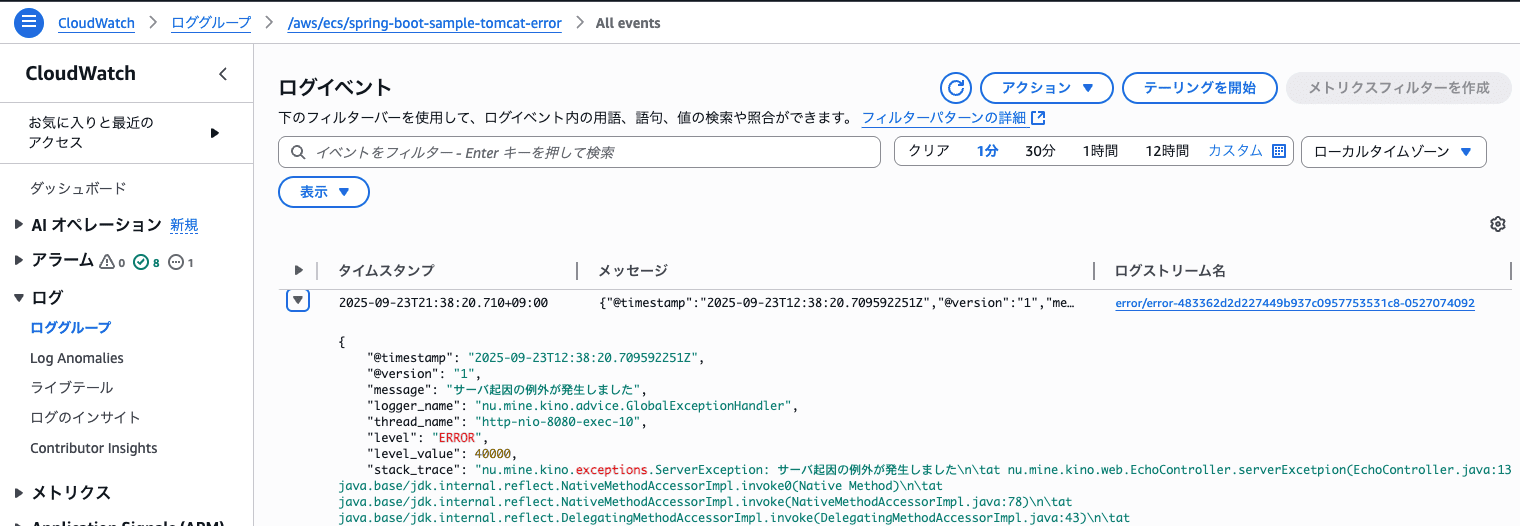
ありますね。具体的な値はこんな感じ。
{
    "@timestamp": "2025-09-23T12:38:20.709592251Z",
    "@version": "1",
    "message": "サーバ起因の例外が発生しました",
    "logger_name": "nu.mine.kino.advice.GlobalExceptionHandler",
    "thread_name": "http-nio-8080-exec-10",
    "level": "ERROR",
    "level_value": 40000,
    "stack_trace": "nu.mine.kino.exceptions.ServerException: サーバ起因の例外が発生しました省略",
    "requestId": "4c290598-2ba0-4fdd-9080-94f2c4925365",
    "appType": "FW",
    "container_id": "483362d2d227449b937c0957753531c8-0527074092",
    "container_name": "app",
    "source": "stdout",
    "ecs_cluster": "app-server-dev-20250815-cluster",
    "ecs_task_arn": "arn:aws:ecs:ap-northeast-1:xxxx:task/app-server-dev-20250815-cluster/483362d2d227449b937c0957753531c8",
    "ecs_task_definition": "app-taskdefinition-dev-20250815:23"
}
ちなみに「CloudWatch Logs に監視を仕掛ける」には、
- 上記のロググループに「メトリクスフィルタ」を設定する
- メトリクスフィルタは、ログストリームから特定の文字列を検出してメトリクスに変換する仕組み
- ログが流れてきたときに、条件に合致する場合は、指定したメトリクスの数値を1にする、みたいなヤツ3
- このログに流れてくるときは無条件でエラーで良いんだけど、たとえば「データにERRORが含まれている場合」みたいな条件を仕掛ける
- 上記で作成したメトリクスに、CloudWatch アラームを設定する
- 先のメトリクスが1の場合はアラーム状態
- その場合は所定の場所にメールする
などをやったりします。
最後、全リクエストに対してのリクエスト・レスポンスログです。
S3の場所: s3://masatomix-fluent-bit-req-res/fluent-bit-logs/request_response-ccf29c03eae6445aba055b5adb95bd7a-0527074092/2025/09/23/12/24/19-objectQEXeU6jE ほかにも散在してあるのですが、下記はひとつにしました
[
    {
        "date": "2025-09-23T12:24:19.255383Z",
        "@timestamp": "2025-09-23T12:24:19.255234149Z",
        "@version": "1",
        "message": "FWログ出力(Request)",
        "logger_name": "nu.mine.kino.filter.RequestLoggingFilter",
        "thread_name": "http-nio-8080-exec-10",
        "level": "INFO",
        "level_value": 20000,
        "requestId": "38612184-d182-4395-9c43-4dedaf043fae",
        "request": {
            "uri": "/echoLogger",
            "method": "GET"
        },
        "appType": "FW",
        "logType": "request_response",
        "container_name": "app",
        "source": "stdout",
        "container_id": "ccf29c03eae6445aba055b5adb95bd7a-0527074092",
        "ecs_cluster": "app-server-dev-20250815-cluster",
        "ecs_task_arn": "arn:aws:ecs:ap-northeast-1:xxxx:task/app-server-dev-20250815-cluster/ccf29c03eae6445aba055b5adb95bd7a",
        "ecs_task_definition": "app-taskdefinition-dev-20250815:23"
    },
    {
        "date": "2025-09-23T12:24:19.345648Z",
        "@timestamp": "2025-09-23T12:24:19.345412353Z",
        "@version": "1",
        "message": "FWログ出力(Request/Response)",
        "logger_name": "nu.mine.kino.filter.RequestLoggingFilter",
        "thread_name": "http-nio-8080-exec-10",
        "level": "INFO",
        "level_value": 20000,
        "requestId": "38612184-d182-4395-9c43-4dedaf043fae",
        "request": {
            "uri": "/echoLogger",
            "method": "GET"
        },
        "response": {
            "duration": "90",
            "status": "200"
        },
        "appType": "FW",
        "logType": "request_response",
        "container_name": "app",
        "source": "stdout",
        "container_id": "ccf29c03eae6445aba055b5adb95bd7a-0527074092",
        "ecs_cluster": "app-server-dev-20250815-cluster",
        "ecs_task_arn": "arn:aws:ecs:ap-northeast-1:xxxx:task/app-server-dev-20250815-cluster/ccf29c03eae6445aba055b5adb95bd7a",
        "ecs_task_definition": "app-taskdefinition-dev-20250815:23"
    },
    {
        "date": "2025-09-23T12:24:31.459211Z",
        "@timestamp": "2025-09-23T12:24:31.459107604Z",
        "@version": "1",
        "message": "FWログ出力(Request)",
        "logger_name": "nu.mine.kino.filter.RequestLoggingFilter",
        "thread_name": "http-nio-8080-exec-3",
        "level": "INFO",
        "level_value": 20000,
        "requestId": "90bb9722-060d-43de-ae02-f68d7b96ee9e",
        "request": {
            "uri": "/clientException",
            "method": "GET"
        },
        "appType": "FW",
        "logType": "request_response",
        "container_id": "59afea3f5a91497b91f401adb5485b44-0527074092",
        "container_name": "app",
        "source": "stdout",
        "ecs_cluster": "app-server-dev-20250815-cluster",
        "ecs_task_arn": "arn:aws:ecs:ap-northeast-1:xxxx:task/app-server-dev-20250815-cluster/59afea3f5a91497b91f401adb5485b44",
        "ecs_task_definition": "app-taskdefinition-dev-20250815:23"
    },
    {
        "date": "2025-09-23T12:24:31.632716Z",
        "@timestamp": "2025-09-23T12:24:31.632487051Z",
        "@version": "1",
        "message": "FWログ出力(Request/Response)",
        "logger_name": "nu.mine.kino.filter.RequestLoggingFilter",
        "thread_name": "http-nio-8080-exec-3",
        "level": "INFO",
        "level_value": 20000,
        "requestId": "90bb9722-060d-43de-ae02-f68d7b96ee9e",
        "request": {
            "uri": "/clientException",
            "method": "GET"
        },
        "response": {
            "duration": "173",
            "status": "400"
        },
        "appType": "FW",
        "logType": "request_response",
        "container_id": "59afea3f5a91497b91f401adb5485b44-0527074092",
        "container_name": "app",
        "source": "stdout",
        "ecs_cluster": "app-server-dev-20250815-cluster",
        "ecs_task_arn": "arn:aws:ecs:ap-northeast-1:xxxx:task/app-server-dev-20250815-cluster/59afea3f5a91497b91f401adb5485b44",
        "ecs_task_definition": "app-taskdefinition-dev-20250815:23"
    },
    {
        "date": "2025-09-23T12:24:31.522761Z",
        "@timestamp": "2025-09-23T12:24:31.475132036Z",
        "@version": "1",
        "message": "クライアント起因の例外が発生しました",
        "logger_name": "nu.mine.kino.advice.GlobalExceptionHandler",
        "thread_name": "http-nio-8080-exec-3",
        "level": "WARN",
        "level_value": 30000,
        "stack_trace": "nu.mine.kino.exceptions.ClientException: クライアント起因の例外が発生しました\n\tat nu.mine.kino.web.EchoController.clientExcetpion(EchoController.java:133)省略",
        "requestId": "90bb9722-060d-43de-ae02-f68d7b96ee9e",
        "appType": "FW",
        "source": "stdout",
        "container_id": "59afea3f5a91497b91f401adb5485b44-0527074092",
        "container_name": "app",
        "ecs_cluster": "app-server-dev-20250815-cluster",
        "ecs_task_arn": "arn:aws:ecs:ap-northeast-1:xxxx:task/app-server-dev-20250815-cluster/59afea3f5a91497b91f401adb5485b44",
        "ecs_task_definition": "app-taskdefinition-dev-20250815:23"
    },
    {
        "date": "2025-09-23T12:38:20.704497Z",
        "@timestamp": "2025-09-23T12:38:20.704374937Z",
        "@version": "1",
        "message": "FWログ出力(Request)",
        "logger_name": "nu.mine.kino.filter.RequestLoggingFilter",
        "thread_name": "http-nio-8080-exec-10",
        "level": "INFO",
        "level_value": 20000,
        "requestId": "4c290598-2ba0-4fdd-9080-94f2c4925365",
        "request": {
            "method": "GET",
            "uri": "/serverException"
        },
        "appType": "FW",
        "logType": "request_response",
        "container_name": "app",
        "source": "stdout",
        "container_id": "483362d2d227449b937c0957753531c8-0527074092",
        "ecs_cluster": "app-server-dev-20250815-cluster",
        "ecs_task_arn": "arn:aws:ecs:ap-northeast-1:xxxx:task/app-server-dev-20250815-cluster/483362d2d227449b937c0957753531c8",
        "ecs_task_definition": "app-taskdefinition-dev-20250815:23"
    },
    {
        "date": "2025-09-23T12:38:20.712328Z",
        "@timestamp": "2025-09-23T12:38:20.712175249Z",
        "@version": "1",
        "message": "FWログ出力(Request/Response)",
        "logger_name": "nu.mine.kino.filter.RequestLoggingFilter",
        "thread_name": "http-nio-8080-exec-10",
        "level": "INFO",
        "level_value": 20000,
        "requestId": "4c290598-2ba0-4fdd-9080-94f2c4925365",
        "request": {
            "method": "GET",
            "uri": "/serverException"
        },
        "response": {
            "duration": "8",
            "status": "503"
        },
        "appType": "FW",
        "logType": "request_response",
        "container_name": "app",
        "source": "stdout",
        "container_id": "483362d2d227449b937c0957753531c8-0527074092",
        "ecs_cluster": "app-server-dev-20250815-cluster",
        "ecs_task_arn": "arn:aws:ecs:ap-northeast-1:xxxx:task/app-server-dev-20250815-cluster/483362d2d227449b937c0957753531c8",
        "ecs_task_definition": "app-taskdefinition-dev-20250815:23"
    }
]
よさそうですね。AWSでもFluent Bitが正しくログを転送していることが確認できました。
まとめ
- Spring Bootが構造的なJSONログを出力する
- そのログにログを分類するための情報を付与しておく
- Fluent Bitが、その情報を元にログを所定の場所へ振り分けていく
- AWS上ではS3とかCloudWatch Logsとかに振り分けることができる
などなどがわかりましたね。
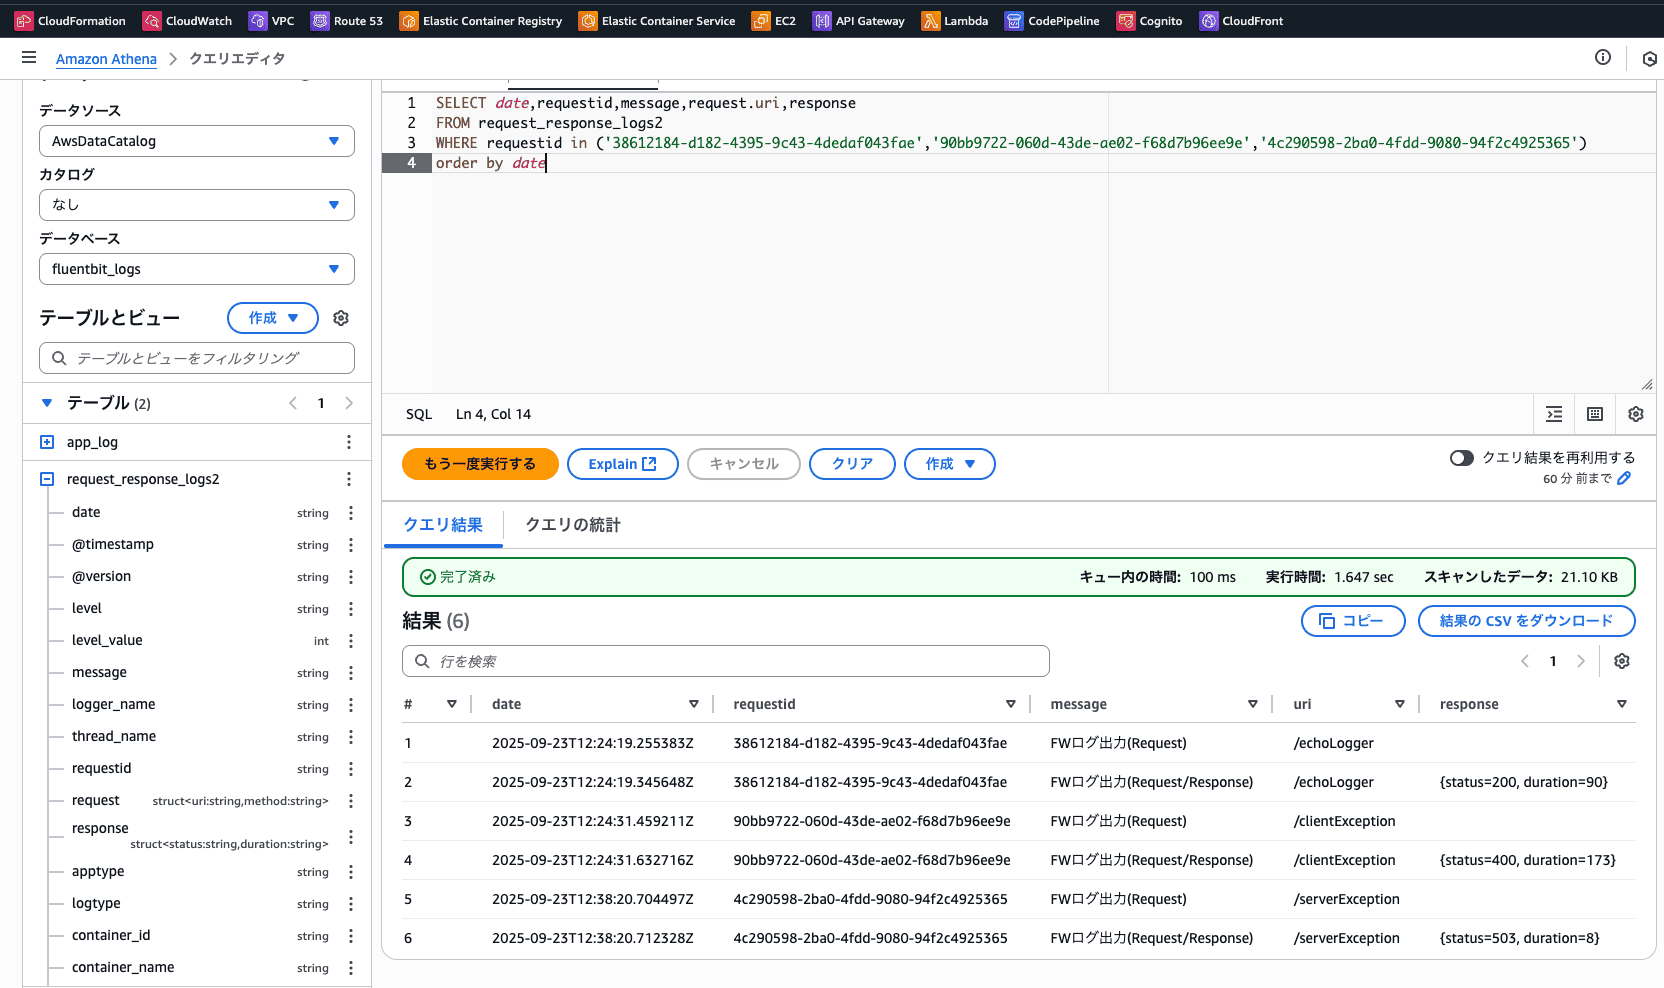
さらには S3に保存したログについては、ログたちがコンテナごと、日時ごとにバラバラに保存されてしまうのでログの調査が超メンドくさくなったりしますが「Kinesis Data Firehose などを経由してバッファリングしてからS3へ保存する」とか、下記のように 「S3上のJSONデータを構造的に検索できる(SQLがつかえる) AWS Athena などを活用する」 などの回避策があったりします。またいつか記事にしたいと思います!
お疲れさまでした。
関連リンク
- AWS CDK で Infrastructure as Code する: Fluent Bit編1。ローカルのDockerで疎通確認
- AWS CDK で Infrastructure as Code する: Fluent Bit編2。設定ファイルを読んでみる
- AWS CDK で Infrastructure as Code する: Fluent Bit 番外編。SpringBootのログ機構
- AWS CDK で Infrastructure as Code する: Fluent Bit 番外編。SpringBootのログ機構つづき。
- AWS CDK で Infrastructure as Code する: SpringBoot編2