pandasのplotで棒グラフと円グラフを横に並べて表示してみたいと思います
データ
| A | |
|---|---|
| 0 | test |
| 1 | train |
| 2 | test |
| 3 | train |
| 4 | train |
コードはこちら
いくつかの記事ではaxesの要素数が2だったりするが、1行の場合は[0,1]の様な書き方はエラーとなった
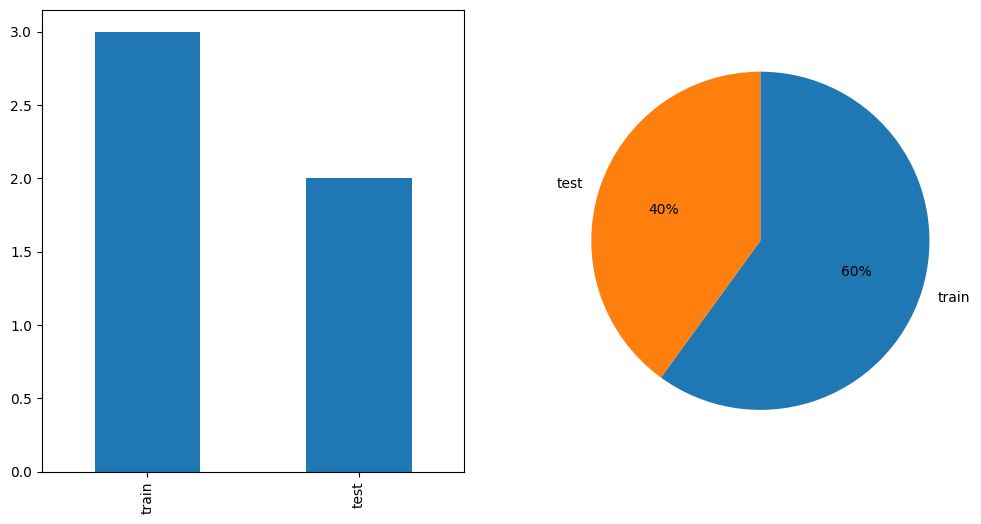
fig, axes = plt.subplots(1,2,figsize=(12, 6)) # 1行2列
df["A"].value_counts().plot(ax=axes[0],kind='bar')
df["A"].value_counts().plot(ax=axes[1],kind='pie',autopct="%.f%%",startangle=90,counterclock=False,ylabel="")
plt.show()