scikit-learnを使ってみたので、そのメモです。
scikit-learnはPythonから使える機械学習ライブラリです。
https://scikit-learn.org/stable/index.html
線形回帰
一次関数
一次関数 y = 2x + 3 を求めます。
xの値を0〜10の範囲で50個準備します。
最初の75%をトレーニングデータ、残り25%をテストデータとして使用します。
import numpy as np
from sklearn import linear_model
from sklearn.model_selection import train_test_split
import matplotlib.pyplot as plt

# Y = 2X + 3を求める関数とする。
X = np.linspace(0, 10, num=50)
Y = 2 * X + 3

train_X, test_X, train_Y, test_Y = train_test_split(X, Y, shuffle=False)
train_X2 = train_X.reshape(-1, 1)
test_X2 = test_X.reshape(-1, 1)

clf = linear_model.LinearRegression()
train_X2 = train_X.reshape(-1, 1)
clf.fit(train_X2, train_Y)

print(f'回帰係数={clf.coef_}')
print(f'切片={clf.intercept_}')
print(f'決定係数={clf.score(train_X2, train_Y)}')

plt.scatter(X, Y, label='data')
plt.plot(train_X, clf.predict(train_X2), color='green', label='train')
plt.plot(test_X, clf.predict(test_X2), color='red', label='test')
plt.legend()
plt.savefig('linear_regression1.png')
plt.show()
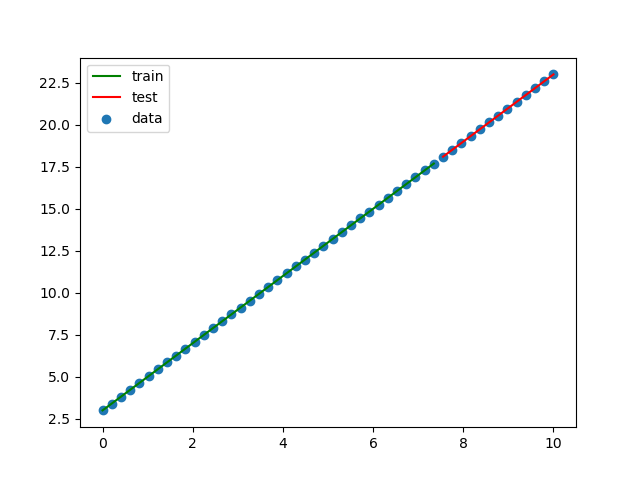
結果をグラフにしてみます。
完璧です!
二次関数
同じような感じで二次関数を求めます。
求める式は、y = x^2 + 2x + 3 です。
import numpy as np
from sklearn import linear_model
from sklearn.model_selection import train_test_split
import matplotlib.pyplot as plt

# Y = X^2 + 2X + 3を求める関数とする。
X = np.linspace(0, 10, num=50)
Y = X**2 + 2 * X + 3

train_X, test_X, train_Y, test_Y = train_test_split(X, Y, shuffle=False)
train_X2 = train_X.reshape(-1, 1)
test_X2 = test_X.reshape(-1, 1)

clf = linear_model.LinearRegression()
train_X2 = train_X.reshape(-1, 1)
clf.fit(train_X2, train_Y)

print(f'回帰係数={clf.coef_}')
print(f'切片={clf.intercept_}')
print(f'決定係数={clf.score(train_X2, train_Y)}')

plt.scatter(X, Y, label='data')
plt.plot(train_X, clf.predict(train_X2), color='green', label='train')
plt.plot(test_X, clf.predict(test_X2), color='red', label='test')
plt.legend()
plt.savefig('linear_regression2.png')
plt.show()
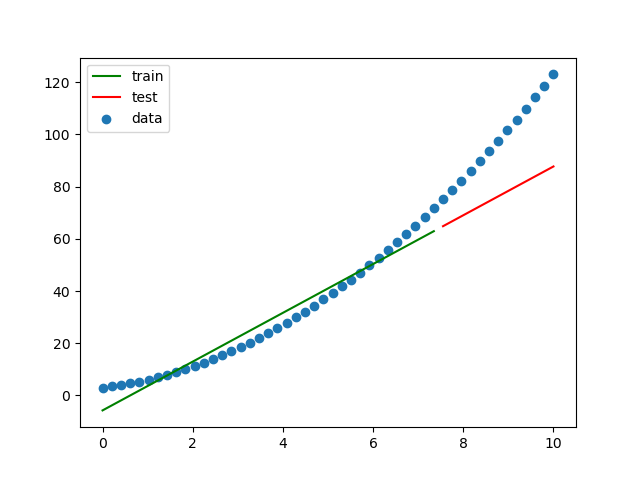
結果をグラフにしてみます。
一次関数を求めようとしているので、結果は予想通りフィットしていません。
二次関数 - 多項式を使う
前の例をPolynomialFeaturesを使って二次関数として求めてみます。
import numpy as np
from sklearn.model_selection import train_test_split
from sklearn.linear_model import LinearRegression
from sklearn.preprocessing import PolynomialFeatures
import matplotlib.pyplot as plt

# Y = X^2 + 2X + 3を求める関数とする。
X = np.linspace(0, 10, num=50)
Y = X**2 + 2 * X + 3

train_X, test_X, train_Y, test_Y = train_test_split(X, Y, shuffle=False)
train_X2 = train_X.reshape(-1, 1)
test_X2 = test_X.reshape(-1, 1)

pf = PolynomialFeatures(degree=2, include_bias=False)
train_X2 = pf.fit_transform(train_X2)

lr = LinearRegression()
lr.fit(train_X2, train_Y)

test_X2 = pf.fit_transform(test_X2)

print(f'回帰係数={lr.coef_}')
print(f'切片={lr.intercept_}')
print(f'決定係数={lr.score(train_X2, train_Y)}')

plt.scatter(X, Y, label='data')
plt.plot(train_X, lr.predict(train_X2), color='green', label='train')
plt.plot(test_X, lr.predict(test_X2), color='red', label='test')
plt.legend()
plt.savefig('linear_regression3.png')
plt.show()
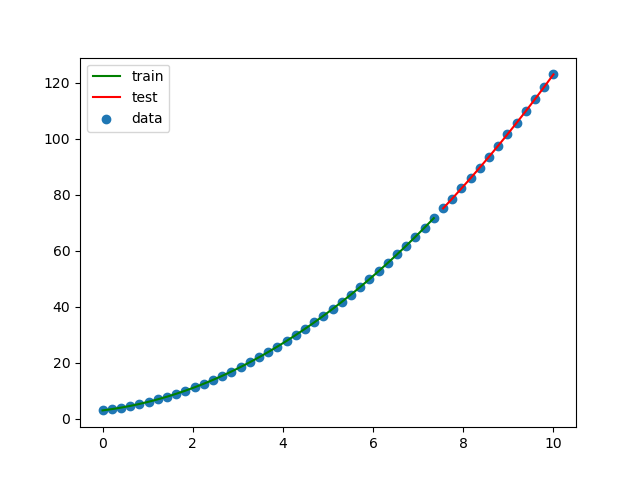
フィットしました!
三角関数
次に三角関数で同じことをやってみます。
求める関数はsin関数です。
やる前から結果は見えているような気もしますが...
import numpy as np
from sklearn.model_selection import train_test_split
from sklearn.linear_model import LinearRegression
from sklearn.preprocessing import PolynomialFeatures
import matplotlib.pyplot as plt

# 三角関数 Y = sin(X)を求める。
X = np.linspace(0, 20, num=200)
Y = np.sin(X)

train_X, test_X, train_Y, test_Y = train_test_split(X, Y, shuffle=False)
train_X2 = train_X.reshape(-1, 1)
test_X2 = test_X.reshape(-1, 1)

pf = PolynomialFeatures(degree=2, include_bias=False)
train_X2 = pf.fit_transform(train_X2)

lr = LinearRegression()
lr.fit(train_X2, train_Y)

test_X2 = pf.fit_transform(test_X2)

print(f'回帰係数={lr.coef_}')
print(f'切片={lr.intercept_}')
print(f'決定係数={lr.score(train_X2, train_Y)}')

plt.scatter(X, Y, label='data')
plt.plot(train_X, lr.predict(train_X2), color='green', label='train')
plt.plot(test_X, lr.predict(test_X2), color='red', label='test')
plt.legend()
plt.savefig('linear_regression4.png')
plt.show()
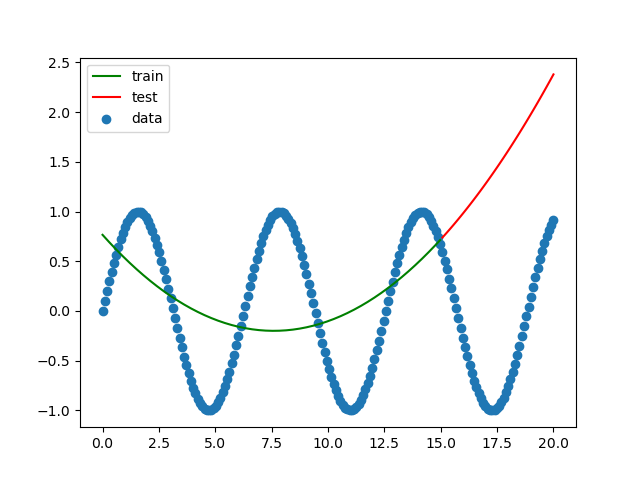
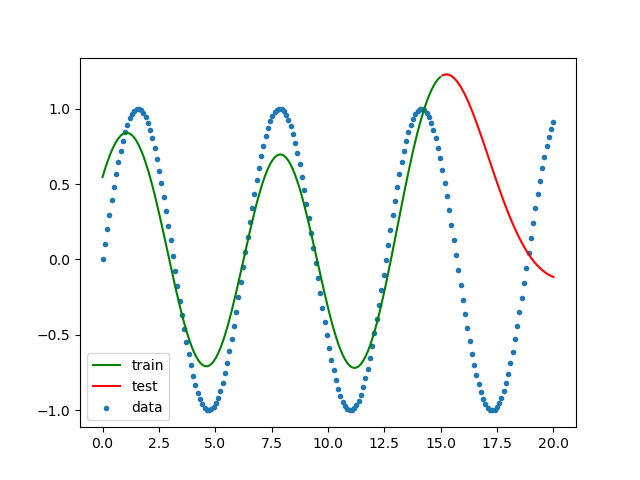
結果をグラフにしてみます。
三角関数を二次関数として求めているので予想通りの結果です。
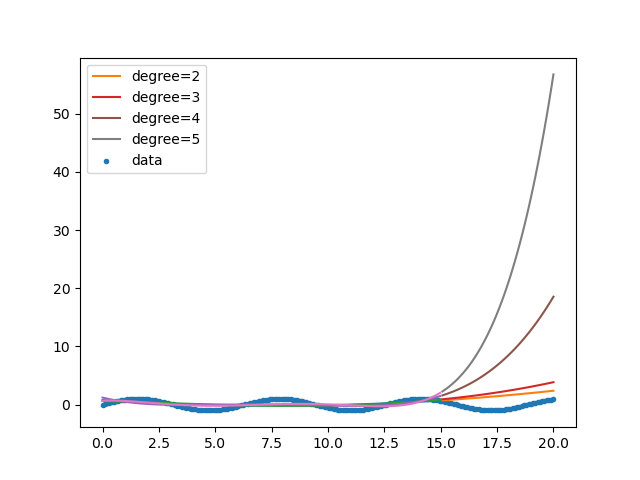
では何次関数ならフィットするのでしょうか?
2〜5次で試してみます。
import numpy as np
from sklearn.model_selection import train_test_split
from sklearn.linear_model import LinearRegression
from sklearn.preprocessing import PolynomialFeatures
import matplotlib.pyplot as plt

# 三角関数 Y = sin(X)を求める。
X = np.linspace(0, 20, num=200)
Y = np.sin(X)

train_X, test_X, train_Y, test_Y = train_test_split(X, Y, shuffle=False)

for degree in np.arange(2, 6):
    train_X2 = train_X.reshape(-1, 1)
    test_X2 = test_X.reshape(-1, 1)

    pf = PolynomialFeatures(degree=degree, include_bias=False)
    train_X2 = pf.fit_transform(train_X2)

    lr = LinearRegression()
    lr.fit(train_X2, train_Y)

    test_X2 = pf.fit_transform(test_X2)

    print(f'degree={degree}')
    print(f'  回帰係数={lr.coef_}')
    print(f'  切片={lr.intercept_}')
    print(f'  決定係数={lr.score(train_X2, train_Y)}')

    plt.plot(train_X, lr.predict(train_X2))
    plt.plot(test_X, lr.predict(test_X2), label=f'degree={degree}')

plt.scatter(X, Y, label='data', marker='.')
plt.legend()
plt.savefig('linear_regression5.png')
plt.show()
結果をグラフにしてみます。
次数が多くなると発散していく感じがします。
サポートベクターマシン
サポートベクターマシンを使って学習させてみます。
import numpy as np
from sklearn import svm
from sklearn.model_selection import train_test_split
import matplotlib.pyplot as plt

# 三角関数 Y = sin(X)を求める。
X = np.linspace(0, 20, num=200)
Y = np.sin(X)

train_X, test_X, train_Y, test_Y = train_test_split(X, Y, shuffle=False)
train_X2 = train_X.reshape(-1, 1)
test_X2 = test_X.reshape(-1, 1)

regr = svm.SVR()
regr.fit(train_X2, train_Y)

plt.scatter(X, Y, label='data', marker='.')
plt.plot(train_X, regr.predict(train_X2), color='green', label='train')
plt.plot(test_X, regr.predict(test_X2), color='red', label='test')
plt.legend()
plt.savefig('svm_regression1.png')
plt.show()
n次関数の予想よりはだいぶ良くなりました。
トレーニングデータはいい感じですが、テストデータに関しては今ひとつです。
