ロトカヴォルテラ方程式競争系の解軌道
解決したいこと
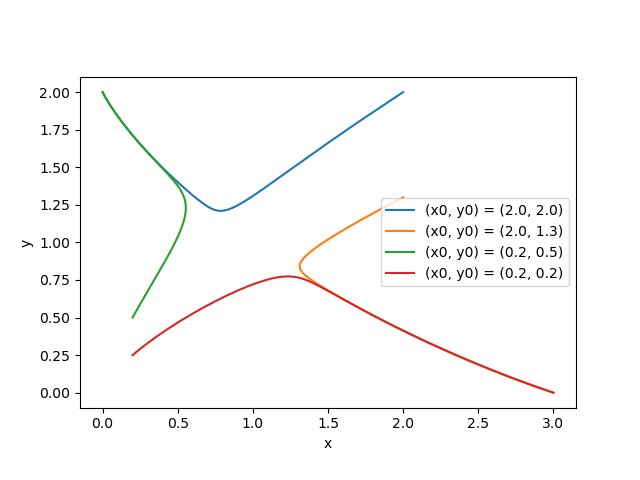
縦軸が個体数x,y、横軸時間tのグラフを
縦軸が個体数x、横軸が個体数yのグラフで表したいのですが
どう変えればいいのかがわかりません。
for文、座標設定ができていないのかなと思っています。
上の画像のようなグラフを出したいです。
解決方法を教えていただきたいです。
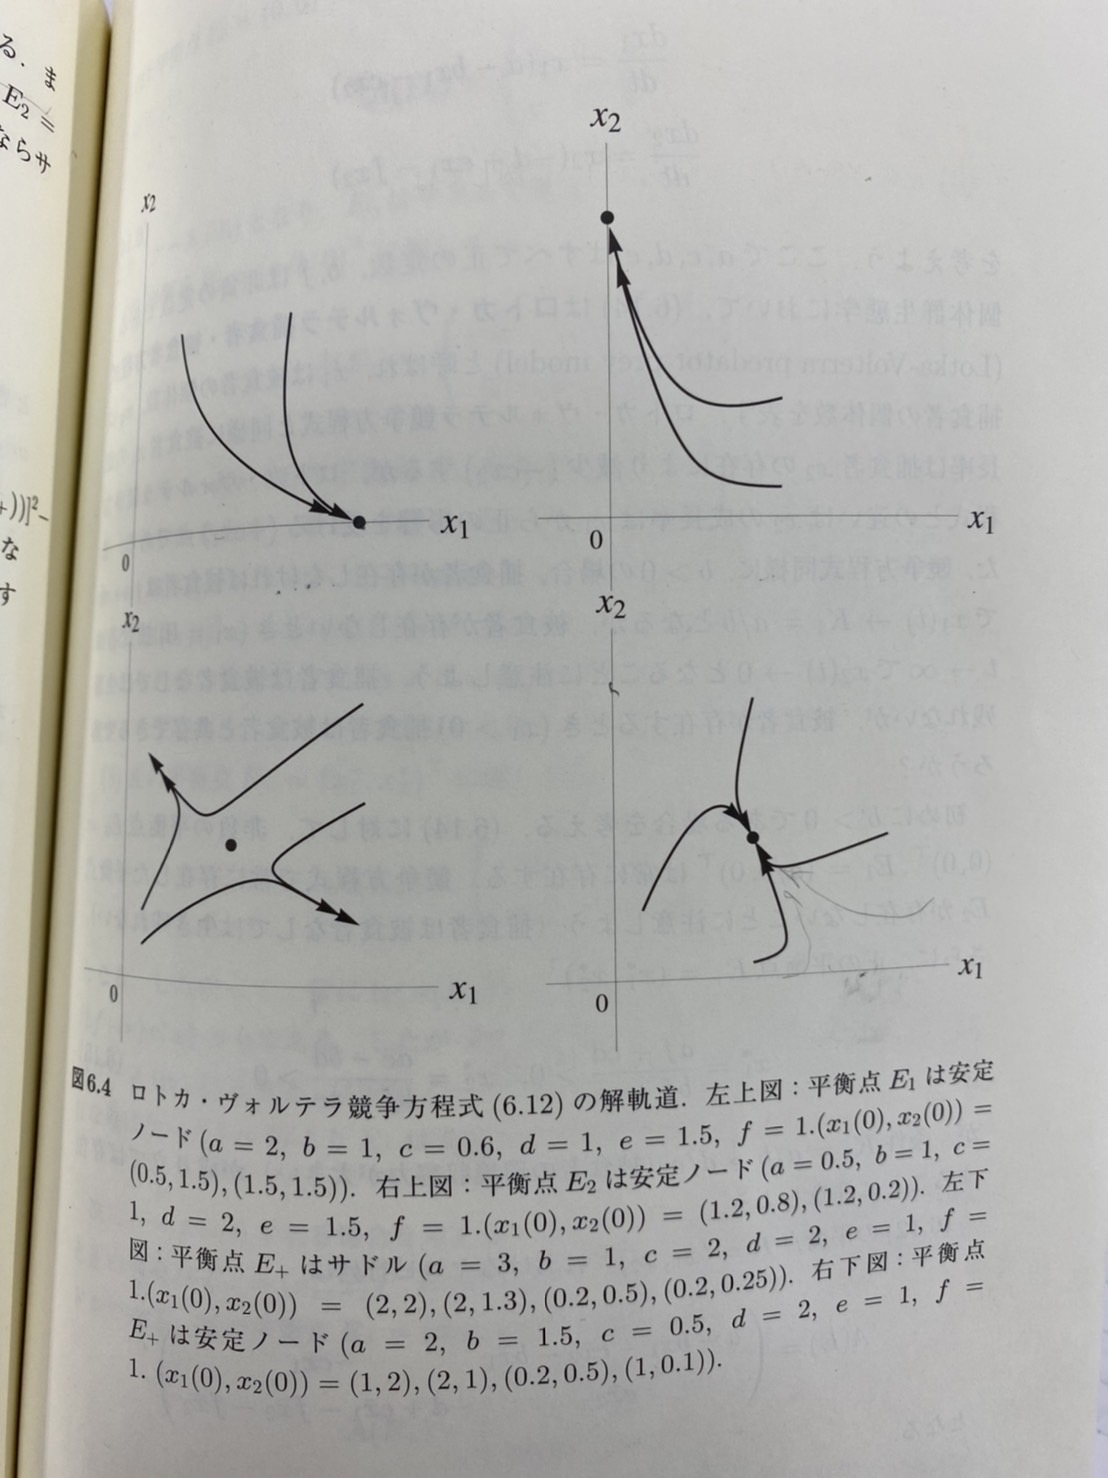
以下のコードのパラメータは画像の左下図で設定しています。
該当するソースコード
import numpy as np
import matplotlib.pyplot as plt

dt = 0.05
t0 = 0
te = 800

ts = np.arange(t0, te + dt, dt)

a = 3.0
b = 1.0
c=2.0
d=2.0
e=1.0
f=1.0
x = 2.0
y = 2.0

xs, ys  = [], []

for t in ts:
    xs.append(x)
    ys.append(y)

    x += (a -b* xs[-1] - c * ys[-1] ) * xs[-1] * dt
    y += (d - e * xs[-1] -f* ys[-1] ) * ys[-1] * dt

    print(f"(x, y, ) = ({x:.3e}, {y:.3e}) ({t:.2e} sec)\r", end=" ")


fig, ax = plt.subplots()

ax.plot(ts, xs, label="x")
ax.plot(ts, ys, label="y")


ax.set_xlabel("t")
ax.set_ylabel("x, y")
ax.legend()

plt.show()
自分で試したこと
import numpy as np
import matplotlib.pyplot as plt

dt = 0.05
t0 = 0
te = 800

ts = np.arange(t0, te + dt, dt)

a = 3.0
b = 1.0
c=2.0
d=2.0
e=1.0
f=1.0
x = 0.3
y = 0.3

xs, ys  = [], []

for t in ts:
    xs.append(x)
    ys.append(y)

    x += (a -b* xs[-1] - c * ys[-1] ) * xs[-1] * dt
    y += (d - e * xs[-1] -f* ys[-1] ) * ys[-1] * dt

    print(f"(x, y, ) = ({x:.3e}, {y:.3e}) ({t:.2e} sec)\r", end=" ")


fig, ax = plt.subplots()

ax.plot(xs, ys, label="x")
ax.plot(xs, ys, label="y")


ax.set_xlabel("x")
ax.set_ylabel("y")
ax.legend()

plt.show()
少し変えてみて試したところ
このような結果になってしまいます
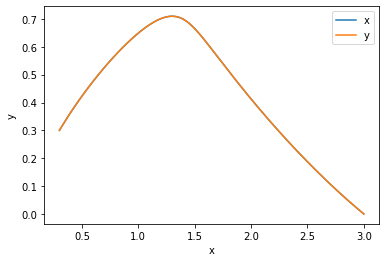
ご教授いただければ幸いです。
よろしくお願いいたします。
0 likes