混同行列の総合評価でF値ってよく出現しますよね。
pをprecision(適合率), rをrecall(再現率)としたとき、F値は、
F = \frac{2pr}{p+r} = \frac{2}{\frac{1}{p} + \frac{1}{r}}
で定義されます。p, rが動くときどんな挙動を示すのでしょうか?
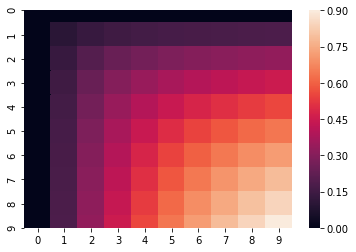
描画
pythonを使って描画してみます:
## set libraries
import numpy as np
import seaborn as sns

## 値の計算
F = np.array([2 / (1/r+1/p) for p in np.arange(0, 1, 0.1) for r in np.arange(0, 1, 0.1)]).reshape(10, 10)

## 描画
sns.heatmap(F)
→縦軸、横軸の目盛が0, 1, .., 9なのはご愛嬌。本来は0.0, 0.1, .., 0.9にして欲しいですが、取り敢えず概観みたいだけなので放っておきますw
気づくこと
-
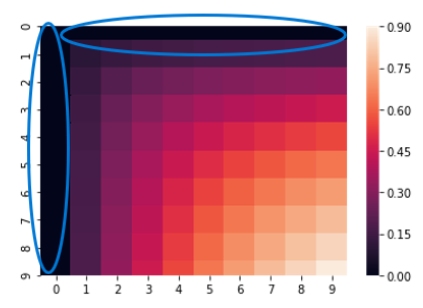
porrが0の時はFの定義から値自体が0(青枠部分)
-
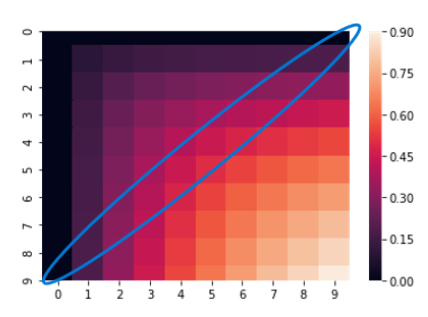
pとrの和が一定でも、porrのどちらかが高くないとF値は下がる、つまりpとrのトレードオフを考えた場合、pとrの両方がバランス良くないとF値は下がりがち- 青枠部分は
p+rが一定のラインですが、端っこにいくと色が黒く、つまり0に近く、真ん中辺りは比較的オレンジっぽく値が高いですね。 - 実務で言えば、適合率、再現率の両者ともに良くないと使い物にならないよね、っていう場合に使ったらいいってことですかね。
- 青枠部分は


