対象者
前回の記事の続きです。
実は条件分岐とループ処理が書ければもう大体のことは実現できます。
本記事はいくつか課題を出題しますので、色々調べながら考えてみてくださいね!
初心者以外でも、Pythonまだあまり知らないこと多いな〜もっと知りたいな〜という方はぜひ!
何かいい課題思いついたら追加します。
(こんなのどう?ってアイデアあればぜひ教えてください)
目次
初級編
まずは簡単なものから。
numpyについて調べながらやってみてください。
課題1
$1 \sim 100$までの整数の和を求めるプログラムをできるだけ少ない行数、文字数で書いてください。
(いわゆるコードゴルフというやつです)
課題2
乱数を100個生成して全ての要素を出力してください。
課題3
課題2で生成した乱数の最大・最小・平均・分散・標準偏差を求めてください。
課題4
課題3について、matplotlibを使って箱ひげ図とヒストグラムを描いてください。
初級編解答例
あくまで例です。
もっとスマートなやり方があればぜひ教えてください🙏
解答1
import numpy as np


print(np.sum(np.arange(101)))
解答2
import numpy as np
import matplotlib.pyplot as plt


np.set_printoptions(threshold=np.inf)
x = np.random.rand(100)
print(x)
解答3
print("max = {}".format(np.max(x)))
print("min = {}".format(np.min(x)))
print("mean = {}".format(np.mean(x)))
print("std = {}".format(np.std(x)))
print("var = {}".format(np.var(x)))
解答4
plt.boxplot(x)
plt.show()

plt.hist(x)
plt.show()
中級編
中級編です。ちょっと難し目です。
課題5
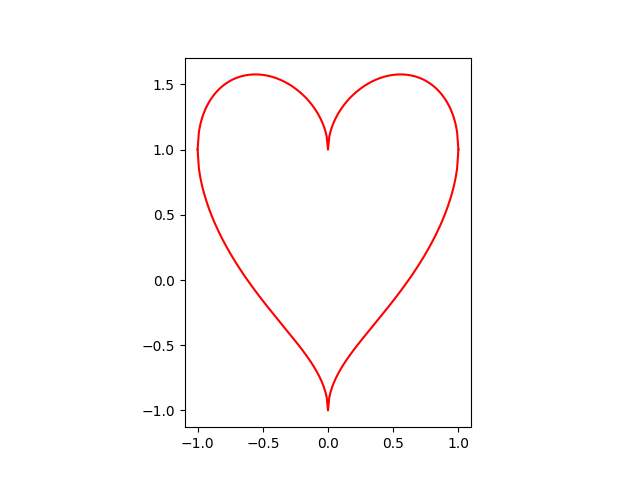
ハート型グラフを描いてください。
(ヒント:ハート グラフ でググる)
課題6
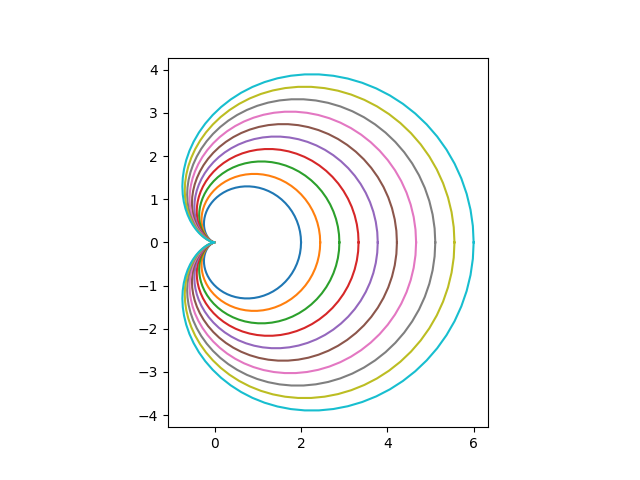
カージオイドのグラフを描いてください。
ただしカージオイドは以下の数式で表されており、この式中の$a$の値について、$1 \sim 3$までを10等分した値で生成したグラフを全て重ねて表示してください。
($a=1$のグラフを生成、$a=1.222\ldots$のグラフを生成、...)
x = a (1 + \cos\theta) \cos\theta \\
y = a (1 + \cos\theta) \sin\theta \\
0 \le \theta \le 2 \pi \quad 1 \le a \le 3
中級編解答例
解答例です。
だんだん複雑になってきましたね。
解答5
これはググればいろんな方程式が出てきますが、今回は[これ](https://enjoymath.pomb.org/?p=15)を使います。x^2 + (y - \sqrt{|x|})^2 = 1 \\
-1 \le x \le 1
\begin{align}
  (y - \sqrt{|x|})^2 &= 1 - x^2 \\
  y - \sqrt{|x|} &= \pm \sqrt{1 - x^2} \\
  y &= \sqrt{|x|} \pm \sqrt{1 - x^2}
\end{align}
\begin{align}
  x &= \cos \theta \\
  y &= \sin \theta + \sqrt{|x|} \\
    &= \sin \theta + \sqrt{|\cos \theta|}
\end{align} \\
0 \le \theta \le 2 \pi
import numpy as np
import matplotlib.pyplot as plt


def f(x, sign):
    if sign == "plus":
        return np.sqrt(np.fabs(x)) + np.sqrt(1 - x ** 2)
    elif sign == "minus":
        return np.sqrt(np.fabs(x)) - np.sqrt(1 - x ** 2)
    else:
        raise ValueError("不明な符号: {}".format(sign))

def g(theta):
    return np.cos(theta), np.sin(theta) + np.sqrt(np.fabs(np.cos(theta)))


#x = np.linspace(-1, 1, 201)
theta = np.linspace(0, 2 * np.pi, 302)

fig, ax = plt.subplots(1)
#plt.plot(x, f(x, "plus"), color="r")
#plt.plot(x, f(x, "minus"), color="r")
x, y = g(theta)
plt.plot(x, y, color="r")
ax.set_aspect("equal")
plt.show()
plt.savefig("heart.png")
解答6
import numpy as np
import matplotlib.pyplot as plt

def r(a, theta):
    coef = a * (1 + np.cos(theta))
    return coef * np.cos(theta), coef * np.sin(theta)

theta = np.linspace(0, 2 * np.pi, 100)
a = np.linspace(1, 3, 10)

fig, ax = plt.subplots(1)
for i in a:
    x, y = r(i, theta)
    plt.plot(x, y)
ax.set_aspect("equal")
plt.show()
plt.savefig("cardioid.png")
上級編
さらに複雑になります。
色々ググりながらやってみよう。
課題7
サイクロイドのwikiにあるアニメーションを描いてください。
サイクロイド曲線だけでOKですが、可能なら動円と動径も描きましょう。
課題8
ある自然数$n \gt 2$を入力すると、その数までの素数のリスト(またはnumpy配列)を返す関数を作成してください。
この時、$n = 1e6 = 100000$を入力した時の実行時間が0.1秒を下回るようにしてください。
上級編解答例
解答7
サイクロイドは以下の設定で描きます。x = r(\theta - \sin \theta) \\
y = r(1 - \cos \theta) \\
r = 1 \quad 0 \le \theta \le 2 \pi
(x - \theta)^2 + (y - r)^2 = r^2 \\
\Leftrightarrow \left\{
  \begin{align}
    x &= r \cos \psi + \theta \\
    y &= r \sin \psi + r
  \end{align}
\right. \\
0 \le \psi \le 2 \pi
\left\{
  \begin{array}{cc}
    y - d = \cfrac{d - b}{c - a} (x - c) & (x \lt |c - a|, a \ne c) \\
    x = c & (a = c, b \le y \le d \quad or \quad d \le y \le b)
  \end{array}
\right.
%matplotlib nbagg
import numpy as np
import matplotlib.pyplot as plt
import matplotlib.animation as animation


def f(r, theta):
    return r * (theta - np.sin(theta)), r * (1 - np.cos(theta))

def circle(r, theta, n_point):
    psi = np.linspace(0, 2 * np.pi, n_point)
    return r * np.cos(psi) + theta, r * np.sin(psi) + r

def line(r, theta, n_point):
    a, b = f(r, theta)
    if theta - a == 0:
        x = np.full(n_point, theta)
        y = np.linspace(min(b, r), max(b, r), n_point)
        return x, y
    else:
        x = np.linspace(min(a, theta), max(a, theta), n_point)
        y = (r - b) / (theta - a) * (x - theta) + r
        return x, y


# パラメータ設定
n_point = 200
r = 1
theta = np.linspace(0, 2 * np.pi, n_point)

# グラフ設定など
fig = plt.figure()
ax = plt.axes()
plt.xlim(theta[0] - 0.5, theta[-1] + 0.5)
plt.ylim(0, 2.5 * r)
plt.grid()
interval = 5

# シーン作成
images = []
for i in range(len(theta)):
    # 動円
    x, y = circle(r, theta[i], n_point)
    im1, = plt.plot(x, y, color="g")
    # 動径
    x, y = line(r, theta[i], n_point)
    im2, = plt.plot(x, y, color="r")
    # サイクロイド曲線
    x, y = f(r, theta[:i])
    im3, = plt.plot(x, y, color="b")
    # サイクロイド点
    if i != 0:
        im4, = plt.plot(x[-1], y[-1], color="b", marker="o")
    else:
        im4, = plt.plot(x, y, color="b", marker="o")
    ax.set_aspect("equal")
    images.append([im1, im2, im3, im4])

# グラフを描く
ani = animation.ArtistAnimation(fig, images, interval=interval)
plt.show()
#ani.save("cycloid.gif", writer="imagemagick")
%matplotlib nbagg
 上記のgifはスクリーンショット→動画をgifにするアプリを用いて生成したgifです...
解答8
ここでは**エラトステネスのふるい**というアルゴリズムを用います。 アルゴリズムの内容自体は至極単純で、- フラグを$n + 1$個用意する(インデックス番号と自然数を対応させるため)
- $0$番目と$1$番目のフラグは折る($=$自然数$0$と$1$は素数ではない)
- $i = 2 \sim \sqrt{n} + 1$までループ
- $i$番目のフラグが立っていれば素数なので、それ以外の$i$で割り切れる数のフラグを折る
- フラグが立っているインデックスを返す
import numpy as np
import time as time

np.set_printoptions(threshold=10, edgeitems=10)

# エラトステネスのふるい
def prime(n):
    numbers = np.ones(n + 1, dtype=np.bool)
    numbers[0 : 2] = False
    border = int(np.sqrt(len(numbers))) + 1
    for i in range(2, border):
        if numbers[i]:
            numbers[::i] = False
            numbers[i] = True
    return np.where(numbers)[0]

start = time.time()
primes = prime(int(1e6))
end = time.time()
print(primes)
print("time: {}".format(end - start))


