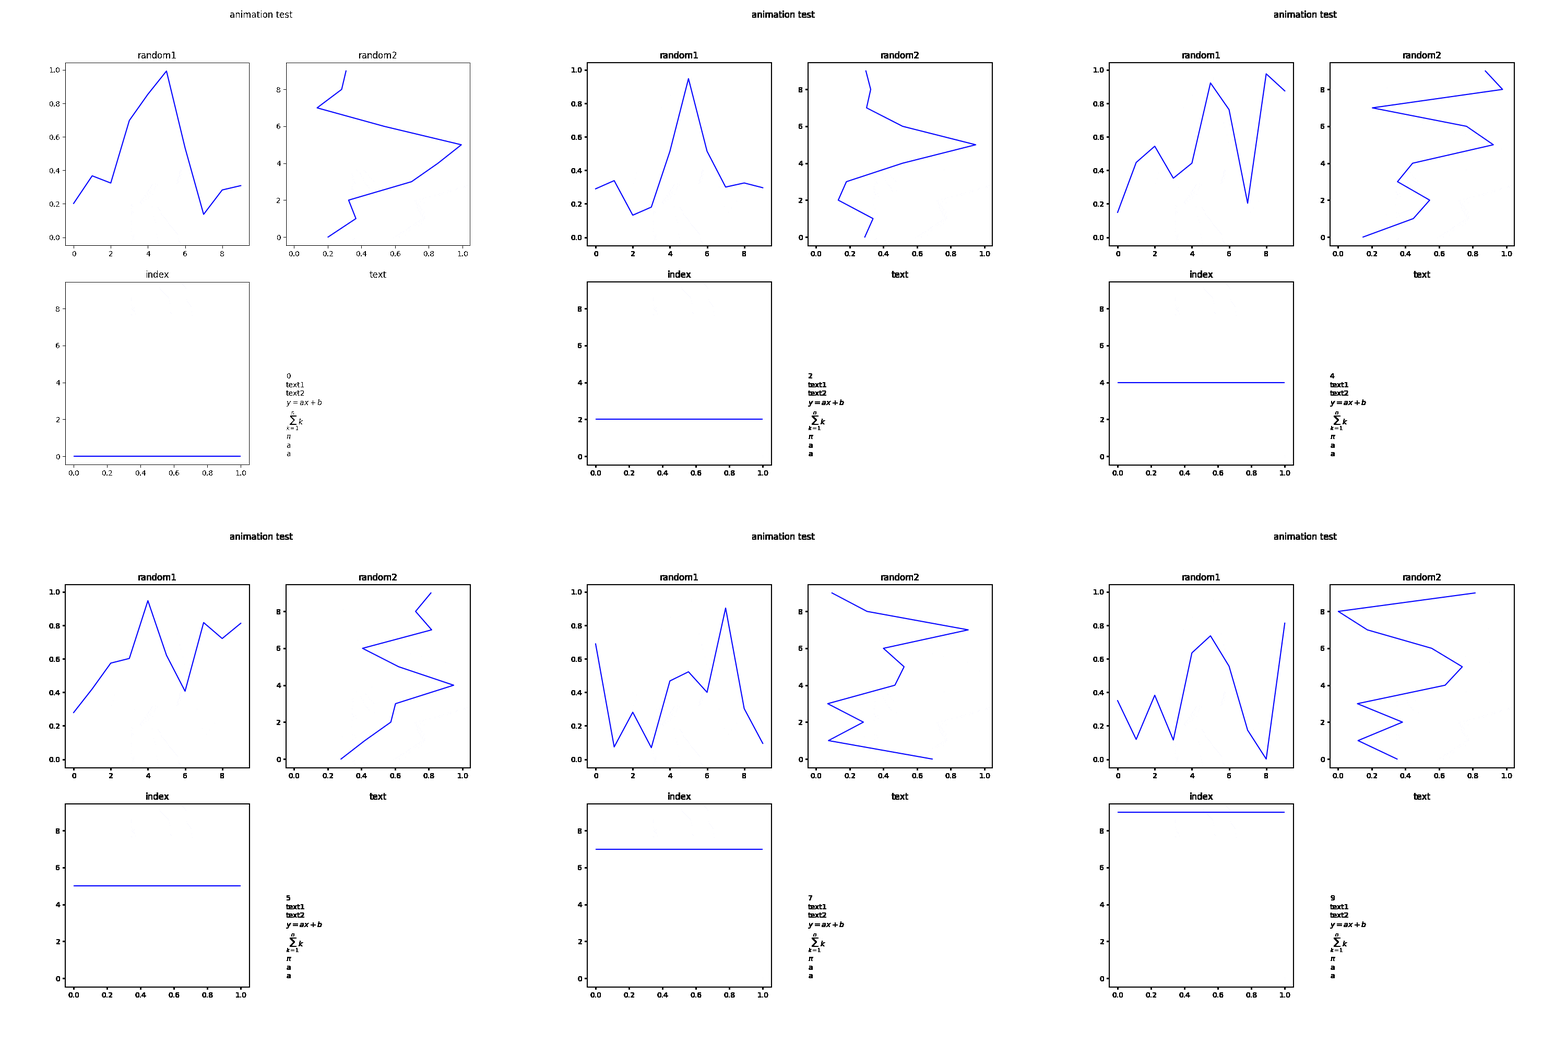
matplotlib を使って,複数の subplot を含む figure のアニメーションを生成する.
コード
#show animations inline (jupyter notebook)
%matplotlib nbagg

#import packages
import matplotlib.pyplot as plt
from matplotlib.animation import ArtistAnimation
import numpy as np

fig, ((ax1, ax2) ,(ax3, ax4))= plt.subplots(2,2,figsize=(10,10))

fig.suptitle("animation test")
ax1.set_title('random1')
ax2.set_title('random2')
ax3.set_title('index')
ax4.set_title('text')
ax4.axis('off')

artists = []

x = np.arange(10)
for i in range(10):
    y = np.random.rand(10)
    im1 = ax1.plot(x, y, color='b')#artist list
    im2 = ax2.plot(y, x, color='b')#artist list
    im3 = [ax3.hlines(y=i,xmin = 0, xmax = 1, color='b')] #artist -> artist list using []
    im4 = [ax4.text(0,0,str(i)+"\ntext1\ntext2\n$y=ax+b$\n$\sum_{k=1}^n k$\n$\pi$\na\na\n")] #artist -> artist list using []
    artists.append(im1+im2+im3+im4) #sum of subplots images = fig image

anim = ArtistAnimation(fig, artists, interval=1000)

anim.save('anim.gif', writer='imagemagick', fps=4)
anim.save('anim.mp4', writer='ffmpeg', fps=4)

fig.show()
生成したアニメーション
説明
アニメーションの表示設定
%matplotlib nbagg
Jupyter notebook 上であれば,これを記述しておけば面倒な設定をしなくてもアニメーションをインライン表示できる.
プロットエリアの設定
fig, ((ax1, ax2) ,(ax3, ax4))= plt.subplots(2,2,figsize=(10,10))
図(fig)下に subglaph(ax1~4)を配置.
fig
┣━ ax1
┣━ ax2
┣━ ax3
┗━ ax4
以下でも同様.
fig = plt.figure(figsize=(10,10))
ax1 = fig.add_subplot(221)
ax2 = fig.add_subplot(222)
ax3 = fig.add_subplot(223)
ax4 = fig.add_subplot(224)
タイトルやラベルの設定
fig.suptitle("animation test")
ax1.set_title('random1')
ax2.set_title('random2')
ax3.set_title('index')
ax4.set_title('text')
ax4.axis('off')
値をプロットする前に,アニメーションで更新されないタイトルやラベルの設定をしておく.
アニメーションのコマのリストを作成
- イメージ1:
artists = [コマ,コマ,...,コマ] - イメージ2:
artists = [[artist],[artist],...,[artist]] - イメージ3:
artists = [image,image,...,image]
artists = []

x = np.arange(10)
for i in range(10):
    y = np.random.rand(10)
    im1 = ax1.plot(x, y, color='b')#artist list
    im2 = ax2.plot(y, x, color='b')#artist list
    im3 = [ax3.hlines(y=i,xmin = 0, xmax = 1, color='b')] #artist -> artist list using []
    im4 = [plt.text(0,0,str(i)+"\ntext1\ntext2\n$y=ax+b$\n$\sum_{k=1}^n k$\n$\pi$\na\na\n")] #artist -> artist list using []
    artists.append(im1+im2+im3+im4) #sum of subplots images = fig image
-
plot 時の戻り値が artist なのか, artist list なのかで,[] で囲む必要があったりなかったりするので注意.
- [] が不要なものの例:
- plot
- [] が必要なものの例:
- scatter
- hlines
- text
- [] が不要なものの例:
-
各 subgraph をプロットする際の image を すべて足すと,fig 全体の image(アニメーションの 1 コマ)になる.
アニメーションの生成
anim = ArtistAnimation(fig, artists, interval=1000)
アニメーションの保存
anim.save('anim.gif', writer='imagemagick', fps=4)
anim.save('anim.mp4', writer='ffmpeg', fps=4)
アニメーションを保存するためには,事前に下記をインストールしておく必要がある.
gif として保存するために必要:
brew install imagemagick
mp4 として保存するために必要:
brew install ffmpeg
