はじめに
統計検定2級の範囲の単回帰分析について学んでいきます
🔷 単回帰分析とは?
💡 定義
単回帰分析とは、1つの説明変数xから、目的変数yを予測・説明しようとする統計モデルです。
たとえば、「世帯主収入x」から「消費支出y」を予測する、といった使い方ができます。
🔢 数式の形
$$
y = \beta_0 + \beta_1 x + \varepsilon
$$
- $y$:目的変数(例:消費支出)
- $x$:説明変数(例:世帯主収入)
- $\beta_0$:切片(x = 0 のときの予測値)
- $\beta_1$:傾き(x が 1 単位増えたとき、y がどれだけ増えるか)
- $\varepsilon$:誤差(実測値と予測値のズレ)
🧭 解釈の例
たとえば回帰式が以下のように推定された場合:
$$
\hat{y} = 14.39 + 0.41x
$$
この式の意味は次のとおりです:
- 世帯主収入が 0万円 でも、消費支出は 14.39万円 発生する(=固定的な支出)
- 世帯主収入が 1万円 増えると、消費支出が 約0.41万円(4,100円) 増える傾向がある
📊 単回帰分析でできること
| 内容 | 例 |
|---|---|
| 予測 | 世帯主収入が40万円のときの消費支出を予測する |
| 関係性の評価 | 世帯主収入が増えれば、消費支出も増えるかを分析する |
| 傾きの意味の解釈 | 収入が1万円増えると支出がどのくらい増えるか |
📘 単回帰分析の例題
ある自治体では、10世帯について「世帯主収入(万円)」と「消費支出(万円)」を調査しました。以下のデータがあります:
| 世帯主収入 ($x$) | 消費支出 ($y$) |
|---|---|
| 20 | 22 |
| 25 | 24 |
| 30 | 26 |
| 35 | 27 |
| 40 | 29 |
| 45 | 31 |
| 50 | 32 |
| 55 | 34 |
| 60 | 35 |
| 65 | 37 |
❓ 問題
- 回帰式($y = \beta_0 + \beta_1 x$)を最小二乗法で求めなさい
- 傾き $\beta_1$ の意味を説明しなさい
- 世帯主収入が70万円のとき、消費支出の予測値を求めなさい
✅ ステップ1:平均を求める
$$
\bar{x} = \frac{20 + 25 + \cdots + 65}{10} = 42.5 \
\bar{y} = \frac{22 + 24 + \cdots + 37}{10} = 29.7
$$
✅ ステップ2:傾き を求める
傾きの公式:
$$
\beta_1 = \frac{\sum (x_i - \bar{x})(y_i - \bar{y})}{\sum (x_i - \bar{x})^2}
$$
計算表:
| $x_i$ | $y_i$ | $x_i - \bar{x}$ | $y_i - \bar{y}$ | $(x_i - \bar{x})(y_i - \bar{y})$ | $(x_i - \bar{x})^2$ |
|---|---|---|---|---|---|
| 20 | 22 | -22.5 | -7.7 | 173.25 | 506.25 |
| 25 | 24 | -17.5 | -5.7 | 99.75 | 306.25 |
| 30 | 26 | -12.5 | -3.7 | 46.25 | 156.25 |
| 35 | 27 | -7.5 | -2.7 | 20.25 | 56.25 |
| 40 | 29 | -2.5 | -0.7 | 1.75 | 6.25 |
| 45 | 31 | 2.5 | 1.3 | 3.25 | 6.25 |
| 50 | 32 | 7.5 | 2.3 | 17.25 | 56.25 |
| 55 | 34 | 12.5 | 4.3 | 53.75 | 156.25 |
| 60 | 35 | 17.5 | 5.3 | 92.75 | 306.25 |
| 65 | 37 | 22.5 | 7.3 | 164.25 | 506.25 |
| 672.5 | 2062.5 |
したがって:
$$
\beta_1 = \frac{672.5}{2062.5} \approx 0.3262
$$
✅ ステップ3:切片 $\ beta_0$ を求める
$$
\beta_0 = \bar{y} - \beta_1 \bar{x} = 29.7 - 0.3262 \times 42.5 \approx 15.82
$$
✅ 回帰式の完成
$$
\hat{y} = 15.82 + 0.3262x
$$
✅ 予測例
たとえば、$x = 70$ のとき:
$$
\hat{y} = 15.82 + 0.3262 \times 70 = 38.65
$$
つまり、世帯主収入が70万円のとき、消費支出は約38.7万円と予測される。
# 📌 Google Colab専用:日本語フォントのインストール
!apt-get -y install fonts-ipafont-gothic > /dev/null
import matplotlib.pyplot as plt
from matplotlib.font_manager import FontProperties
import pandas as pd
# 日本語フォント設定
jp_font = FontProperties(fname="/usr/share/fonts/opentype/ipafont-gothic/ipag.ttf")
plt.rcParams['font.family'] = jp_font.get_name()
# データ
x = [20, 25, 30, 35, 40, 45, 50, 55, 60, 65]
y = [22, 24, 26, 27, 29, 31, 32, 34, 35, 37]
# 平均
x_bar = sum(x) / len(x)
y_bar = sum(y) / len(y)
# 傾きと切片の計算
sum_xy = sum((xi - x_bar) * (yi - y_bar) for xi, yi in zip(x, y))
sum_xx = sum((xi - x_bar)**2 for xi in x)
beta1 = sum_xy / sum_xx
beta0 = y_bar - beta1 * x_bar
# 回帰直線用データ
x_pred = list(range(15, 75))
y_pred = [beta0 + beta1 * xi for xi in x_pred]
# 散布図と回帰直線を描画
plt.figure(figsize=(8, 6))
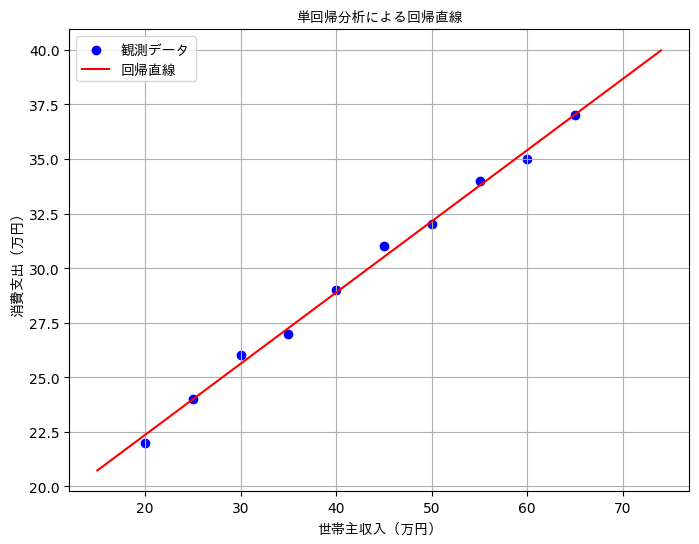
plt.scatter(x, y, color='blue', label='観測データ')
plt.plot(x_pred, y_pred, color='red', label='回帰直線')
plt.xlabel('世帯主収入(万円)', fontproperties=jp_font)
plt.ylabel('消費支出(万円)', fontproperties=jp_font)
plt.title('単回帰分析による回帰直線', fontproperties=jp_font)
plt.legend(prop=jp_font)
plt.grid(True)
plt.show()