継続学習
継続学習とはモデルが長い期間次々と与えられる新しいデータに対して連続的に学習すること
詳しくは継続学習についてまとめたスライド参照
今回は分布外検知の手法を利用した継続学習の論文を実装する
論文タイトル: A Simple Unified Framework for Detecting Out-of-Distribution Samples and Adversarial Attacks
論文の概要: 分布外データを新しいクラスのデータとみなし,深層モデルの特徴空間上でガウシアンフィッティングを行い,古いクラスと新しいクラスの平均ベクトルとのマハラノビス距離をもとにテストデータを分類する.
論文の詳しい解説はスライドの2つ目にかいた
この論文の強みはこれまで学習したクラスの精度をほぼ落とさずに継続学習が可能であり,新たに追加されたクラスのデータを利用したDNNのパラメータの再学習が必要がないことである.
そのため,クラス数が追加で増えても非常に高速に学習ができる.
実装の問題設定
- CIFAR10の0~4番目のクラスが最初に訓練データとして与えられ,追加で5~9番目のクラスの訓練データが次々と与えられる
- 追加で与えられたクラスのデータのみを使って学習し,最初に与えられたクラスのデータを使って再学習することはできない
実装解説
まずは準備
import os

import numpy as np
from sklearn.metrics import confusion_matrix, f1_score, accuracy_score
import matplotlib.pyplot as plt
from PIL import Image

import torch
import torch.nn.functional as F
from torch.utils.data import DataLoader
import torch.nn as nn
from torchvision import transforms as T
from torchvision.datasets import CIFAR10

# Github repo: https://github.com/lukemelas/EfficientNet-PyTorch
# 上記レポジトリのmodelとutilsを同じ階層におくこと
from model import EfficientNet
from tqdm import tqdm
plt.style.use("ggplot")

device = torch.device("cuda" if torch.cuda.is_available() else "cpu")
CIFAR10のクラスを追加できるようにdataloaderを返す関数を用意した
def return_data_loader(classes, train=True, batch_size=128):
    transform = []
    transform.append(T.Resize((64, 64))) # efmodelを使うためにresizeする必要がある
    transform.append(T.ToTensor())
    transform = T.Compose(transform)

    dataset = CIFAR10("./data", train=train, download=True, transform=transform)
    targets = np.array(dataset.targets)
    mask = np.array([t in classes for t in targets])
    dataset.data = dataset.data[mask]
    dataset.targets = targets[mask]

    data_loader = DataLoader(dataset=dataset,
                                  batch_size=batch_size,
                                  shuffle=train)
    return data_loader
モデルとしてefficientnetの一番小さいモデルを利用する
まず,図の青の矢印部分として,普通に5クラスの識別モデルを学習する
次に,赤の矢印部分として一層前の特徴をクラスごとにガウス分布で近似する

NCLASS = 5 # 初期クラス
classes = np.arange(NCLASS)
model = 'efficientnet-b0'
weight_dir = "."

clf = EfficientNet.from_name(model)
clf._fc = torch.nn.Linear(clf._fc.in_features, NCLASS)
clf = clf.to(device)
clf.train()
train_loader = return_data_loader(classes=classes, train=True)

lr = 0.001
epoch_num = 50
criterion = nn.CrossEntropyLoss()
optimizer = torch.optim.Adam(clf.parameters(), lr=lr)

for epoch in tqdm(range(epoch_num)):
    train_loss = 0
    for x, y in train_loader:
        x = x.to(device)
        y = y.to(device)
        logit = clf(x)
        loss = criterion(logit, y)

        optimizer.zero_grad()
        loss.backward()
        optimizer.step()

        train_loss += loss.item()
    train_loss /= len(train_loader.dataset)
torch.save(clf.state_dict(), os.path.join(weight_dir, 'weight.pth'))

test_loader = return_data_loader(range(10), train=False)
clf.load_state_dict(torch.load(os.path.join(weight_dir, 'weight.pth')))
clf.eval()

pred = []
true = []
for x, y in test_loader:
    with torch.no_grad():
            pred.extend(clf(x.to(device)).max(1)[1].detach().cpu().numpy())
            true.extend(y.numpy())
print(accuracy_score(true, pred))
print(confusion_matrix(true, pred))
まずは,普通に識別モデルを学習したときの混合行列と正解率を出力した
0~4番目のクラスしか学習につかっていないため,当然5~9番目のクラスの予測はできず,無理やり0~4番目のクラスを予測するようになっている.
0.4279 # 正解率
[[877  27  47  35  14   0   0   0   0   0]
 [ 14 972   3   8   3   0   0   0   0   0]
 [ 51   7 785  81  76   0   0   0   0   0]
 [ 20  18 107 780  75   0   0   0   0   0]
 [ 13   2  58  62 865   0   0   0   0   0]
 [ 13  12 226 640 109   0   0   0   0   0]
 [ 26  55 232 477 210   0   0   0   0   0]
 [ 47  21 188 230 514   0   0   0   0   0]
 [604 214  53  95  34   0   0   0   0   0]
 [160 705  43  78  14   0   0   0   0   0]]
次に上の図の赤の矢印部分の実装のために,特徴量の平均と共分散を計算する

def ext_feature(x):
    z = clf.extract_features(x)
    z = clf._avg_pooling(z)
    z = z.flatten(start_dim=1)
    return z.detach().cpu().numpy()

train_loaders = [return_data_loader(classes=[c], train=True) for c in range(10)]

z_mean = []
z_var = 0
target_count = []

for c in tqdm(range(NCLASS)): # 既存のクラス
    N = len(train_loaders[c].dataset) # 各クラス数の保持
    target_count.append(N)

    with torch.no_grad():
        # 平均の計算
        new_z_mean = 0
        for x, _ in train_loaders[c]:
            x = x.to(device)
            new_z_mean += ext_feature(x).sum(0) / N
        z_mean.append(new_z_mean)

        # 分散の計算
        for x, _ in train_loaders[c]:
            x = x.to(device)
            z_var += (ext_feature(x) - new_z_mean).T.dot(ext_feature(x) - new_z_mean) / N

C = len(z_mean)
z_var /=  C
z_mean = np.array(z_mean)
target_count = np.array(target_count)
平均と共分散がもとまったらマハラノビス距離を利用して最終層の全結合層なしに分類することが可能である
実装ではベイズの定理を利用している

ここで,$\beta_c$はクラスのデータの個数である
z_var_inv = np.linalg.inv(z_var + np.eye(z_mean.shape[1])*1e-6)
# 逆行列が不安定になるのを防ぐために正則化をいれる
A = z_mean.dot(z_var_inv) # 分子のexpの中身の1項目
B = (A*z_mean).sum(1) * 0.5 # 2項目
beta = np.log(target_count) # 3項目

accs = []
pred = []
true = []
with torch.no_grad():
    for x, y in test_loader:
        x = x.to(device)
        pred.extend((A.dot(ext_feature(x).T) - B[:, None] + beta[:, None]).argmax(0))
        true.extend(y.numpy())
acc = accuracy_score(true, pred)
print(acc)
accs.append(acc)
confusion_matrix(true, pred)
以下の結果より,全結合層使わなくても,ほとんど同じくらいの正解率を達成できることがわかった
0.4273 # 正解率
array([[899,  17,  43,  29,  12,   0,   0,   0,   0,   0],
       [ 25, 958,   6,   9,   2,   0,   0,   0,   0,   0],
       [ 55,   6, 785,  86,  68,   0,   0,   0,   0,   0],
       [ 29,  15, 109, 773,  74,   0,   0,   0,   0,   0],
       [ 23,   2,  55,  62, 858,   0,   0,   0,   0,   0],
       [ 22,   6, 227, 641, 104,   0,   0,   0,   0,   0],
       [ 34,  39, 256, 468, 203,   0,   0,   0,   0,   0],
       [ 71,  16, 199, 214, 500,   0,   0,   0,   0,   0],
       [653, 182,  53,  84,  28,   0,   0,   0,   0,   0],
       [221, 645,  42,  78,  14,   0,   0,   0,   0,   0]])
継続学習の実装
モデルのパラメータの訓練をすることなく,新しいデータの平均と分散をもとに,全てのクラスのテストデータを分類することが目標となる
for c in tqdm(range(NCLASS, 10)): # 新規クラス
    N = len(train_loaders[c].dataset)

    with torch.no_grad():
        # 平均の計算
        new_z_mean = 0
        for x, _ in train_loaders[c]:
            x = x.to(device)
            new_z_mean += ext_feature(x).sum(0) / N


        # 分散の計算
        new_z_var = 0
        for x, _ in train_loaders[c]:
            x = x.to(device)
            new_z_var += (ext_feature(x) - new_z_mean).T.dot(ext_feature(x) - new_z_mean) / N

    #平均と分散の更新
    C = len(target_count)
    z_mean = np.concatenate([z_mean, new_z_mean[None, :]])
    z_var = z_var*C/(C+1) + new_z_var/(C+1)
    target_count = np.append(target_count, N)

    z_var_inv = np.linalg.inv(z_var + np.eye(z_mean.shape[1])*1e-6)
    A = z_mean.dot(z_var_inv)
    B = (A*z_mean).sum(1) * 0.5
    beta = np.log(target_count)
    pred = []
    true = []
    with torch.no_grad():
        for x, y in test_loader:
            x = x.to(device)
            pred.extend((A.dot(ext_feature(x).T) - B[:, None] + beta[:, None]).argmax(0))
            true.extend(y.numpy())
    acc = accuracy_score(true, pred)
    accs.append(acc)
    print(acc)
最終的な結果は以下である
0.4974 # 正解率
array([[635,   1,  18,   4,   2,  14,   9,  36, 260,  21],
       [  1, 761,   0,   1,   0,   0,   8,   3,  21, 205],
       [ 20,   0, 581,  12,   8,  97, 105, 135,  35,   7],
       [  5,   0,  22, 450,  13, 256, 147,  60,  29,  18],
       [  2,   1,  16,  10, 555,  30,  63, 302,  20,   1],
       [  1,   0,  57, 288,  22, 325, 173, 106,  22,   6],
       [  5,   0,  49, 139,  36, 182, 350, 161,  35,  43],
       [  5,   2,  34,  50, 131, 104, 158, 446,  58,  12],
       [226,  26,  13,  11,   3,  22,  58,  41, 430, 170],
       [ 17, 250,   6,   5,   0,   8,  69,  16, 188, 441]])
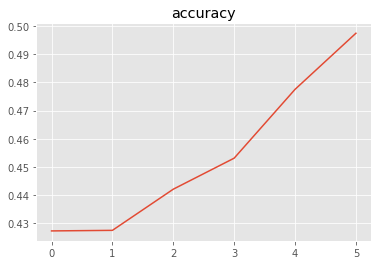
plt.title("accuracy")
plt.plot(accs)
plt.show()
x軸は加えたクラス数を意味する.
最終的に10クラスの訓練データが与えられたときの正解率は,5クラスだけ与えられたときよりも,0.1程度あがっていることがわかる.

