はじめに
pythonの因果推論ライブラリcausalmlの人工データ生成、ベースライン検証機能が便利だったので紹介する記事です。
自作の関数で人工データを作成し、causalmlに検証を行ってもらうコードについても解説しています。
因果推論と人工データ
因果推論では、しばしば人工データが用いられます。なぜなら、因果推論の根本問題という、介入または非介入の片方のデータしか得られない問題のため、通常のデータセットから因果推論の手法の性能を検証することは難しいからです。
そのため、手法間の性能の比較を行うために、シミュレーションにより生成された人工データを用いることはお手軽かつ有効性の高い方法です。
本記事では、causalml.dataset.synthetic_data()による人工データ生成と、causalml.dataset.get_synthetic_summary()によるベースライン手法の適用、可視化についての紹介を行います。
人工データ生成
まず、人工データの生成方法について紹介します。
causalml.dataset.synthetic_data()による人工データ生成は、Nie 2017の実験で用いられた4つの設定でのシミュレーションを行うことができます。
causalml.dataset.synthetic_data(mode=1)などと記述することで人工データを生成できます。
データ生成過程
Nie 2017, causalmlのソースコードを参考に作成
表記
- 共変量:$X_{i}$
- データ数、共変量数は自分で設定できる
- 共変量のうち、効果に影響するのは最初の5つのみ
- 以下の式により生成される
$$X_i = \mathrm{Unif}(0, 1)^d ~~~(\rm{mode=1}) $$
$$X_i = \mathcal{N}(0, I_{d\times d}) ~~~ (\rm{mode\ne1})$$
- データ数、共変量数は自分で設定できる
- 割り当て:$W_i$
- $i$に介入が割り当てられるかどうか
- 傾向スコア$e(X_i)$のベルヌーイ分布により決定される
$$W_i|X_i \sim \mathrm{Bernoulli}(e(X_i))$$
- 効果:$Y_i$
- 共変量$X_{i}$と割り当て$W_i$によって決定される効果
- 以下の式により算出される
- ベースライン主効果:$b(X_i)$
- どのユーザーにも共通の効果
- 治療効果関数:$\tau(X_i)$
- 介入を行った場合と行わなかった場合の差を表す関数
- 因果推論では、この項の大きさを推定したい
- 誤差:$\sigma\varepsilon_i$
- ノイズレベル$\sigma$と$\mathcal{N}(0, 1)$の乗算によって生成される
$$Y_i=b(X_i)+(W_i-0.5)\tau(X_i)+\sigma\varepsilon_i$$
- ノイズレベル$\sigma$と$\mathcal{N}(0, 1)$の乗算によって生成される
- ベースライン主効果:$b(X_i)$
※以下、便宜上 $X_i=x, X_{ij}=x_j $と記載
設定1:simulate_nuisance_and_easy_treatment
$$b(x)=\sin(π x_0 x_1) + 2(x_2 - 0.5)^2 + x_3 +0.5x_4 $$
$$e(x)=\mathrm{trim}_{0.1}\sin(π x_0 x_1)$$
$$\tau(x)=(x_0 + x_1)/2$$
設定2:simulate_randomized_trial
$$b(x)=\max(0, x_0+x_1+x_2) + \max(x_3+x_4)$$
$$e(x)=1/2$$
$$\tau(x)=x_0 + \log(1 + e^{x_1})$$
設定3:simulate_easy_propensity_difficult_baseline
$$b(x)=2\log(1 + e^{x_0+x_1+x_2})$$
$$e(x)=\frac{1}{1+e^{x_1}+e^{x_2}}$$
$$\tau(x)=1$$
設定4:simulate_unrelated_treatment_control
$$b(x)=\max(0, x_0+x_1+x_2) + \max(x_3+x_4)$$
$$e(x)=\frac{1}{1+e^{-x_1}+e^{-x_2}}$$
$$\tau(x)=\max(0, x_0+x_1+x_2) + \max(x_3+x_4)$$
サンプルコード
from causalml.dataset import synthetic_data

# 設定1で人工データを生成
# サンプル数:1000, 共変量数:5, σ=1.0
# numpy配列が返される
y, X, treatment, tau, b, e = synthetic_data(mode=1, n=1000, p=5, sigma=1.0)
ベースライン検証
causalmlには、因果推論の複数の手法を一括で人工データに適用してくれるget_synthetic_summary()関数があるので、解説します。
検証してくれる手法
この記事ではそれぞれの手法についての詳しい解説はしません。
- メタ学習
- 4種類のlearnerと2種類の学習機を組み合わせた、計8種類の手法を検証
- learner
- S-learner
- T-learner
- X-learner
- R-learner
- 学習機
- ロジスティック回帰 (LR)
- XGBoost
- causal tree
上記以外の手法を試したい場合は、ナイーブに実装する必要がありそうです。
指標
3種類の指標で、それぞれの手法の評価を行います。
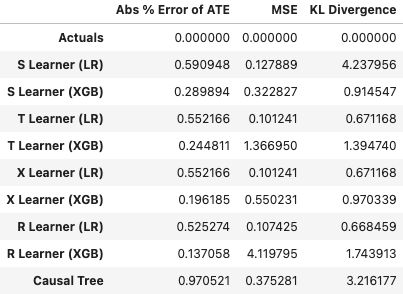
- Abs % Error of ATE:平均処置効果の誤差の%の絶対値
- MSE:平均二乗誤差
- KL Divergense:2つの分布の差異を計る尺度
一回のシミュレーションの予測結果を図示
# まとめて 'from causalml.dataset import * ' でもよい
from causalml.dataset import get_synthetic_preds, simulate_nuisance_and_easy_treatment, scatter_plot_single_sim
import matplotlib.pyplot as plt

# 設定1(simulate_nuisance_and_easy_treatment)でn=1000のデータを生成
# デフォルトのベースライン手法で予測を行う
single_sim_preds = get_synthetic_preds(simulate_nuisance_and_easy_treatment, n=1000)
# 散布図によりそれぞれの性能を比較
scatter_plot_single_sim(single_sim_preds)
# グラフの文字の被りをなくす
plt.tight_layout()
plt.show()
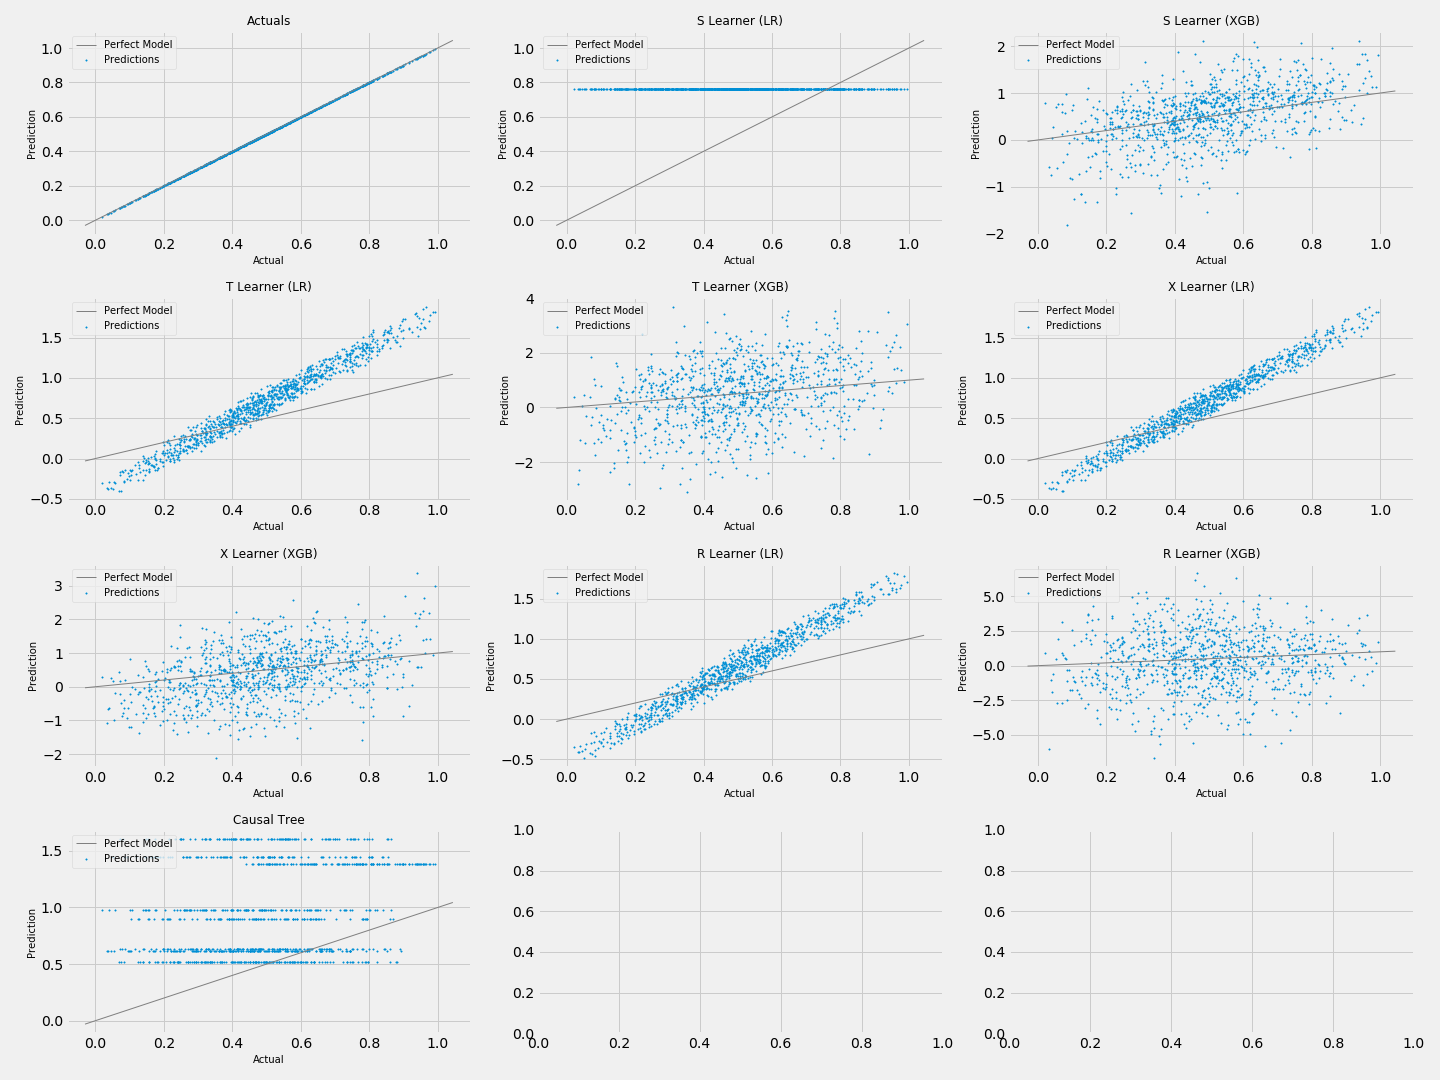
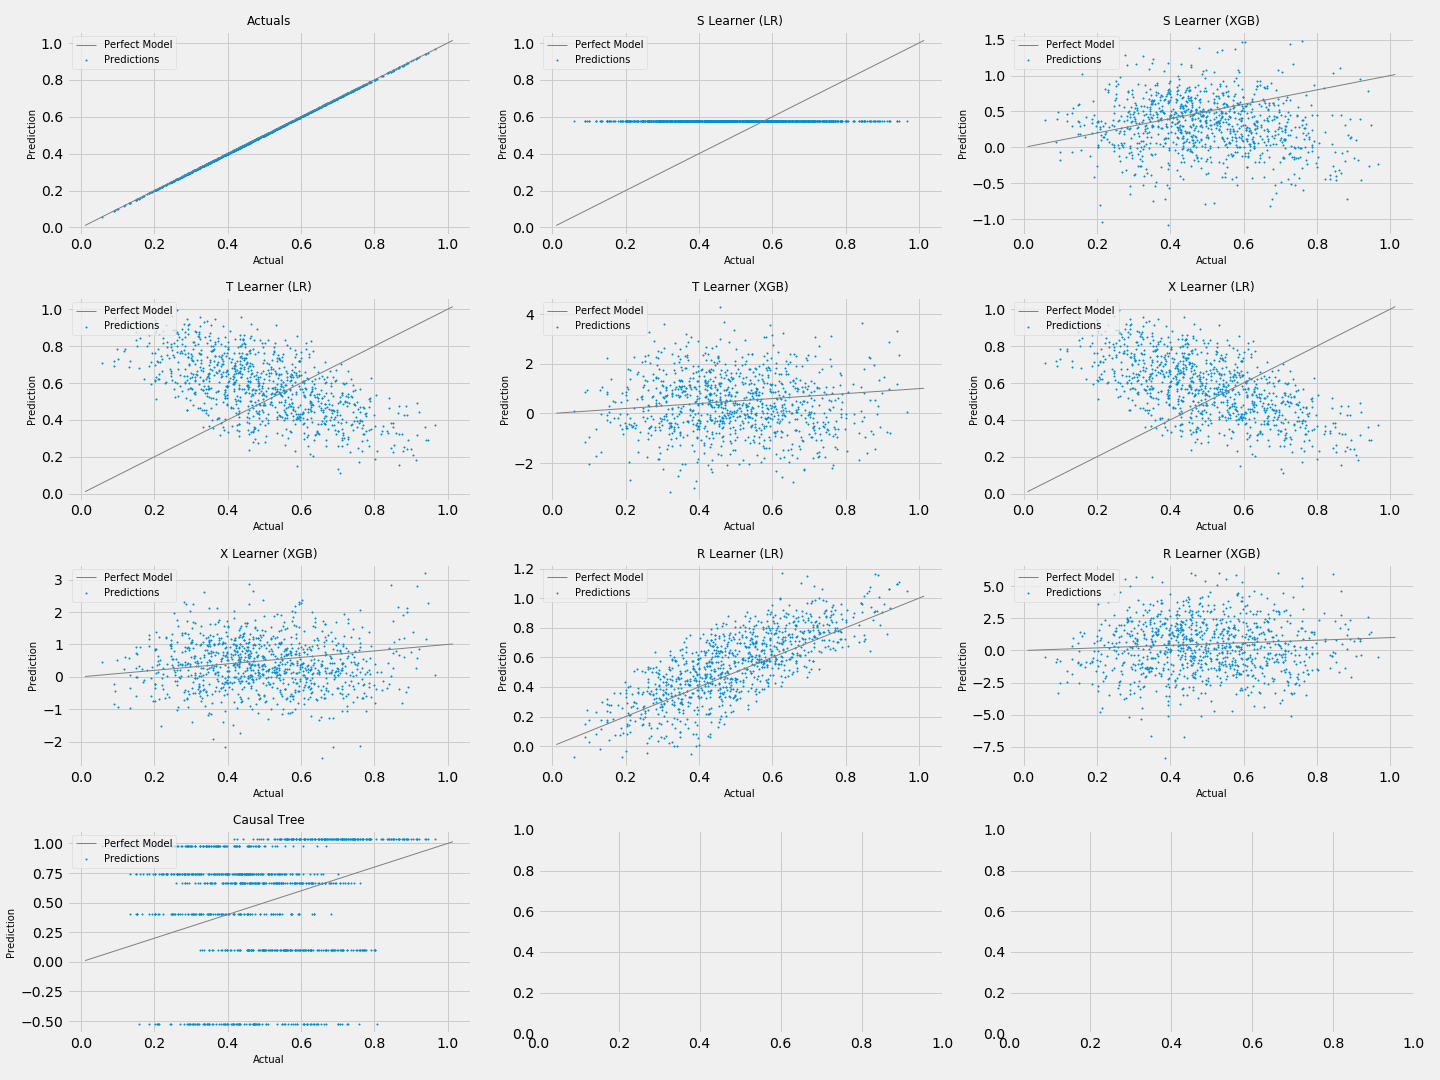
シンプルなコードで上図のように、複数の手法の結果を図示することができます。
今回のコードの場合は、まず設定1で1000個の人工データを生成し、デフォルトの9手法で予測を行い、それぞれの結果を散布図で図示しました。
散布図からは
- LRのS-Learnerの予測値はほぼ0.8弱である
- XGBを用いたメタ学習は予測値のばらつきが大きい
- LRを用いたメタ学習はS-Learner以外は大方予測値の順位は正しそう
- Causal Treeは分岐が不十分で、上手く予測できていない
といったことが読み取れます。
複数回シミュレーションを実施し、各手法の精度を比較
# まとめて 'from causalml.dataset import * ' でもよい
from causalml.dataset import get_synthetic_summary, scatter_plot_summary, bar_plot_summary
# 設定1(simulate_nuisance_and_easy_treatment)でn=1000のデータをk=10回生成
num_simulations = 10
preds_summary = get_synthetic_summary(simulate_nuisance_and_easy_treatment, n=1000, k=num_simulations)
以上のコードにより、「設定1で1000個の人工データを生成し、デフォルトの9手法で予測を行う」という過程を10回繰り返し、pred_summaryに格納しています。ちなみに、pred_summaryは以下のようなデータフレームとなっています。
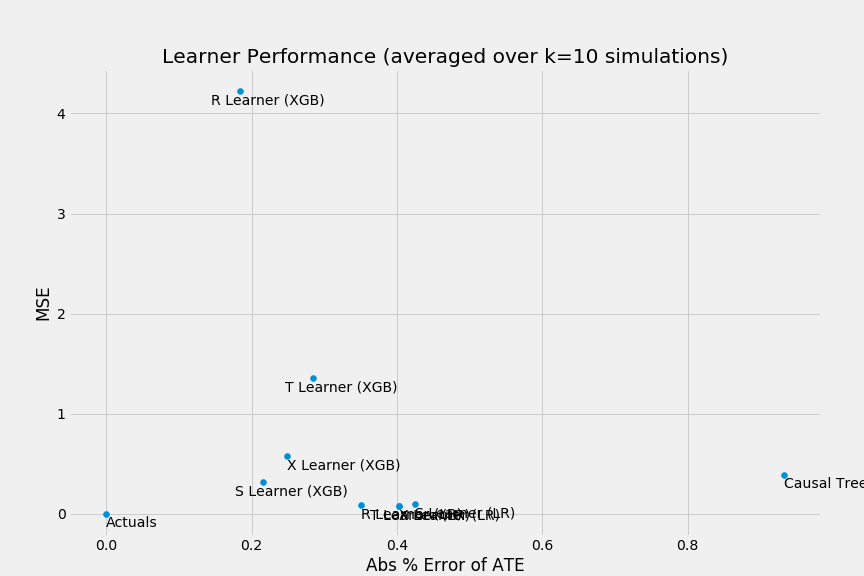
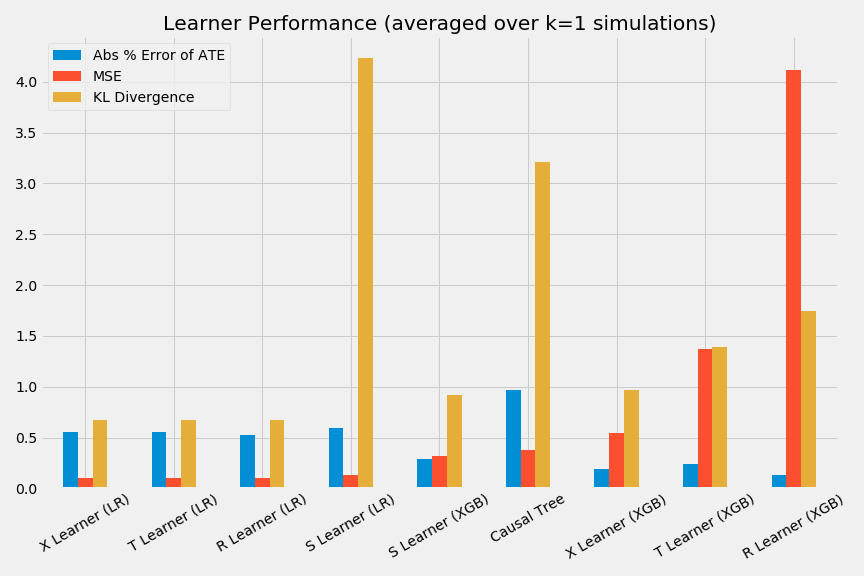
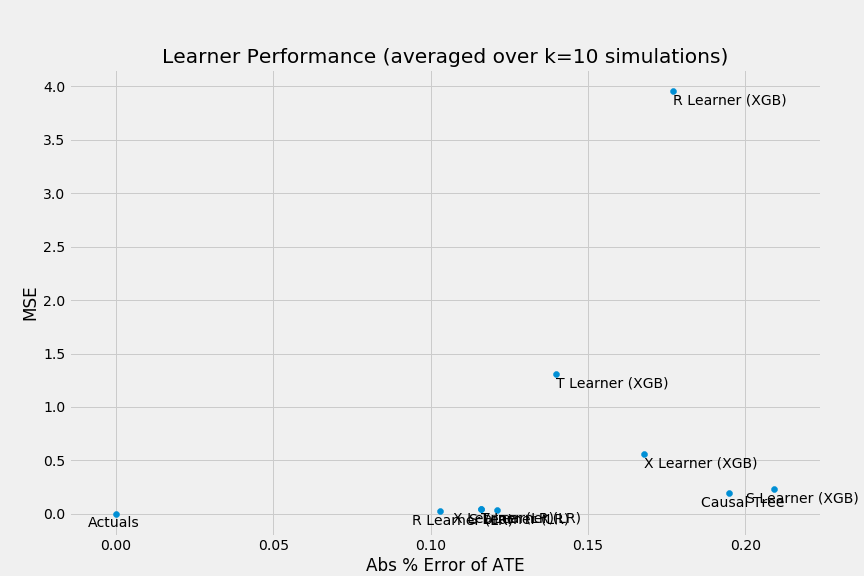
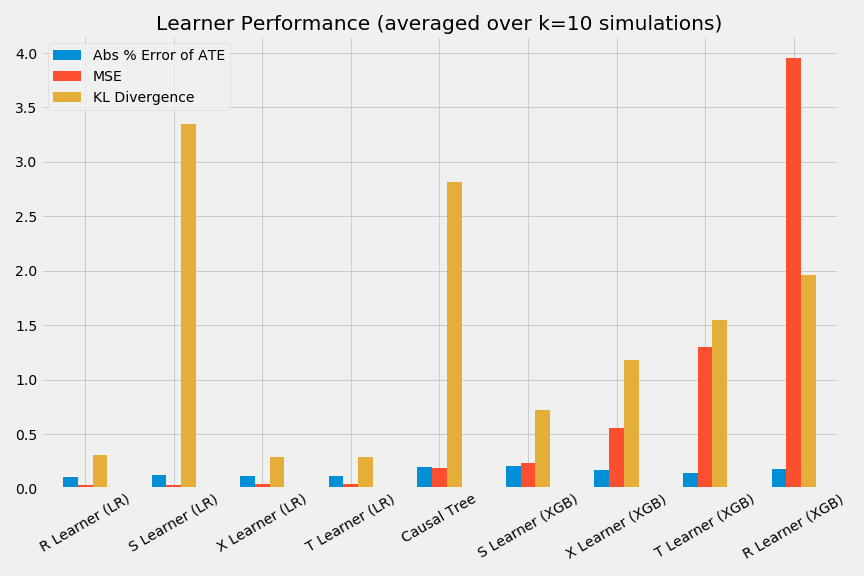
以下のようにして、それぞれの手法の性能を散布図、棒グラフで図示することもできます。
# それぞれの手法の性能の散布図を作成
scatter_plot_summary(preds_summary, k=num_simulations)
# それぞれの手法の性能の棒グラフを作成
bar_plot_summary(preds_summary, k=num_simulations)
自作の関数による人工データの検証
最後に、自作の関数で人工データを作成し、causalmlに検証を行ってもらう方法についても紹介します。
人工データを生成する関数
今回は、設定1を参考にした以下の関数により人工データを生成します。
$$X_i = \mathrm{Unif}(0, 1)^d ~~~(\rm{mode=1}) $$
$$Y_i=b(X_i)+(W_i-0.5)\tau(X_i)+\sigma\varepsilon_i$$
$$b(x)=\cos(π x_0 x_1 x_2) + 2(x_3 - 0.5)^3 + x_4^2 +0.5x_5 $$
$$e(x)=\mathrm{trim}_{0.1}\sin(π x_0 x_1)$$
$$\tau(x)=\frac{x_0 + x_1 + x_2}{3}$$
import numpy as np
from scipy.special import expit, logit

# 自作の人工データ生成関数
def simulate_original_treatment(n=1000, p=5, sigma=1.0, adj=0.):
    X = np.random.uniform(size=n*p).reshape((n, -1))
    b = np.cos(np.pi * X[:, 0] * X[:, 1] * X[:, 2]) + 2 * (X[:, 3] - 0.5) ** 3 + X[:, 4] ** 2 + 0.5 * X[:, 4]
    eta = 0.1
    e = np.maximum(np.repeat(eta, n), np.minimum(np.sin(np.pi * X[:, 0] * X[:, 1]), np.repeat(1-eta, n)))
    e = expit(logit(e) - adj)
    tau = (X[:, 0] + X[:, 1] + X[:, 2]) / 3
    w = np.random.binomial(1, e, size=n)
    y = b + (w - 0.5) * tau + sigma * np.random.normal(size=n)
    return y, X, w, tau, b, e
causalmlによるベースライン検証
これまでと同様にして検証を行うことができます。
一回のシミュレーションの予測結果を図示
# 自作の関数(simulate_original_treatment)でn=1000のデータを生成
# デフォルトのベースライン手法で予測を行う
single_sim_preds = get_synthetic_preds(simulate_original_treatment, n=1000)
# 散布図によりそれぞれの性能を比較
scatter_plot_single_sim(single_sim_preds)
# グラフの文字の被りをなくす
plt.tight_layout()
先程の設定1よりも学習がうまくいっていないことがわかります。
複数回シミュレーションを実施し、各手法の精度を比較
# 自作の関数(simulate_original_treatment)でn=1000のデータをk=10回生成
num_simulations = 10
preds_summary = get_synthetic_summary(simulate_original_treatment, n=1000, k=num_simulations)
# それぞれの手法の性能の散布図を作成
scatter_plot_summary(preds_summary, k=num_simulations)
# それぞれの手法の性能の棒グラフを作成
bar_plot_summary(preds_summary, k=num_simulations)
plt.tight_layout()
精度はともかく、比較は行えました。
おわりに
pythonの因果推論ライブラリcausalmlの人工データ生成、ベースライン検証機能について紹介しました。
