こんにちは。
Leaflet.VectorGrid というものを見つけたので GeoJSON データの読み込みを試してみました(us-maps の county.geo.json (195.67 MB))1。ただし最終段階が遅いことが気になり(下記)、Many Polygons with geojson-vt on Leaflet に比べると、数倍遅い感触です。
loading county.geo.json 1325 ms
parsing 195.67 MB 9515 ms
indexing 3221 features
with 7384329 vertexes and 0 points
adding to map 17426 ms
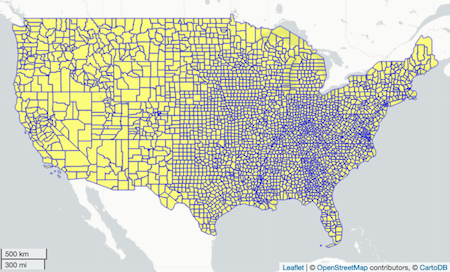
leaflet_vectorgrid.html
<!DOCTYPE html>
<html>
<head>
<title>Leaflet.GridLayer.Vector.Slicer</title>
<meta charset="utf-8" />
<meta name="viewport" content="width=device-width, initial-scale=1.0">
<link rel="stylesheet" href="https://unpkg.com/leaflet@1.3.0/dist/leaflet.css">
<script src="https://unpkg.com/leaflet@1.3.0/dist/leaflet.js"></script>
<script src="https://unpkg.com/leaflet.vectorgrid@1.3.0"></script>
<script src="https://cdn.jsdelivr.net/npm/@turf/turf@5/turf.min.js"></script>
</head>
<body style='margin:0'>
<div id="map" style="width: 100vw; height: 100vh"></div>
<script>
var map = L.map('map');
var dropArea = document.getElementById('map');
var CD_URL = 'http://{s}.basemaps.cartocdn.com/{style}/{z}/{x}/{y}.png';
var CD_ATTR = '© <a href="http://www.openstreetmap.org/copyright">OpenStreetMap</a> contributors, © <a href="http://cartodb.com/attributions">CartoDB</a>';
L.tileLayer( CD_URL, {
attribution: CD_ATTR,
style: 'light_nolabels',
opacity: 1
}).addTo(map);
L.control.scale().addTo(map);
map.setView({lat:0, lng:0}, 2);
dropArea.ondragover = function () {
return false;
};
dropArea.ondragend = function () {
return false;
};
dropArea.ondrop = function (e) {
var reader = new FileReader();
var file = e.dataTransfer.files[0];
reader.readAsText(file, 'utf-8');
var start = new Date().getTime();
reader.onload = function (event) {
var elapsed = new Date().setTime(new Date().getTime() - start);
console.log(`loading ${file.name} ${elapsed} ms`);
try {
var result = event.target.result;
start = new Date().getTime();
var data = JSON.parse(result);
elapsed = new Date().setTime(new Date().getTime() - start);
console.log(`parsing ${humanDataSize(result.length)} ${elapsed} ms`);
var vertCount = countVertex(data);
start = new Date().getTime();
console.log(`indexing ${data.features.length} features`);
console.log(`with ${vertCount[0]} vertexes and ${vertCount[1]} points`);
addGeojsonData(data);
elapsed = new Date().setTime(new Date().getTime() - start);
console.log(`adding to map ${elapsed} ms`);
} catch (err) {
console.log(`${err}`);
}
};
e.preventDefault();
return false;
};
function bboxLeaflet(geojson) {
var bb = turf.bbox(geojson);
return [[bb[1], bb[0]], [bb[3], bb[2]]];
}
function humanDataSize(size) {
var i = Math.floor(Math.log(size) / Math.log(1024));
var siz = [size / Math.pow(1024, i), ['B', 'kB', 'MB', 'GB', 'TB'][i]];
siz[0] = Math.round(siz[0]*100)/100;
return siz.join(' ');
}
function countVertex(data) {
var len, coords, counter = [0,0];
for (var i = data.features.length - 1; i >= 0; i--) {
coords = data.features[i].geometry.coordinates;
len = coords[0].length;
if (len) {
counter[0] += len;
} else {
counter[1] += 1;
}
}
return counter;
}
function addGeojsonData(data) {
map.fitBounds(bboxLeaflet(data));
var vectorGridLayer = L.vectorGrid.slicer( data, {
rendererFactory: L.svg.tile,
maxZoom: 20,
interactive: true,
vectorTileLayerStyles: {
sliced: function(properties, zoom) {
return {
fillColor: "yellow",
fillOpacity: 0.5,
stroke: true,
fill: true,
color: 'blue',
weight: 0.7,
}
}
},
})
.addTo(map);
}
</script>
</body>
</html>