はじめに
Leaflet でバイナリベクトルタイル (pbf とか mvt) を表示するプラグインとしてはLeaflet.MapboxVectorTile がよく使われているのですが、残念ながら現行の version1.x な Leaflet では動作しません。[Issues] (https://github.com/SpatialServer/Leaflet.MapboxVectorTile/issues/78) によると
Leaflet.VectorGrid supports Leaflet 1.x
とのことなので、ここでは最新の Leaflet と Leaflet.VectorGrid を使ってバイナリベクトルタイルを表示してみましょう。
やってみた
こんなコードが
<!DOCTYPE html>
<html>

<head>
  <meta charset="UTF-8">
  <title>Hello L.VectorGrid.Protobuf</title>
  <meta name="viewport" content="initial-scale=1.0, maximum-scale=1.0" />
  <link rel="stylesheet" href="https://unpkg.com/leaflet@1.3.4/dist/leaflet.css" />
  <script src="https://unpkg.com/leaflet@1.3.4/dist/leaflet.js"></script>
  <script src="https://unpkg.com/leaflet.vectorgrid@1.3.0/dist/Leaflet.VectorGrid.bundled.min.js"></script>
</head>

<body>
  <div id="map" style="position:absolute;top:0;left:0;bottom:0;right:0;"></div>
  <script>
    var map = L.map("map", {
      maxZoom: 19,
      zoom: 15,
      center: [42.7450, 141.9123]
    });

    L.tileLayer('https://maps.gsi.go.jp/xyz/20180906hokkaido_atsuma_0906do/{z}/{x}/{y}.png', {
      attribution: "<a href='https://maps.gsi.go.jp/development/ichiran.html' target='_blank'>地理院タイル</a>",
      minZoom: 10,
      maxNativeZoom: 18
    }).addTo(map);

    L.vectorGrid.protobuf("https://wata909.github.io/atsuma_mvt/sediment/{z}/{x}/{y}.pbf", {
      attribution: "<a href='https://github.com/koukita/2018_09_06_atumatyou' target='_blank'>この地図は地理院地図 平成30年北海道胆振東部地震 厚真川地区 正射画像をトレースした地図です</a>",
      maxNativeZoom: 14,
      minNativeZoom: 14,
      maxZoom: 18,
      rendererFactory: L.canvas.tile,
      vectorTileLayerStyles: {
        "厚真町堆積土トレース": {
          color: "red",
          weight: 2
        }
      }
    }).addTo(map);
  </script>
</body>

</html>
こんなかんじで表示されます。
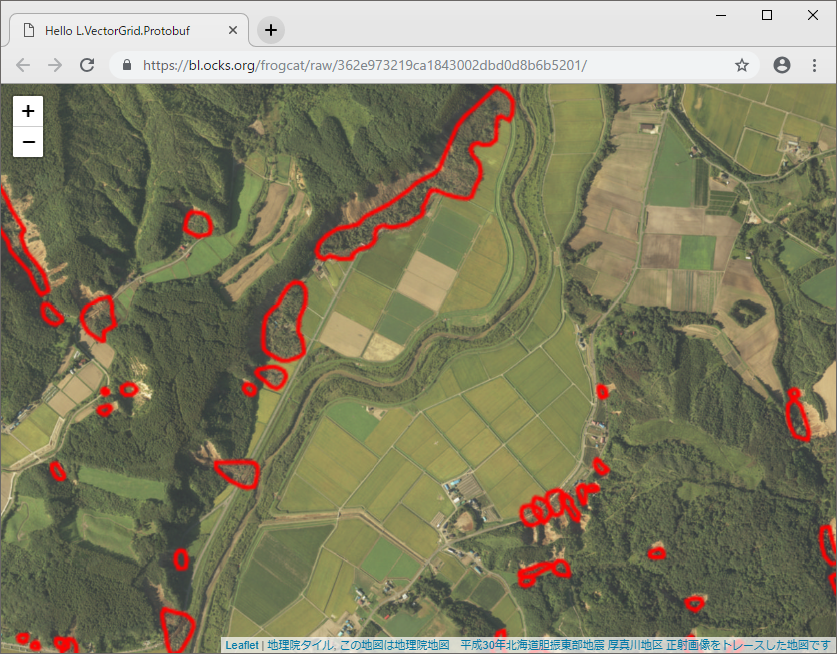
ワーキングデモはこちらからどうぞ。
ノート
- Leaflet.VectorGrid は https://github.com/Leaflet/Leaflet.VectorGrid で開発されている Leaflet のサブプロジェクト
- Leaflet.VectorGrid には巨大な GeoJSON や TopoJSON を扱うクラスもあるけれど、バイナリベクトルタイルを扱う限りは VectorGrid.Protobuf クラスとその親クラスの VectorGrid だけわかっていれば OK
- API ドキュメント → http://leaflet.github.io/Leaflet.VectorGrid/vectorgrid-api-docs.html#vectorgrid-protobuf
- 注意すべきプロパティは
rendererFactoryとvectorTileLayerStyles -
rendererFactoryは結果を Canvas に描くか SVG に描くかを決めている。デフォルトは SVG だけれど、あらかじめ描画要素が多いことがわかっているなら Canvas にしておくとよいかも。 -
vectorTileLayerStylesはスタイルを決定するオブジェクト。レイヤー名をキーとして、{color:"red",fillColor:"orange"}みたいなスタイルオブジェクトやスタイルオブジェクトを返す関数を設定する。くわしくはこちら。
困ったこと
バイナリベクトルタイルの URL だけを教えてもらった場合、中でどんな レイヤー名 が使われているかを知らないと、vectorTilelayerStyles を記述できずに詰む。
とりあえず学習を兼ねてこんな node.js のスクリプトで使用されているレイヤー名のリストをダンプして回避したものの、ベクトルタイルに遭遇するたびにこんな作業やってられるか、という問題も。
inspect.js
const VectorTile = require('@mapbox/vector-tile').VectorTile;
const Protobuf = require('pbf');
const fs = require('fs');

var data = fs.readFileSync(process.argv[2]);
var layers = new VectorTile(new Protobuf(data)).layers

console.log(Object.keys(layers));
つづく。