はじめに
Cisco IOS XEのModel Driven Telemetry環境を構築した時のメモです。
構築にあたり、以下記事を参考にさせて頂きました。初心者が下手にカスタマイズするとハマりそうなので、まずは同じツールセットで構築しています。
Telegrafのcisco_telemetry_mdtプラグインを試してみた
そもそもTelemetryが何なのか?については以下資料を参考にしています。
Cisco Model Driven Telemetryの参考資料メモ
1. 用意した環境
AWS上にルータとサーバを立てました。Telemetryに必要なツールは、Dockerアプリでも提供されていますが、今回はサーバに直接インストールしています。
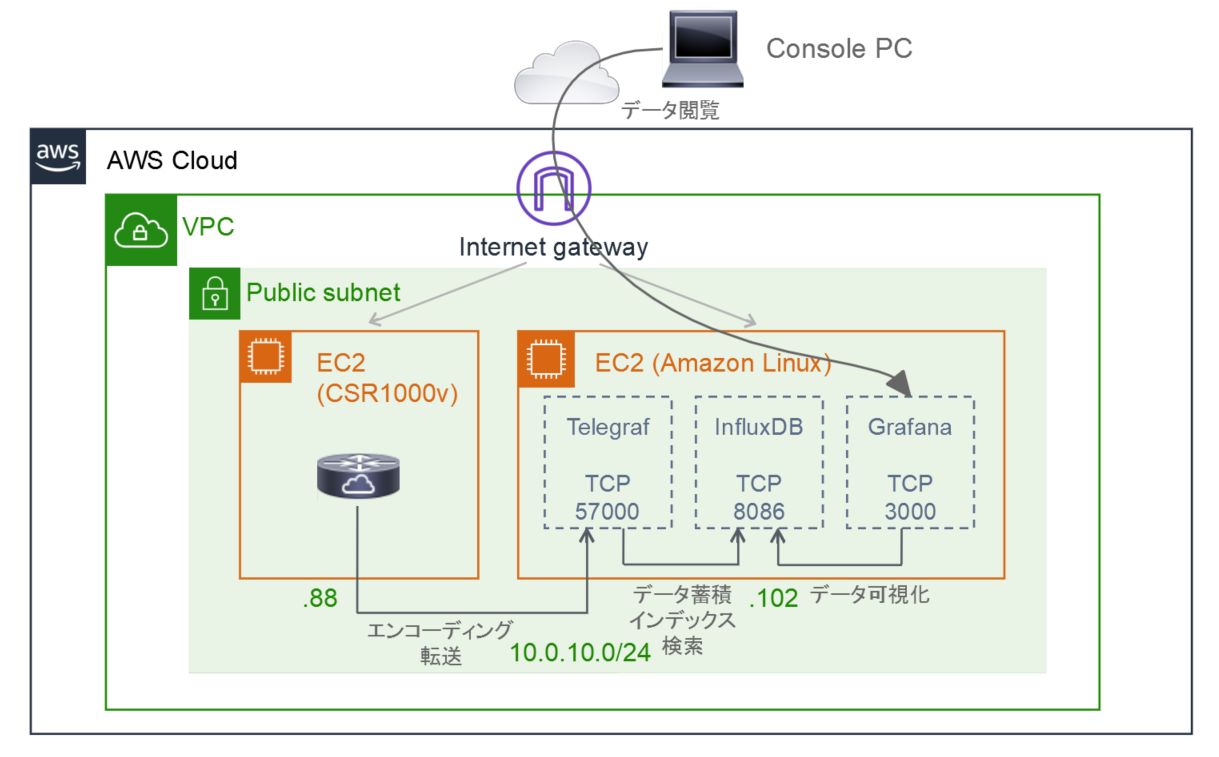
- ルータ
- Product: Cisco CSR1000v - Security Pkg. Max Performance
- Version: 16.10.1b ※今回使うプロトコルgRPC(Dial Out)は16.10以降でサポート。
- EC2 Instance Type: t2.medium ※2vCPU、メモリ4GB
- Free Trialで1ヶ月はソフトウェア使用量は無料。ただし、EC2利用料はt2.mediumで1時間当たり0.046ドル程度かかる。
- サーバ
- AMI: Amazon Linux 2
- EC2 Instance Type: t2.medium
- Telegraf 2019.8.16 Nightly Build(Collector)
- InfluxDB 1.7.7(Datastore)
- Grafana 6.3.3(Dashboard)
ちなみに、CSR1000vはCisco DevNet Sandboxからも提供されています。
IOS XE on CSR Latest Code(Current Version: 16.11)
サーバとして同環境内のDevBox(Linux)もしくは自分の環境を使っても同じ事ができるかもしれません。
2. ルータのセットアップ
(1) netconf-yangの有効化
NETCONFを使わない場合でも、Telemetryで本設定は必須です。
Router(config)# netconf-yang
設定後、以下のshowコマンドを実行し、一番下の「pubd」が「Running」になっていることを確認します。
Router# show platform software yang-management process

confd            : Running
nesd             : Running
syncfd           : Running
ncsshd           : Running
dmiauthd         : Running
vtyserverutild   : Running
opdatamgrd       : Running
nginx            : Running
ndbmand          : Running
pubd             : Running
*pubdの主な役割は、Model Driven Telemetryで使用するpublication manager および publisherです。
(2) Telemetry設定
設定例をいくつかご紹介します。設定方法や確認コマンドの詳細はこちらを参照願います。
Programmability Configuration Guide, Cisco IOS XE Gibraltar 16.10.x
設定例1: メモリ使用量を10秒間隔で送信
グローバルコンフィグレーションモードで以下コマンドを実行します。IPアドレスは環境に合わせて変更願います。
telemetry ietf subscription 501
 encoding encode-kvgpb
 filter xpath /memory-ios-xe-oper:memory-statistics/memory-statistic
 source-address 10.0.10.88
 stream yang-push
 update-policy periodic 1000
 receiver ip address 10.0.10.102 57000 protocol grpc-tcp
end
showコマンドで、設定が問題なく反映されていることを確認します。
Router#sh telemetry ietf subscription 501 detail
Telemetry subscription detail:

  Subscription ID: 501
  Type: Configured
  State: Valid
  Stream: yang-push
  Filter:
    Filter type: xpath
    XPath: /memory-ios-xe-oper:memory-statistics/memory-statistic
  Update policy:
    Update Trigger: periodic
    Period: 1000
  Encoding: encode-kvgpb
  Source VRF:
  Source Address: 10.0.10.88
  Notes:

  Receivers:
    Address          Port             Protocol         Protocol Profil
    ------------------------------------------------------------------
    10.0.10.102      57000            grpc-tcp
設定例2: CPU使用量を5秒間隔で送信
telemetry ietf subscription 502
 encoding encode-kvgpb
 filter xpath /process-cpu-ios-xe-oper:cpu-usage/cpu-utilization/five-seconds
 source-address 10.0.10.88
 stream yang-push
 update-policy periodic 500
 receiver ip address 10.0.10.102 57000 protocol grpc-tcp
end
Router#sh telemetry ietf subscription 502 detail
Telemetry subscription detail:

  Subscription ID: 502
  Type: Configured
  State: Valid
  Stream: yang-push
  Filter:
    Filter type: xpath
    XPath: /process-cpu-ios-xe-oper:cpu-usage/cpu-utilization/five-seconds
  Update policy:
    Update Trigger: periodic
    Period: 500
  Encoding: encode-kvgpb
  Source VRF:
  Source Address: 10.0.10.88
  Notes:

  Receivers:
    Address          Port             Protocol         Protocol Profil
    ------------------------------------------------------------------
    10.0.10.102      57000            grpc-tcp
設定例3: 全インターフェースのステータス、カウンター情報を10秒間隔で送信
telemetry ietf subscription 503
 encoding encode-kvgpb
 filter xpath /if:interfaces-state
 source-address 10.0.10.88
 stream yang-push
 update-policy periodic 1000
 receiver ip address 10.0.10.102 57000 protocol grpc-tcp
end
(参考)送信対象を、例えばGigabitEthernet1のオペレーション状態のみに限定したい場合、xpathを細かく指定します。
telemetry ietf subscription 503
 filter xpath /if:interfaces-state/interface[name="GigabitEthernet1"]/oper-status
end
Router#sh telemetry ietf subscription 503 detail
Telemetry subscription detail:

  Subscription ID: 503
  Type: Configured
  State: Valid
  Stream: yang-push
  Filter:
    Filter type: xpath
    XPath: /if:interfaces-state
  Update policy:
    Update Trigger: periodic
    Period: 1000
  Encoding: encode-kvgpb
  Source VRF:
  Source Address: 10.0.10.88
  Notes:

  Receivers:
    Address          Port             Protocol         Protocol Profil
    ------------------------------------------------------------------
    10.0.10.102      57000            grpc-tcp
3. Telegraf/InfluxDBのセットアップ
参考URL: GitHub - influxdata/telegraf
(1) Goのインストール
参考URL: Go - Getting Started
こちらから、Linux用の最新版をインストールしました。
$ cd /usr/local
$ sudo wget https://dl.google.com/go/go1.12.9.linux-amd64.tar.gz
$ sudo tar -C /usr/local -xzf go1.12.9.linux-amd64.tar.gz
.profileへ環境変数を追加します。
$ sudo vi $HOME/.profile
export PATH=$PATH:/usr/local/go/bin
環境変数の設定は、次回ログインまで反映されない可能性があります。すぐに反映させるため、以下コマンドを実行します。
$ source $HOME/.profile
以下コマンドを実行し、コマンド使用方法が出力されることを確認します。
$ go --help
Go is a tool for managing Go source code.

Usage:

        go <command> [arguments]

The commands are:

        bug         start a bug report
        build       compile packages and dependencies
        clean       remove object files and cached files
        doc         show documentation for package or symbol
        env         print Go environment information
        fix         update packages to use new APIs
        fmt         gofmt (reformat) package sources
        generate    generate Go files by processing source
        get         download and install packages and dependencies
        install     compile and install packages and dependencies
        list        list packages or modules
        mod         module maintenance
        run         compile and run Go program
        test        test packages
        tool        run specified go tool
        version     print Go version
        vet         report likely mistakes in packages
(省略)
(2) depのインストール
参考URL:
Gitがインストールされていない場合は、インストールを行います。
$ sudo yum install -y git
Goのパッケージ管理ツールである、depをインストールします。
$ go get -u github.com/golang/dep/cmd/dep
.bash_profileへ環境変数を追加します。
$ sudo vi $HOME/.bash_profile
# User specific environment and startup programs
export GOPATH=$HOME/go   # 新規追加
PATH=(既存設定):$GOPATH/bin:$PATH   # 既存設定の末尾に「:$GOPATH/bin:$PATH」を追加

export PATH
(1)と同様、すぐに反映させるため、以下コマンドを実行します。
$ source $HOME/.bash_profile
以下コマンドを実行し、コマンド使用方法が出力されることを確認します。
$ dep --help
Dep is a tool for managing dependencies for Go projects

Usage: "dep [command]"

Commands:

  init     Set up a new Go project, or migrate an existing one
  status   Report the status of the project's dependencies
  ensure   Ensure a dependency is safely vendored in the project
  version  Show the dep version information
  check    Check if imports, Gopkg.toml, and Gopkg.lock are in sync

Examples:
  dep init                               set up a new project
  dep ensure                             install the project's dependencies
  dep ensure -update                     update the locked versions of all dependencies
  dep ensure -add github.com/pkg/errors  add a dependency to the project

Use "dep help [command]" for more information about a command.
(3) Telegrafのインストール
今回はNightly Build(開発中の最新ビルド)をインストールしました。安定版がうまく動かなかった訳ではなく、特に理由はないですw
$ sudo wget https://dl.influxdata.com/telegraf/nightlies/telegraf-nightly.x86_64.rpm
$ sudo yum install -y telegraf-nightly.x86_64.rpm
以下コマンドを実行し、コマンド使用方法が出力されることを確認します。
$ telegraf --help
Telegraf, The plugin-driven server agent for collecting and reporting metrics.

Usage:

  telegraf [commands|flags]

The commands & flags are:

  config              print out full sample configuration to stdout
  version             print the version to stdout
(省略)
(4) InfluxDBのインストール、起動
参考URL: influxdata - Introducing InfluxDB
バージョン1.7.7をインストールしました。
$ sudo wget https://dl.influxdata.com/influxdb/releases/influxdb-1.7.7.x86_64.rpm
$ sudo yum localinstall -y influxdb-1.7.7.x86_64.rpm
続いて、以下コマンドで起動を行います。
$ sudo service influxdb start
(5) Telegrafの設定
参考URL:
- Telegrafのcisco_telemetry_mdtプラグインを試してみた
- GitHub - influxdata/telegraf/plugins/inputs/cisco_telemetry_mdt
Telegrafの設定ファイルの雛形を作り、エディタでファイルを編集します。
$ telegraf -sample-config --input-filter cisco_telemetry_mdt > telemetry.conf
$ sudo vi /etc/telegraf/telegraf.conf
具体的な編集内容は以下の2点です。
①InfluxDB向けアウトプットプラグインの内、urlsとdatabaseのコメントアウトを削除。
# Configuration for sending metrics to InfluxDB
[[outputs.influxdb]]
  ## The full HTTP or UDP URL for your InfluxDB instance.
  ##
  ## Multiple URLs can be specified for a single cluster, only ONE of the
  ## urls will be written to each interval.
  # urls = ["unix:///var/run/influxdb.sock"]
  # urls = ["udp://127.0.0.1:8089"]
  urls = ["http://127.0.0.1:8086"]

  ## The target database for metrics; will be created as needed.
  ## For UDP url endpoint database needs to be configured on server side.
  database = "telegraf"
②cisco_telemetry_mdt向けインプットプラグインの内、transport、service_addressのコメントアウトを削除。加えて、エイリアス設定のコメントアウトも削除。
# Cisco model-driven telemetry (MDT) input plugin for IOS XR, IOS XE and NX-OS platforms
[[inputs.cisco_telemetry_mdt]]
 ## Telemetry transport (one of: tcp, grpc)
 transport = "grpc"

 ## Address and port to host telemetry listener
 service_address = ":57000"

 ## Enable TLS for GRPC transport
 # tls_cert = "/etc/telegraf/cert.pem"
 # tls_key = "/etc/telegraf/key.pem"

 ## Enable TLS client authentication and define allowed CA certificates
 # tls_allowed_cacerts = ["/etc/telegraf/clientca.pem"]

 ## Define aliases to map telemetry encoding paths to simple measurement names
 [inputs.cisco_telemetry_mdt.aliases]
   ifstats = "ietf-interfaces:interfaces-state/interface/statistics"
(6) Telegrafの起動、DB検索
参考URL: InfluxDB入門
以下コマンドで起動を行います。
$ telegraf -config telemetry.conf
別のターミナルからInfluxDBのデータベースtelegrafにアクセスします。
$ influx -database 'telegraf' -host 'localhost' -port '8086'
Connected to http://localhost:8086 version 1.7.7
InfluxDB shell version: 1.7.7
プロンプト>が表示されたら、Influx Query Language(InfluxQL)というSQLライクなクエリ言語を使って、DB操作をしていきます。
(参考)データベースとアカウント作成
データベースの作成は、create database telegrafで行います。今回は明示的に作成しなくてもOKでした。データベース一覧はshow databasesで確認できます。
ユーザ単位でアクセス管理したい場合、create user <ユーザ名> with password '<パスワード>'でアカウント作成可能です。今回は個人用の環境なので、特に作成していません。ユーザ一覧はshow usersで確認できます。
これ以降で、ルータから送信された情報がDBに登録されているか確認していきます。
設定例1: メモリ使用量
コマンド内容は、Cisco-IOS-XE-memory-oper:memory-statistics/memory-statisticというMeasurement(RDBMSで言うところのテーブル)から、フィールドfree_memory、total_memory、used_memoryを抽出しています。
また、LIMITで出力対象を最初の5行に絞っています。
> SELECT "free_memory", "total_memory", "used_memory" FROM "Cisco-IOS-XE-memory-oper:memory-statistics/memory-statistic" LIMIT 5
name: Cisco-IOS-XE-memory-oper:memory-statistics/memory-statistic
time                free_memory total_memory used_memory
----                ----------- ------------ -----------
1565878375310000000 2014987876  2221889640   206901764
1565878375310000000 824         3149400      3148576
1565878380311000000 2014987876  2221889640   206901764
1565878380311000000 824         3149400      3148576
1565878385311000000 2014987876  2221889640   206901764
設定例2: CPU使用量
five_seconds(5秒間の平均CPU使用率)を抽出しています。
> SELECT "five_seconds" FROM "Cisco-IOS-XE-process-cpu-oper:cpu-usage/cpu-utilization" LIMIT 5
name: Cisco-IOS-XE-process-cpu-oper:cpu-usage/cpu-utilization
time                five_seconds
----                ------------
1565980824232000000 0
1565980829232000000 0
1565980834232000000 0
1565980839232000000 0
1565980844232000000 7
設定例3: インターフェースのステータス、カウンター情報
対象ルータは複数のインターフェースを持っていますが、ここではWHERE "name" = 'GigabitEthernet1'で対象をGigabitEthernet1に限定しています。
> SELECT "name", "admin_status", "oper_status", "statistics/in_octets", "statistics/in_errors", "statistics/out_octets", "statistics/out_errors" FROM "ietf-interfaces:interfaces-state/interface" WHERE "name" = 'GigabitEthernet1' LIMIT 5
name: ietf-interfaces:interfaces-state/interface
time                name             admin_status oper_status statistics/in_octets statistics/in_errors statistics/out_octets statistics/out_errors
----                ----             ------------ ----------- -------------------- -------------------- --------------------- ---------------------
1565981720618000000 GigabitEthernet1 up           up          1191410              0                    3318248               0
1565981730618000000 GigabitEthernet1 up           up          1194787              0                    3328513               0
1565981740618000000 GigabitEthernet1 up           up          1195531              0                    3331284               0
1565981750618000000 GigabitEthernet1 up           up          1196275              0                    3334055               0
1565981760618000000 GigabitEthernet1 up           up          1197019              0                    3336826               0
(7) ルータのステータス確認
念のため、ルータがTelegrafと接続できているか確認します。
コマンド実行の結果、Stateが「Connected」になっていればOKです。(6)でDBデータが表示されない場合、Stateが「Connecting」や「Disabled」の状態で、接続できていない可能性があります。
Router#sh telemetry ietf subscription 501 receiver
Telemetry subscription receivers detail:

  Subscription ID: 501
  Address: 10.0.10.102
  Port: 57000
  Protocol: grpc-tcp
  Profile:
  State: Connected
  Explanation:
終わりに
ここまでで、ルータのTelemetryデータをInfluxDB上に格納できました。後編では、Grafanaによるデータの可視化を行っていきます。