はじめに
Telegraf 1.11でCisco Telemetryに対応する以下の2つのプラグインが追加されてました。
cisco_telemetry_mdtプラグインは、Model Driven Telemetryと呼ばれるプレスタンダード(つまりCisco独自)のTelemetryに対応するTelegrafプラグインです。他方、cisco_telemetry_gnmiプラグインは、GNMI Telemetryに対応するTelegrafプラグインです。
今回は、これらうちcisco_telemetry_mdtプラグインを試してみました。
cisco_telemetry_mdtプラグイン
cisco_telemetry_mdtプラグインでされる方式は、以下のとおりです。
- トランスポート
- TCP dialout
- gRPC dialout (w/ or w/o TLS)
- エンコーディング
- GPB-KV (self-describing-gpb)
それぞれの方式とプラットフォームのサポートは、以下のとおりです。
| IOS XR(32-bit) | IOS XR(64-bit) | IOS XE | NX-OS | |
|---|---|---|---|---|
| TCP | yes[*1] | yes[*1] | no | no |
| gRPC | no | yes[*2] | yes[*3] | yes[*4] |
[*1] IOS XR (32-bit and 64-bit) 6.1.x以降
[*2] IOS XR (64-bit) 6.1.x以降
[*3] IOS XE 16.10以降
[*4] NX-OS 7.x以降
GPB-KV(self-describing-gpb)は、Cisco Model Driven Telemetryでのエンコーディング方式です。詳しくは以下の記事を参考にしてください。
実験
さっそく、CSR1000vを使って試してみます。トランスポートはGRPC dialout、エンコーディングはGPB-KVです。
環境
この記事では、以下の環境を用いています。
- CSR1000V IOS XE 16.11.01b
- Ubuntu 16.04.6 LTS
- Telegraf 1.11.1-1
- InfluxDB 1.7.7
- Grafana 6.2.5
ルータの設定
ルータの設定は、以下のとおりです。
netconf-yang
!
telemetry ietf subscription 8
 encoding encode-kvgpb
 filter xpath /memory-ios-xe-oper:memory-statistics/memory-statistic
 stream yang-push
 update-policy periodic 1000
 receiver ip address <telegraf's IP> 57000 protocol grpc-tcp
end
Telegrafの設定
Telegrafの設定ファイルの雛形を作ります。
$ telegraf -sample-config --input-filter cisco_telemetry_mdt > telemetry.conf
InfluxDBアウトプットプラグインの設定をします。具体的にはurlsとdatabaseの項目をコメントを外しました。
...
# Configuration for sending metrics to InfluxDB
[[outputs.influxdb]]
  ## The full HTTP or UDP URL for your InfluxDB instance.
  ##
  ## Multiple URLs can be specified for a single cluster, only ONE of the
  ## urls will be written to each interval.
  # urls = ["unix:///var/run/influxdb.sock"]
  # urls = ["udp://127.0.0.1:8089"]
  urls = ["http://127.0.0.1:8086"]

  ## The target database for metrics; will be created as needed.
  ## For UDP url endpoint database needs to be configured on server side.
  database = "telegraf"
...
cisco_telemetry_mdtプラグインの設定は、デフォルトのものをそのまま使いました。参考までにそのまま掲載します。
今回は使いませんでしたが、inputs.cisco_telemetry_mdt.aliasesを変更すると、デフォルトだと長くなりがちなmeasurement名をシンプルなmeasurement名にエイリアスすることができそうです。
...
# Cisco model-driven telemetry (MDT) input plugin for IOS XR, IOS XE and NX-OS platforms
[[inputs.cisco_telemetry_mdt]]
 ## Telemetry transport (one of: tcp, grpc)
 transport = "grpc"

 ## Address and port to host telemetry listener
 service_address = ":57000"

 ## Enable TLS for GRPC transport
 # tls_cert = "/etc/telegraf/cert.pem"
 # tls_key = "/etc/telegraf/key.pem"

 ## Enable TLS client authentication and define allowed CA certificates
 # tls_allowed_cacerts = ["/etc/telegraf/clientca.pem"]

 ## Define aliases to map telemetry encoding paths to simple measurement names
 [inputs.cisco_telemetry_mdt.aliases]
   ifstats = "ietf-interfaces:interfaces-state/interface/statistics"
...
Telegrafをスタートします。
$ telegraf -config telemetry.conf
InfluxDB側には以下のようなレコードが作成されます。
> select free_memory,total_memory,used_memory from "Cisco-IOS-XE-memory-oper:memory-statistics/memory-statistic" limit 5
name: Cisco-IOS-XE-memory-oper:memory-statistics/memory-statistic
time                free_memory total_memory used_memory
----                ----------- ------------ -----------
1562304066355000000 1931859996  2219193232   287333236
1562304066355000000 824         3149400      3148576
1562304076354000000 1931856900  2219193232   287336332
1562304076354000000 824         3149400      3148576
1562304086354000000 1931797620  2219193232   287395612
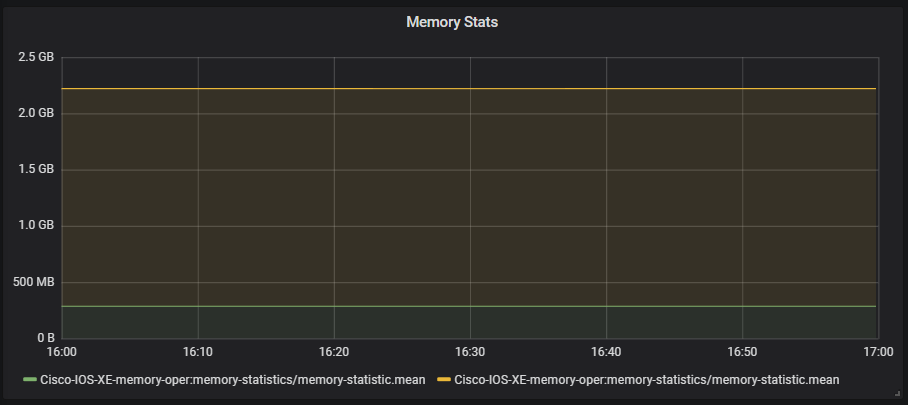
(おまけ)Grafanaサンプル
最後に、Grafanaでのグラフ化したサンプルです。
おしまい