初めに
この数式って本当にこのグラフになるのかな?って不安になることってありますよね。
今回はそんな自分の不安にpythonで解決しようとした際に出た問題を記事にしています。
問題
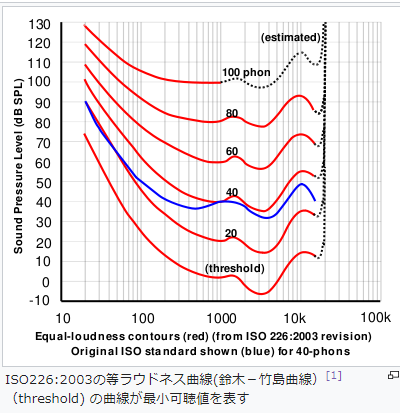
最小可聴値あるいは聴覚閾値と呼ばれるグラフを探した際に次のようなグラフが見つかりました。
これをpythonで再現したい。
xが10の累乗のグラフなので、それが再現できるpythonのコードにしなくてはいけない。
コード
import matplotlib.pyplot as plt
import numpy as np
f = np.logspace(1,4,500000,base=10)
ath = 3.64*(f/1000)**-0.8-6.5*np.exp(-0.6*(f/1000-3.3)**2)+10**-3*(f/1000)**4
plt.plot(f, ath)
ax = plt.gca()
ax.set_xscale('log')
plt.show()
logspace
f = np.logspace(1,4,500000,base=10)
numpyの対数スケールの配列を生成するためのメソッド。
ax.set_xscale
ax = plt.gca()
ax.set_xscale('log')
配列ではなくグラフの軸事態を対数スケールに合わせにいくための設定用のメソッド。
結果
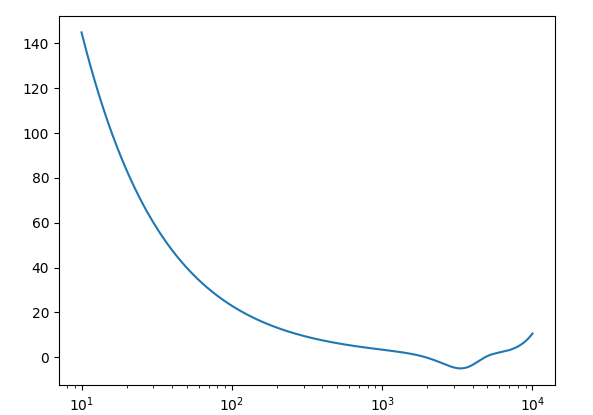
こんな感じのグラフが。
…あれ?Wikipediaにあったグラフとは形は似てるけど値が似ても似ついていないような?
まぁ、この記事ではやり方さえ紹介できればいいかな。
参考

