MCMC(*´Д`)ハァハァ
— MrUnadon (@MrUnadon) 2017年9月1日
ちょっと前ですが、TokyoRでベイズ特集回をやった事があります。
その際に、ベイズ統計の基礎という大げさなタイトルでトークをしました。
トークは基礎的(理論的)な話だけでしたので、これはRとstanを使った実践編という感じです。
環境設定
# libraryにattachしておく
library(tidyverse)   # データ加工
library(rstan)       # MCMCハァハァ
library(patchwork)   # 図を並べる
library(lme4)        # おまけ

# rstanのchainを並列計算させる呪文
rstan_options(auto_write=TRUE)
options(mc.cores=parallel::detectCores())
復習: 線形混合モデル
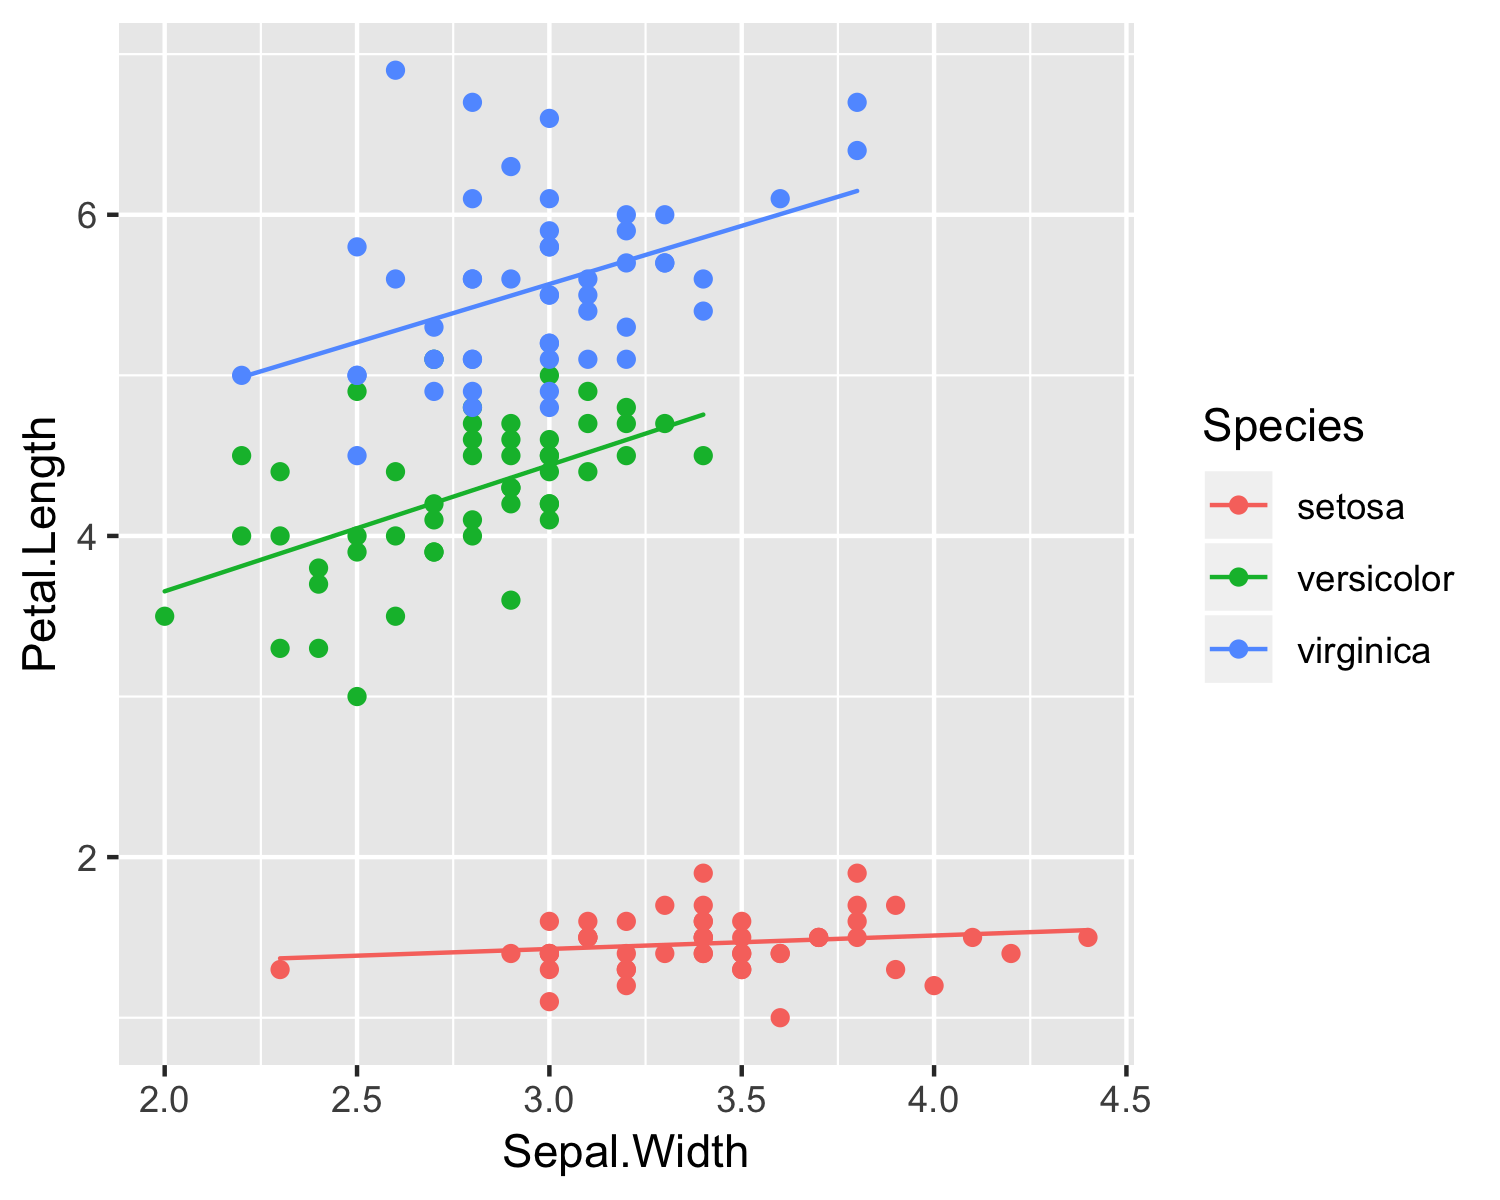
線形混合モデルの取り回しでは、種ごとのランダム効果を導入した線形モデルによる回帰をlme4::lmer関数を使って行いました。
例えば下記のようなモデル関数を使ってフィッティングします。
# 傾きと切片にそれぞれ独立のランダム効果を導入
model_lmm <- function(data)
  lmer(Petal.Length ~ Sepal.Width + (1|Species) + (0 + Sepal.Width|Species), data = data)

図を出力するコード
dat %>% model_lmm %>% predict %>% data.frame %>% set_names("predict") %>% cbind(dat, .) %>%
  ggplot(aes(x = Sepal.Width, color = Species))+
    geom_point(aes(y = Petal.Length))+
    geom_path(aes(y = predict, group = Species))
ただの線形回帰
まずは簡単なモデルを組んでみる。
混合効果を考えない単なる回帰。
(ほとんどhoxo_mさんの二番目に簡単な rstan コードと同じです)
せっかくベイズ推定するので、切片bの最低値が0という縛りを入れました。
推定値Yも0以上ですね。(間接的にaの範囲を制限できる)
花弁の長さが0以上というのは自然な仮定です。
bの事前分布は明示的に指定していないのですが、この場合unif(0, Inf)になるようです。
stancode_iris_lm <- "
data {                  # 入力する既知データ
  int N;                #   データ数
  real x[N];            #   長さNのベクトル
  real y[N];
}

parameters{             # 事後分布を推定されるパラメータ
  real a;               #   傾きa
  real<lower=0> b;      #   切片b
  real<lower=0> sigma;  #   正規誤差sigma
}

transformed parameters{
  real<lower=0> Y[N];     # xに対応して推定される値Y

  for(i in 1:N)
    Y[i] = a * x[i] + b;  # 回帰式
}

model{
  for(i in 1:N)
    y[i] ~ normal(Y[i], sigma);     # y ~ Y + N(0, sigma)の変形

  a ~ normal(0, 100);               # 事前分布
  sigma ~ inv_gamma(0.001, 0.001);  # 事前分布
}
"
キックするRコードはこんな感じ。
dat <- iris

dat_stan <- list(
  N = nrow(dat),
  x = dat$Sepal.Width,
  y = dat$Petal.Length
)

fit <- stan(model_code = stancode_iris_lm, data = dat_stan, seed = 71)
結果の確認。
Rhatは軒並み1で、収束は良さそう。
> fit
Inference for Stan model: 4bac703ee505e3edc67be58e74e56e8e.
4 chains, each with iter=2000; warmup=1000; thin=1;
post-warmup draws per chain=1000, total post-warmup draws=4000.

          mean se_mean   sd    2.5%     25%     50%     75%   97.5% n_eff Rhat
a        -1.73    0.01 0.29   -2.29   -1.92   -1.73   -1.53   -1.12  1026    1
b         9.04    0.03 0.91    7.14    8.44    9.05    9.63   10.80  1021    1
sigma     1.61    0.00 0.09    1.44    1.54    1.60    1.67    1.81  1682    1
線形回帰lmの結果と比較してみる。aとbの値は、ほぼ一緒。
> lm(Petal.Length ~ Sepal.Width, data = dat)

Call:
lm(formula = Petal.Length ~ Sepal.Width, data = iris)

Coefficients:
(Intercept)  Sepal.Width
      9.063       -1.735
念の為可視化。(code割愛)
まぁ、こうなりますよね〜、という結果。
ランダム効果を導入
transformed parametersのセクションが変わっています。
それに合わせてあちこち調整を入れています。
切片bの混合効果b_mを<lower=-b>としても良いです(結果はホボ変わらなかったですね)。
また、この入れ方では、speciesはintで入れないと怒られます。
stancode_iris_lmm <- "
  data {
    int N;
    real x[N];
    real y[N];
    int N_s;             # 種数
    int species[N];      # データに対応する種のindexが入ったベクトル
  }

  parameters{
    real a;
    real<lower=0> b;
    real<lower=0> sigma;

    real a_m[N_s];       # 種ごとの傾き変動(ランダム効果)
    real b_m[N_s];       # 種ごとの切片変動(ランダム効果)
    real<lower=0> a_s;   # 傾きランダム効果のばらつき
    real<lower=0> b_s;   # 切片ランダム効果のばらつき
  }

  transformed parameters{
    real<lower=0> Y[N];

    for(i in 1:N)        # 種のindex番目のランダム効果が加わる回帰式
      Y[i] = (a + a_m[species[i]]) * x[i] + b + b_m[species[i]];
  }

  model{
    for(i in 1:N_s){
      a_m[i] ~ normal(0, a_s);       # ランダム効果は種ごとにサンプリング
      b_m[i] ~ normal(0, b_s);
    }

    for(i in 1:N)
      y[i] ~ normal(Y[i], sigma);    # 回帰はデータごとにサンプリング

    a ~ normal(0, 100);              # 以下、事前分布
    sigma ~ inv_gamma(0.001, 0.001);
    a_s ~ inv_gamma(0.001, 0.001);
    b_s ~ inv_gamma(0.001, 0.001);
  }
"
キックするコードはほぼ一緒。
dat <- iris %>%
  mutate(species = Species %>% factor %>% c)

dat_stan <- list(
  N = nrow(dat),
  x = dat$Sepal.Width,
  y = dat$Petal.Length,
  N_s = dat$species %>% max,
  species = dat$species
  )

fit <- stan(model_code = stancode_iris_lmm, data = dat_stan, seed = 71, iter = 5000, thin = 2)
結果。良さげ。ただしn_effが小さい。
> fit
Inference for Stan model: 8c68fd56debef05f291ad0da21a95901.
4 chains, each with iter=5000; warmup=2500; thin=2;
post-warmup draws per chain=1250, total post-warmup draws=5000.

        mean se_mean   sd  2.5%   25%   50%   75% 97.5% n_eff Rhat
a       0.49    0.03 0.73 -0.58  0.32  0.52  0.72  1.59   456 1.01
b       2.35    0.03 1.06  0.44  1.74  2.26  2.80  4.86  1356 1.00
sigma   0.39    0.00 0.02  0.35  0.37  0.39  0.40  0.44  3671 1.00
a_m[1] -0.42    0.03 0.74 -1.59 -0.66 -0.41 -0.20  0.57   469 1.01
a_m[2]  0.28    0.03 0.74 -0.80  0.02  0.23  0.46  1.39   455 1.01
a_m[3]  0.25    0.03 0.74 -0.78  0.00  0.20  0.43  1.40   456 1.01
b_m[1] -1.14    0.03 1.19 -3.98 -1.71 -0.96 -0.33  0.67  1286 1.00
b_m[2] -0.21    0.03 1.08 -2.82 -0.67 -0.11  0.37  1.73  1425 1.00
b_m[3]  0.98    0.03 1.11 -1.42  0.36  0.96  1.61  3.14  1391 1.00
a_s     0.73    0.04 1.22  0.11  0.32  0.49  0.78  2.71   808 1.01
b_s     1.70    0.04 1.56  0.06  0.82  1.30  2.09  5.62  1665 1.00
lmmの結果と、似ているような似ていないような。だいたい似ているかな〜。
> dat %>% model_lmm %>% fixef
(Intercept) Sepal.Width
  2.2182831   0.5314268

> dat %>% model_lmm %>% ranef
$Species
           (Intercept) Sepal.Width
setosa      -1.0415779  -0.4475732
versicolor  -0.1347486   0.2544014
virginica    1.1763265   0.1931718
n_effも気になるし、traceplotを描いてみる。
traceplot(fit, pars = c("a", "b", "sigma", "a_m", "b_m"))
MCMC(*´Д`)ハァハァ
ん〜ちょっとaですっ飛んでいるところがありますね。
(thin=2にしたりiterを大きめにした理由はこのへんを考慮してみた結果)
事後分布を可視化してみましょう。ドンッ!
図を出力するコード
# 有効MCMCサンプルの抽出
ext_fit <- extract(fit)

# fixed effectを取り出して縦持ちにしてggplot
g_fixef <- data.frame(a = ext_fit$a,
                      b = ext_fit$b) %>%
  gather(key, val) %>%
  ggplot(aes(val, ..density.., color = key, fill = key))+
    geom_density(alpha = 0.5)+
    facet_wrap(~key)+
    theme(axis.title.x = element_blank())+
    ggtitle("Fixed effect")+
    scale_x_continuous(limits = c(-10, 10))

# この関数は時々欲しい。今回はNSEで実装
extract_levels <- function(dat, .key){
    dat %>% select(!!enquo(.key)) %>% unlist %>% factor %>% levels
}

# random effectを取り出して縦持ちにしてタグを整備してggplot
g_ranef <- cbind(ext_fit$a_m, ext_fit$b_m) %>%
  data.frame() %>%
  set_names(str_c("a_", extract_levels(iris, Species)),
            str_c("b_", extract_levels(iris, Species))) %>%
  gather(key, val) %>%
  separate(key, into = c("param", "id"), remove = F) %>%
  ggplot(aes(val, ..density.., color = id, fill = id))+
    geom_density(alpha = 0.5)+
    scale_x_continuous(limits = c(-5, 5))+
    facet_wrap(~param)+
    theme(axis.title.x = element_blank())+
    ggtitle("Random effect")

# 回帰直線をプロット
g_predict <- ext_fit$Y %>%
  data.frame() %>%
  summarise_all(mean) %>%
  t %>%
  data.frame() %>%
  set_names("predict") %>%
  cbind(dat, .) %>%
  ggplot(aes(x = Sepal.Width, color = Species))+
    geom_point(aes(y = Petal.Length))+
    geom_path(aes(y = predict, group = Species))

# 保存した絵を組み合わせたプロットをg_wに入れておいてggsave
g_w <- wrap_plots((g_fixef / g_ranef) | g_predict)
ggsave("iris_lmm.png", g_w, width = 12, height = 6)
無茶な推定ではなさそうです。
ただ、線形混合モデルの取り回しでみた通り、このモデルはそもそもあまり「良い」とは言えないんですよね。
「MCMCが収束する=良いモデル」というのは大変危険で、それをいうなら上に挙げた「単なる線形回帰」も収束しているわけです。やはりモデル選択の考え方が必要になってくるでしょう。それはまた後日。
(ちなみに単なる線形回帰モデルのAICは、LMMのAICより明らかにデカいので「良くない」と判断されます)
> dat %>% lm(Petal.Length ~ Sepal.Width, data = .) %>% AIC
[1] 570.7537

> dat %>% model_lmm %>% AIC
[1] 171.819


