やりたいこと
- pandasでCSVデータを読み込んで棒グラフを表示したい。
- グラフの色やサイズも自由にカスタムしたい。
- 基本操作の習得が目的であるため、データセットは自作したシンプルな内容を扱う。
- ここでは、データの「集計」ではなく「可視化」が目的なので、groupbyなどは使わない。
前提
- jupyterの環境が構築済みであること。
- 必要なpythonライブラリをインストール済みであること。
公式ドキュメント
pandas公式ドキュメント。plot.barの仕様。
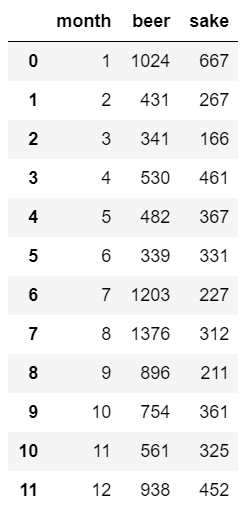
CSVデータセット
sample.csv
自作した架空データ。
酒類を販売する会社の売り上げを示す。
ビールと日本酒の月別売り上げ金額(億円)。
たとえば2月は、ビール(beer)を431億円、日本酒(sake)を267億円、売り上げた。
month,beer,sake
1,1024,667
2,431,267
3,341,166
4,530,461
5,482,367
6,339,331
7,1203,227
8,1376,312
9,896,211
10,754,361
11,561,325
12,938,452
以下、pythonでの実装。
ライブラリをインポートする
import pandas as pd
import matplotlib as mpl
import matplotlib.pyplot as plt
CSVを読み込む
df = pd.read_csv('csv/sample.csv')
dfの中身は下記。
月別のビールの売り上げを表示する
df.plot.bar('month', 'beer')
横軸が「月」で、縦軸が「ビールの売り上げ金額(億円)」となる。
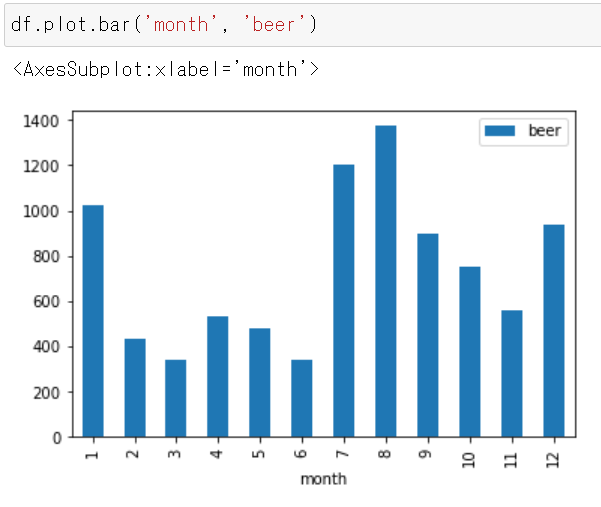
- 8月の売り上げが最も多い(1376億円である)ことが分かる。
月別の日本酒の売り上げを表示する
df.plot.bar('month', 'sake')
横軸が「月」で、縦軸が「日本酒の売り上げ金額(億円)」となる。

- 1月の売り上げが最も多い(667億円である)ことが分かる。
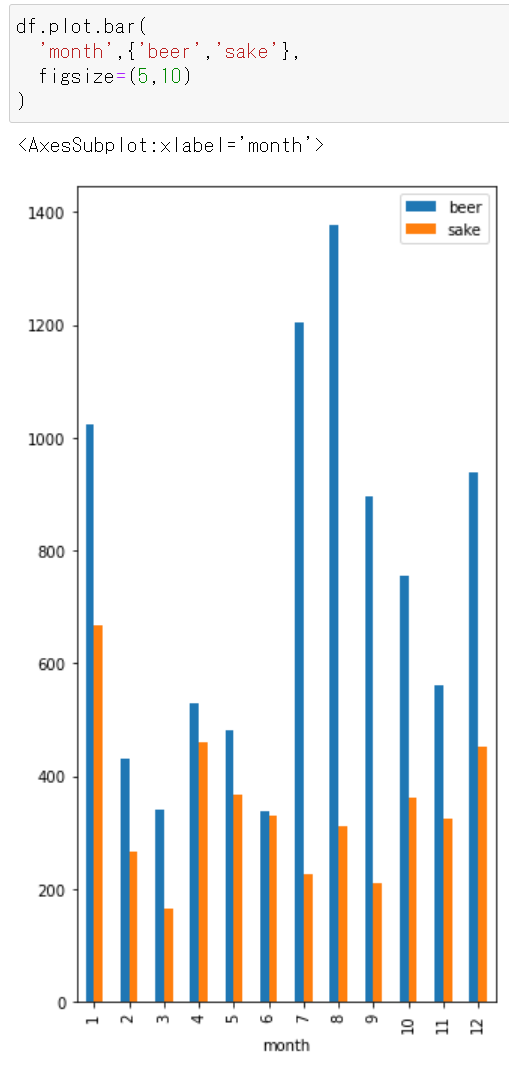
月別の「ビールと日本酒の売り上げ」を表示する
df.plot.bar('month',{'beer','sake'} )
横軸が「月」で、縦軸が「ビール(青)と日本酒(オレンジ)の売り上げ金額(億円)」となる。

下記が分かる。
- ビールの売り上げ最多は8月だが、日本酒の売り上げ最多は1月である。
- 日本酒よりもビールのほうが売り上げ金額が大きい。
月別の「ビールと日本酒の売り上げ」を表示する(積み上げ)
stacked=True を付けると積み上げグラフになる。
df.plot.bar('month',{'beer','sake'}, stacked=True)
横軸が「月」で、縦軸が「ビール(青)と日本酒(オレンジ)の売り上げ金額(億円)」(積み上げ)となる。

下記が分かる。
- ビールと日本酒を合計して、もっとも売れるのは1月と8月である。
- 日本酒よりもビールのほうが総売り上げに対する比率が高い。
棒の色を変更する
- ビールは赤色、日本酒は緑色、にしたい場合。
df.plot.bar(
  'month',{'beer','sake'},
   color={"beer": "red", "sake": "green"}
)

積み上げ
df.plot.bar(
  'month',{'beer','sake'},
   color={"beer": "red", "sake": "green"},
   stacked=True
)

グラフ表示領域のサイズを拡大縮小する
figsize で指定する。
figsize=(5,5)
df.plot.bar(
  'month',{'beer','sake'},
  figsize=(5,5)
)

figsize=(8,5)

figsize=(5,10)