前回の記事 では Sorting、SupportsHighlight、AdvancedEditModeSupport を試しました。今回はドリルダウン機能を検証してます。
Drilldown : ビジュアル内でのドリルダウン
ドリルダウン用の別ビジュアルを用意することなく、DataView にドリルダウンした値を渡せるようになります。設定には drilldown の追加および、データロールに対して最大 1 フィールドしか置けないように制約を入れます。
前提条件
ドリルダウンを使うためには、階層構造のデータが必要です。一番簡単なものは日付型ですが、他にも「国」「地域」「都市」のような階層なども考えられます。
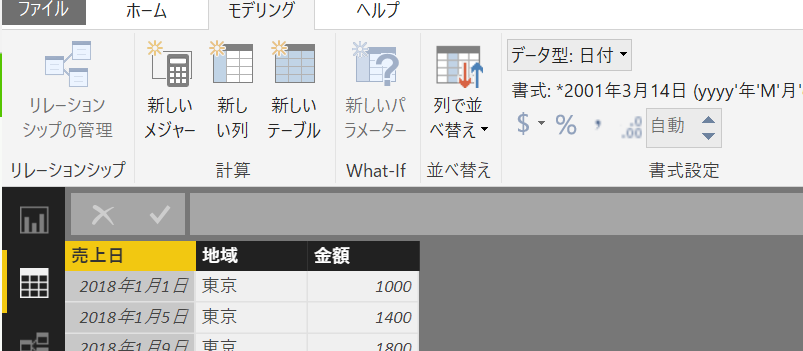
この記事でもこれまでと同じ売り上げデータを元にしますが、売上日を日付型に Power BI Desktop で変換したデータセットを利用します。
Drilldown の動作確認
以下の例では myCategory データロールをドリルダウンの対象にし、condition で 1 つしかフィールドを追加できないようにしています。
{
    "dataRoles": [
        {
            "displayName": "サンプルカテゴリ",
            "name": "myCategory",
            "kind": "Grouping"
        },
        {
            "displayName": "グルーピングフィールド",
            "name": "myGrouping",
            "kind": "Grouping"
        },
        {
            "displayName": "サンプルメジャー",
            "name": "myMeasure",
            "kind": "Measure"
        }
    ],
    "drilldown": {
        "roles": [
            "myCategory"
        ]
    },
    "dataViewMappings": [
        {
            "conditions": [
                {
                    "myCategory":{ "max": 1}
                }
            ],
            "categorical": {
                "categories": {
                    "for": {
                        "in": "myCategory"
                    }
                },
                "values": {
                    "group": {
                        "by": "myGrouping",
                        "select": [
                            {
                                "bind": {
                                    "to": "myMeasure"
                                }
                            }
                        ]
                    }
                }
            }
        }
    ]
}
module powerbi.extensibility.visual {
    "use strict";

    export class Visual implements IVisual {

        private area: d3.Selection<HTMLElement>
        private table: d3.Selection<HTMLElement>
        private thead: d3.Selection<HTMLElement>
        private tbody: d3.Selection<HTMLElement>
        private host: IVisualHost;
        private settings: VisualSettings;

        constructor(options: VisualConstructorOptions) {
            // カスタムビジュアルを配置しているホストの情報を取得
            this.host = options.host;
            // カスタムビジュアルのエリアを取得
            this.area = d3.select(options.element);
            this.table = this.area.append("table");
            this.thead = this.table.append("thead").append("tr");
            this.tbody = this.table.append("tbody");
        }

        public update(options: VisualUpdateOptions) {
            debugger;

            this.thead.selectAll("th").remove();
            this.tbody.selectAll("tr").remove();

            this.thead
                .selectAll("th")
                .data(options.dataViews[0].categorical.categories[0].values)
                .enter()
                .append("th")
                .text((value) => { return value.toString(); });

            // Add first blank header
            this.thead.insert("th", ":first-child");

            options.dataViews[0].categorical.values.forEach((values) => {

                let tr = this.tbody.append("tr");

                tr.selectAll("td")
                .data(values.values)
                .enter()
                .append("td")
                .text((value) => {
                    return value.toString(); });

                tr.insert("td",":first-child").text(() => { return values.source.groupName.toString() });
            });
        }

        private static parseSettings(dataView: DataView): VisualSettings {
            return VisualSettings.parse(dataView) as VisualSettings;
        }

        public enumerateObjectInstances(options: EnumerateVisualObjectInstancesOptions): VisualObjectInstance[] | VisualObjectInstanceEnumerationObject {
            return VisualSettings.enumerateObjectInstances(this.settings || VisualSettings.getDefault(), options);
        }
    }
}
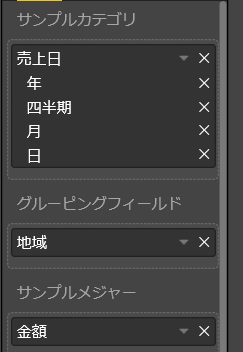
画面では日付をカテゴリに設定して、ドリルダウンを試します。
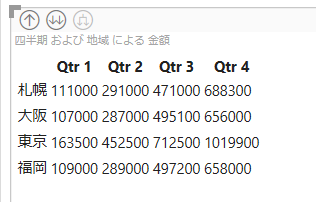
[レポート]
上部に出ている下矢印や展開アイコンがドリルダウンのボタン
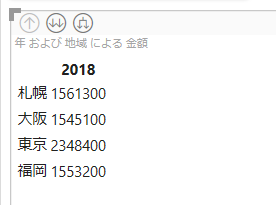
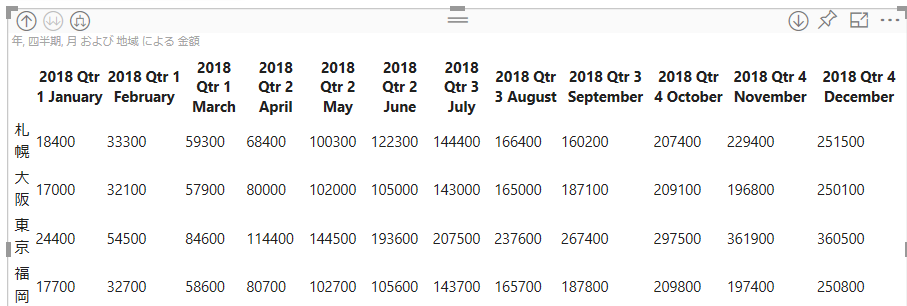
[展開ボタンをクリック]
上位のカテゴリを表示しつつ下位カテゴリを表示
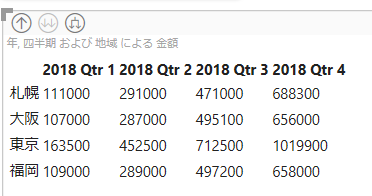
まとめ
今回の例ではドリルダウン時に同じ用なテーブル表記をしましたが、データの粒度によって異なるグラフを出すのも面白いです。是非試してください。
