前回 はテスト用の環境を構築し、簡単なテストを行いました。今回は前回利用したテスト用ファイルの詳細を見ていきます。
テストで必要なコード
カスタムビジュアルをテストするには、以下の 3 つの処理が必要です。
- ビジュアルのインスタンス化
- (必要に応じて)データのバインド
- 描写された結果の確認
ビジュアルのインスタンス化
visualBuilder.ts に必要なコードがあります。内容を順番に見ていきます。
まずは import 部分。必要なライブラリとテストしたいカスタムビジュアルを読み込みます。ここでは src/visual から Visual クラスを読み込んでいます。
import powerbi from "powerbi-visuals-api";
import VisualConstructorOptions = powerbi.extensibility.visual.VisualConstructorOptions;
import { VisualBuilderBase } from "powerbi-visuals-utils-testutils";
import { Visual } from "./../src/visual";
次にコンストラクタと build 関数を定義して初期化を行います。サイズを受け取って初期化し、オプションを使ってビルドします。ビルドでは Visual を新規に作成しているだけです。
export class VisualBuilder extends VisualBuilderBase<Visual> {
    constructor(width: number, height: number) {
        super(width, height);
    }

    protected build(options: VisualConstructorOptions) {
        return new Visual(options);
    }
...
}
最後にテストでチェックしたい要素を返すようプロパティを準備します。this.element は JQuery オブジェクトのため find 以外も JQuery の関数が使えます。以下では svg 要素を返す mainElement と "bar" クラスを持つ要素を返す barElement を定義しています。
public get mainElement(): JQuery {
    return this.element.find("svg");
}

public get barElement(): JQuery {
    return this.element.find(".bar");
}
this.element だけを返してクエリをテスト側でやることもできますが、よりテストを完結に書くため、要素のアクセスはこちらのクラスにまとめていることが多いようです。
データバインド用のデータ用意
visualData.ts に必要なコードがあります。
まずは import 部分。
- カスタムビジュアルにバインドするデータは DataView 型であり、それを powerbi.DataView からインポート
- カテゴリやメジャーの値の型は bool, string, number など複数あり、その定義を持つ ValueType をインポート
- TestDataViewBuilder は名前の通りテストデータを作成
import powerbi from "powerbi-visuals-api";
import DataView = powerbi.DataView;
import { valueType } from "powerbi-visuals-utils-typeutils";
import ValueType = valueType.ValueType;
import {
    testDataViewBuilder
} from "powerbi-visuals-utils-testutils";
import TestDataViewBuilder = testDataViewBuilder.TestDataViewBuilder;
次にクラスとバインドするデータを定義。ここでは 7 つのカテゴリに対してそれぞれ値があるデータを想定します。
export class VisualData extends TestDataViewBuilder {
    public valuesCategory: string[] = [
        "Infrastructure",
        "Services",
        "Distribution",
        "Manufacturing",
        "Office & Administrative",
        "BU",
        "R&D"];
    public valuesMeasure: number[] = [
        23536681.479000024,
        572443.5630000085,
        -561203.5199999921,
        -1061897.1090000793,
        -2429005.238999985,
        -2846388.948000014,
        -2970340.0979999974];

    public constructor() {
        super();
    }
}
最後にクラス内に DataView を返す getDataView 関数を定義します。
public getDataView(columnNames?: string[]): DataView {
}
getDataView 関数では createCategoricalDataViewBuilder 関数を使ってデータを作成しますが、カテゴリ列と値列それぞれ複数のデータを渡すことができます。今回のテストでは、それぞれ一つずつです。
カテゴリ列、値列の型は似ているので詳細は、 TestDataViewBuilderCategoryColumnOptions と DataViewBuilderValuesColumnOptions の定義を参照してください。
let dataView: any = this.createCategoricalDataViewBuilder(
    [{
        source: {
            displayName: "Business Area",
            queryName: "Business Area.Business Area",
            type: ValueType.fromDescriptor({ text: true }),
            roles: {
                category: true
            },
        },
        values: this.valuesCategory
    }],
    [{
        source: {
            displayName: "Var Plan",
            queryName: "Fact.Var Plan",
            isMeasure: true,
            roles: {
                measure: true
            },
            type: ValueType.fromDescriptor({ numeric: true })
        },
        values: this.valuesMeasure
    }],
    columnNames).build();
次に生成されたデータに対して、付加情報を追加してデータを完成させます。以下では値の最大値と最小値を定義しています。
let maxLocal = 0;
this.valuesMeasure.forEach((item) => {
    if (item > maxLocal) {
        maxLocal = item;
    }
});
(<any> dataView).categorical.values[0].maxLocal = maxLocal;

let minLocal = 0;
this.valuesMeasure.forEach((item) => {
    if (item < minLocal) {
        minLocal = item;
    }
});
(<any> dataView).categorical.values[0].minLocal = minLocal;
return dataView;
上記コードによって生成されるデータは以下のようになります。
{
    "metadata": {
        "columns": [
            {
                "displayName": "Business Area",
                "queryName": "Business Area.Business Area",
                "type": {
                    "underlyingType": 1,
                    "category": null
                },
                "roles": {
                    "category": true
                },
                "index": 0
            },
            {
                "displayName": "Var Plan",
                "queryName": "Fact.Var Plan",
                "isMeasure": true,
                "roles": {
                    "measure": true
                },
                "type": {
                    "underlyingType": 259,
                    "category": null
                },
                "index": 1
            }
        ]
    },
    "categorical": {
        "values": [
            {
                "source": {
                    "displayName": "Var Plan",
                    "queryName": "Fact.Var Plan",
                    "isMeasure": true,
                    "roles": {
                        "measure": true
                    },
                    "type": {
                        "underlyingType": 259,
                        "category": null
                    },
                    "index": 1
                },
                "values": [
                    23536681.479000024,
                    572443.5630000085,
                    -561203.5199999921,
                    -1061897.1090000793,
                    -2429005.238999985,
                    -2846388.948000014,
                    -2970340.0979999974
                ],
                "maxLocal": 23536681.479000024,
                "minLocal": -2970340.0979999974
            }
        ],
        "categories": [
            {
                "source": {
                    "displayName": "Business Area",
                    "queryName": "Business Area.Business Area",
                    "type": {
                        "underlyingType": 1,
                        "category": null
                    },
                    "roles": {
                        "category": true
                    },
                    "index": 0
                },
                "values": [
                    "Infrastructure",
                    "Services",
                    "Distribution",
                    "Manufacturing",
                    "Office & Administrative",
                    "BU",
                    "R&D"
                ],
                "identity": [
                    "Infrastructure",
                    "Services",
                    "Distribution",
                    "Manufacturing",
                    "Office & Administrative",
                    "BU",
                    "R&D"
                ],
                "identityFields": [
                    null
                ]
            }
        ]
    },
    "tree": {
        "root": {
            "childIdentityFields": [
                null
            ],
            "children": [
                {
                    "values": [
                        "Infrastructure"
                    ],
                    "name": "Infrastructure",
                    "identity": "Infrastructure"
                },
                {
                    "values": [
                        "Services"
                    ],
                    "name": "Services",
                    "identity": "Services"
                },
                {
                    "values": [
                        "Distribution"
                    ],
                    "name": "Distribution",
                    "identity": "Distribution"
                },
                {
                    "values": [
                        "Manufacturing"
                    ],
                    "name": "Manufacturing",
                    "identity": "Manufacturing"
                },
                {
                    "values": [
                        "Office & Administrative"
                    ],
                    "name": "Office & Administrative",
                    "identity": "Office & Administrative"
                },
                {
                    "values": [
                        "BU"
                    ],
                    "name": "BU",
                    "identity": "BU"
                },
                {
                    "values": [
                        "R&D"
                    ],
                    "name": "R&D",
                    "identity": "R&D"
                }
            ]
        }
    },
    "table": {
        "columns": [
            {
                "displayName": "Business Area",
                "queryName": "Business Area.Business Area",
                "type": {
                    "underlyingType": 1,
                    "category": null
                },
                "roles": {
                    "category": true
                },
                "index": 0
            },
            {
                "displayName": "Var Plan",
                "queryName": "Fact.Var Plan",
                "isMeasure": true,
                "roles": {
                    "measure": true
                },
                "type": {
                    "underlyingType": 259,
                    "category": null
                },
                "index": 1
            }
        ],
        "identityFields": [
            null
        ],
        "rows": [
            [
                "Infrastructure",
                23536681.479000024
            ],
            [
                "Services",
                572443.5630000085
            ],
            [
                "Distribution",
                -561203.5199999921
            ],
            [
                "Manufacturing",
                -1061897.1090000793
            ],
            [
                "Office & Administrative",
                -2429005.238999985
            ],
            [
                "BU",
                -2846388.948000014
            ],
            [
                "R&D",
                -2970340.0979999974
            ]
        ]
    }
}
テスト用のコード
visualTest.ts にテスト用にコードがあります。
まずは import から見ていきましょう。
- 必要なライブラリをインポート
- 作成した VisualBuilder、VisualData をインポート
- 今回のテストでは使わなかったが Visual もインポート
import powerbi from "powerbi-visuals-api";
import { VisualBuilder } from "./VisualBuilder";
import DataView = powerbi.DataView;
import {
    Visual as VisualClass
} from "../src/visual";
import { VisualData } from "./visualData";
テストは Jasmine と Karma を使っているので、ここでは describe, beforeEach, it などを利用してテストを実施しています。
- beforeEach で事前準備。テスト用のビジュアルの作成およびデータの作成
- データをログで見れるよう console.log で出力
- データのバインドは visualBuilder の updateRenderTimeout に dataView を渡す
describe("Test Visual", () => {
    let visualBuilder: VisualBuilder;
    let dataView: DataView;
    let visualData: VisualData;

    // テストの準備
    beforeEach(() => {
        // ビジュアルの作成とデータの取得
        visualBuilder = new VisualBuilder(500, 500);
        visualData = new VisualData()
        dataView = visualData.getDataView();
        console.log(JSON.stringify(dataView));
    });

    it("should main element in DOM", () => {
        // SVC が存在するか確認
        expect(visualBuilder.mainElement).toBeInDOM();
    });

    it("should render 7 bars", (done) => {
        // DataView をバインドする
        visualBuilder.updateRenderTimeout(dataView, () => {
            // バインドが完了したらバーの数を確認
            expect(visualBuilder.barElement.length).toEqual(7);
            done();
        });
    });
});
テストの結果
テストは karma start で行います。テストの前に毎回ビジュアルをビルドしたい場合は、package.json の scripts に以下ラインを追加します。
"pretest": "pbiviz package --resources --no-minify --no-pbiviz --no-plugin",
npm test 経由で呼び出すと pretest が毎回実行され、ビジュアルのビルドも同時に確認できますが、時間もかかるため、「ユニットテストのテスト」をしている場合は不要です。
テスト結果はコンソールに出力されるほか、coverage フォルダに出力されます。設定は karma.conf.ts にあります。
coverageIstanbulReporter: {
    reports: ["html", "lcovonly", "text-summary", "cobertura"],
    dir: path.join(__dirname, coverageFolder),
    'report-config': {
        html: {
            subdir: 'html-report'
        }
    },
    combineBrowserReports: true,
    fixWebpackSourcePaths: true,
    verbose: false
},
coverageReporter: {
    dir: path.join(__dirname, coverageFolder),
    reporters: [
        // reporters not supporting the `file` property
        { type: 'html', subdir: 'html-report' },
        { type: 'lcov', subdir: 'lcov' },
        // reporters supporting the `file` property, use `subdir` to directly
        // output them in the `dir` directory
        { type: 'cobertura', subdir: '.', file: 'cobertura-coverage.xml' },
        { type: 'lcovonly', subdir: '.', file: 'report-lcovonly.txt' },
        { type: 'text-summary', subdir: '.', file: 'text-summary.txt' },
    ]
},
console.log の結果もこちらに出力されるため、作成された dataView も確認可能です。
テストのデバッグ
テストをデバッグしたい場合、以下の手順を試せます。
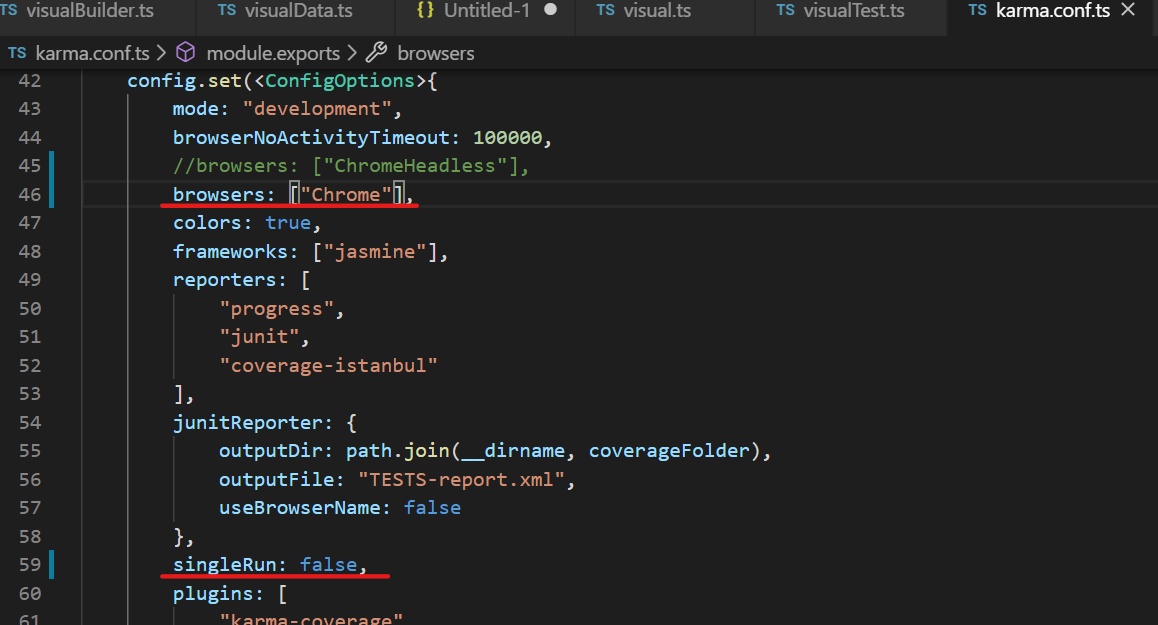
1. karma.conf.ts の singleRun を false に設定。また browsers で ["Chrome"] を指定。
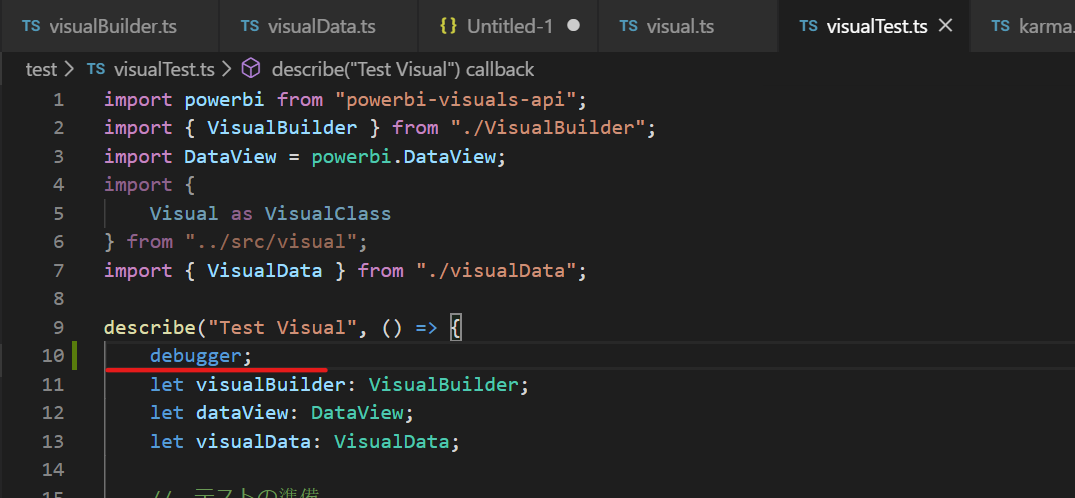
2. デバッグしたいラインに debugger; コードを追記。
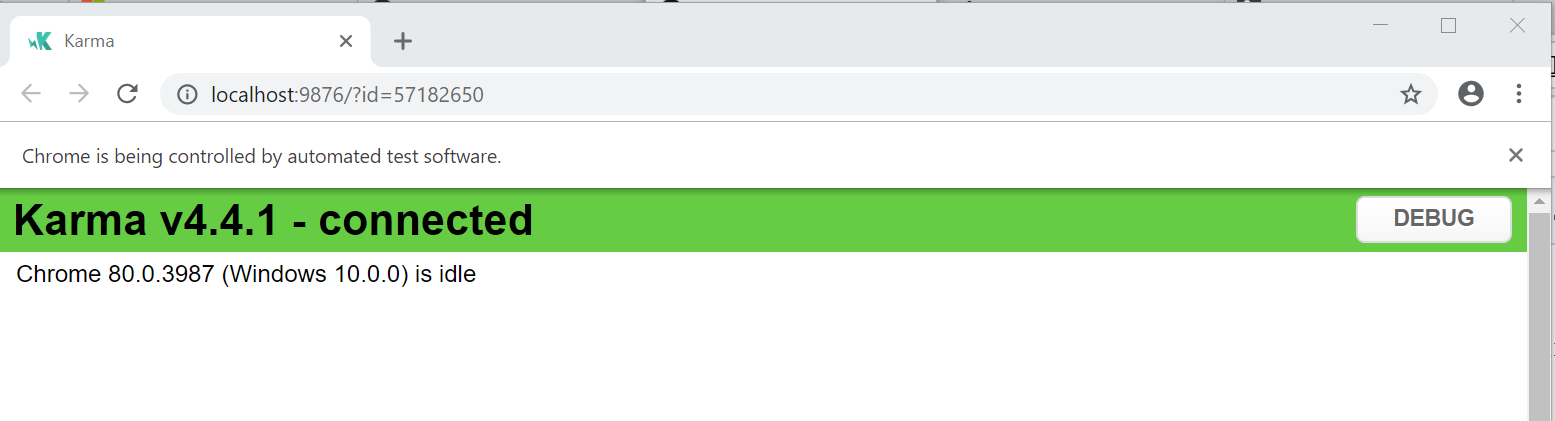
3. npm test でテストを実行。ブラウザが起動したままになることを確認。
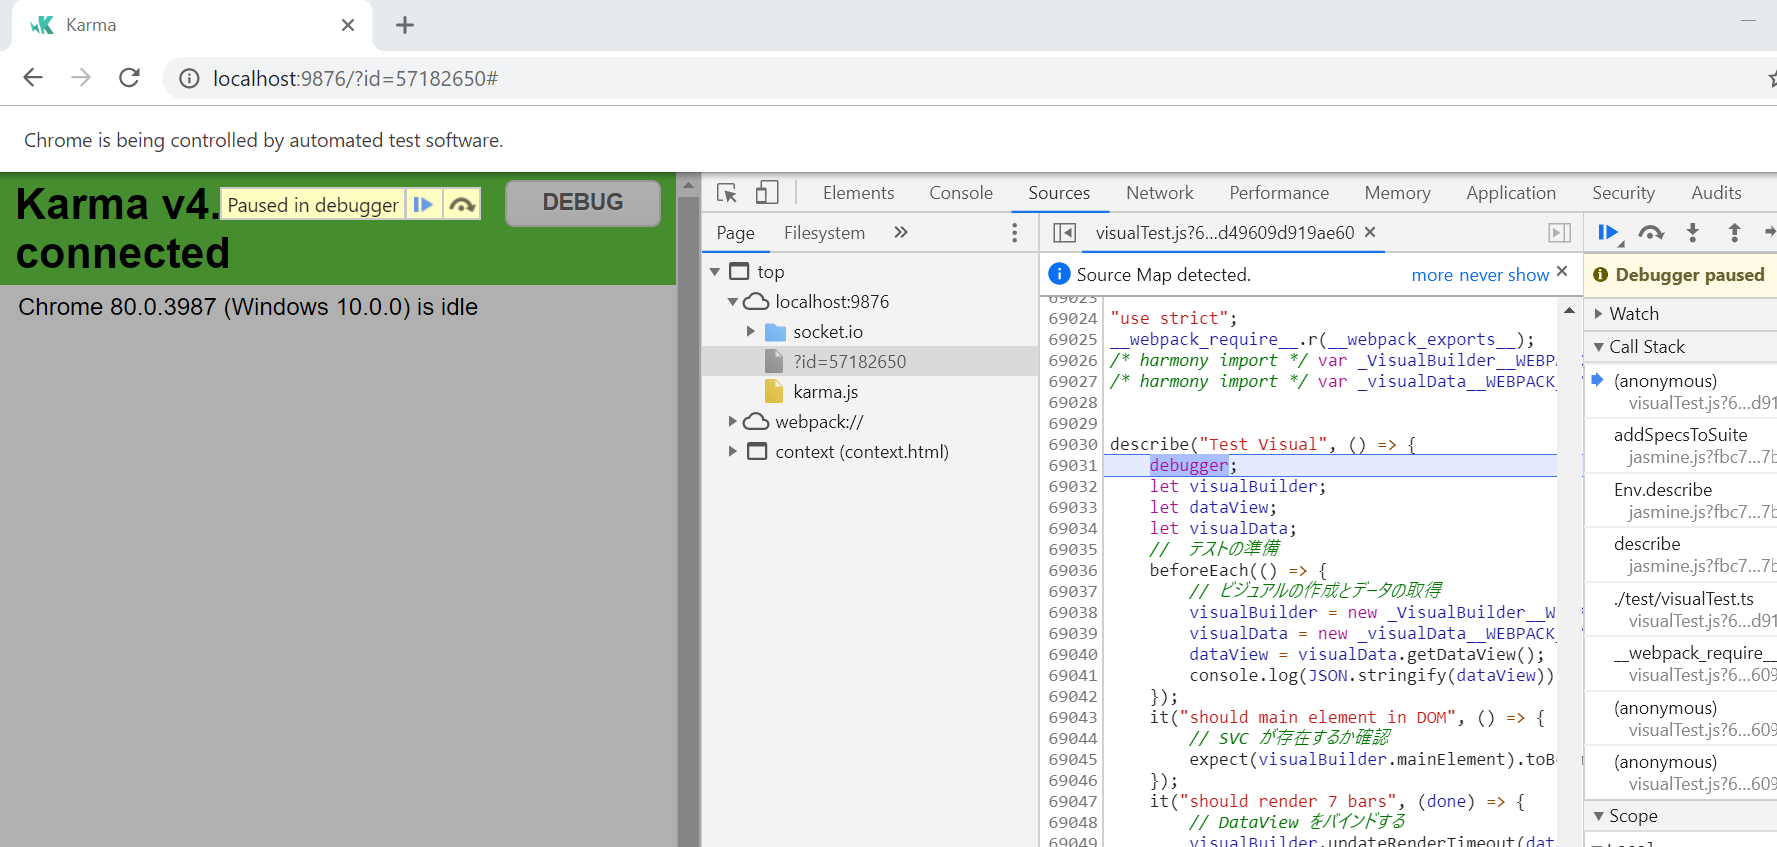
4. F12 を押下して開発者ツールを起動し、F5 でリロード。ブレークされることを確認。
まとめ
鬼門?はデータを作成するところと、何をテストするかを決める事だと思いますが、是非色々試してください。