概要
- 時系列データ分析の練習がしたいので、「デレステのイベントptランキングのボーダーラインデータ」でやってみる。
- できれば「イベント始まった瞬間にボーダーライン予測」とかしてみたい。(厳しい予感はする)
- 前準備として、このページではデータ取得・整理・概要確認を行う。
- 特徴量が全然足りないので、また追加して深堀りしたい
- 今回作ったスクリプトたちはココ
使ったデータ
アイマス デレステ攻略まとめwiki【アイドルマスター シンデレラガールズ スターライトステージ】のデータ
データ概要
- データの項目
| 名前 | 意味 | 変数の尺度 | データ型 |
|---|---|---|---|
| イベント名 | イベントの名前 | 名義尺度 | 文字列 |
| 1位ボーダーpt | 1位のポイント(コレについて知りたい) | 比例尺度 | 数値(整数) |
| 2001位ボーダーpt | 2001位ボーダーラインのポイント(コレについて知りたい) | 比例尺度 | 数値(整数) |
| 形式 | イベントの形式(アタポン、Groove、Carnivalのどれか) | 名義尺度 | 文字列(カテゴリ) |
| 属性 | イベントの属性(形式=Grooveのときのみ) | 名義尺度 | 文字列(カテゴリ) |
| 日付 | イベント開始日 | 間隔尺度 | 日付型 |
| 期間 | イベントの長さ(何時間か) | 比例尺度 | 数値(整数) |
- データ数: 95
- 欠損
- 属性:63コ欠損。形式がGroove以外は欠損
- 期間:3コ欠損。形式がCarnivalだと欠損
- 統計量
- イベント名:重複なし
- 1位ボーダー:異常値はない。中央値よりも平均値が高め
- 2001位ボーダー:異常値はない。中央値よりも平均値が高め
- 形式:3種類。最大で60個重複
- 日付:重複なし
- 属性:3種類。最大で11個重複
- 期間:異常値はない。中央値よりも平均値が高め
| イベント | 1位 | 2001位 | 形式 | 日付 | 属性 | 期間 | |
|---|---|---|---|---|---|---|---|
| count | 95 | 95 | 95 | 95 | 95 | 32 | 92 |
| unique | 95 | NaN | NaN | 3 | 95 | 3 | NaN |
| top | 双翼の独奏歌 | NaN | NaN | アタポン | 2016/5/31 | Vo | NaN |
| freq | 1 | NaN | NaN | 60 | 1 | 11 | NaN |
| mean | NaN | 791056 | 95234 | NaN | NaN | NaN | 183.543478 |
| std | NaN | 273195 | 42974 | NaN | NaN | NaN | 19.116998 |
| min | NaN | 240778 | 40096 | NaN | NaN | NaN | 150 |
| 25% | NaN | 601265 | 63762 | NaN | NaN | NaN | 174 |
| 50% | NaN | 775836 | 83532 | NaN | NaN | NaN | 174 |
| 75% | NaN | 988371 | 115179 | NaN | NaN | NaN | 198 |
| max | NaN | 1424681 | 224697 | NaN | NaN | NaN | 249 |
データの分布
形式
- アタポン形式が約3分の2を締めている
- Carnivalは3回のみ
| 形式 | データ数 |
|---|---|
| Carnival | 3 |
| Groove | 32 |
| アタポン | 60 |
属性
- 形式がGrooveのデータのみ
- そこそこ均等に開催されている
| 属性 | データ数 |
|---|---|
| Da | 10 |
| Vi | 11 |
| Vo | 11 |
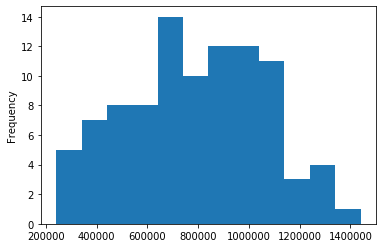
1位ボーダー
- 全データ
- 少し歪だが、真ん中に集まっている
- 形式ごとに色分け
- Carnival形式回数が少なく、低め
- アタポン形式が正規分布に近そうな形になっている
- Grooveは山が2つある

2001位ボーダー
- 全データ
- 右に裾が長い

- 形式ごとに色分け
- Carnival形式は回数が少ないが、ボーダーは高め
- アタポン形式が右に裾が長い分布になっている
- Grooveは山が2つある

期間
- 全データ
- 形式がCarnivalのデータは欠損のためナシ

変数同士の関係
形式ごと
1位ボーダー
- Carnival:全体的に一番低い
- Groove:中間
- アタポン:全体的に一番高い
| 形式 | Carnival | Groove | アタポン |
|---|---|---|---|
| count | 3 | 32 | 60 |
| mean | 260428 | 727588 | 851437 |
| std | 23466 | 278050 | 240959 |
| min | 240778 | 324148 | 324369 |
| 25% | 247437 | 483860 | 698563 |
| 50% | 254095 | 658333 | 834975 |
| 75% | 270253 | 996045 | 975764 |
| max | 286410 | 1180810 | 1424681 |

2001位ボーダー
- Carnival:全体的に一番高い
- Groove:全体的に一番低め。中央値 < 平均値。
- アタポン:3つの形式では真ん中。中央値 < 平均値。上に外れ値がある。
| 形式 | Carnival | Groove | アタポン |
|---|---|---|---|
| count | 3 | 32 | 60 |
| mean | 188752 | 87049 | 94924 |
| std | 19013 | 35319 | 42349 |
| min | 176743 | 40096 | 42944 |
| 25% | 177792 | 52943 | 67516 |
| 50% | 178840 | 84560 | 80590 |
| 75% | 194756 | 114458 | 112983 |
| max | 210672 | 170014 | 224697 |

期間
- Carnival:データなし
- Groove:下半分以上は174
- アタポン:minはGrooveより小さく、maxはGrooveより大きい。上に外れ値がある
| 形式 | Carnival | Groove | アタポン |
|---|---|---|---|
| count | 0 | 32 | 60 |
| mean | NaN | 188.3 | 181.0 |
| std | NaN | 18.1 | 19.3 |
| min | NaN | 174 | 150 |
| 25% | NaN | 174 | 174 |
| 50% | NaN | 174 | 174 |
| 75% | NaN | 198 | 198 |
| max | NaN | 222 | 249 |

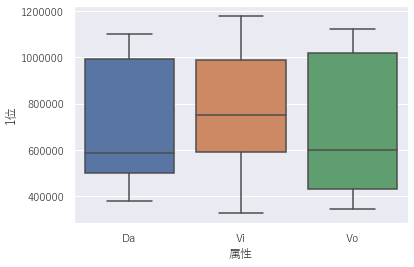
属性ごと
- 形式がGrooveのデータのみ
- 1位ボーダー
- Da:平均値は真ん中。最小値は一番大きい。中央値は一番小さい。最大値は一番小さい。
- Vi:平均値は一番大きい。最小値は一番小さい。中央値は一番大きい。最大値は一番大きい。
- Vo:平均値は一番小さい。最小値は真ん中。中央値は真ん中。最大値は真ん中。
| 属性 | Da | Vi | Vo |
|---|---|---|---|
| count | 10 | 11 | 11 |
| mean | 708559 | 774912 | 697562 |
| std | 278455 | 271941 | 303503 |
| min | 380000 | 324148 | 341507 |
| 25% | 500833 | 588250 | 430175 |
| 50% | 586605 | 750000 | 600000 |
| 75% | 991765 | 988371 | 1020828 |
| max | 1101000 | 1180810 | 1123331 |
- 2001位ボーダー
- Da:平均・中央値・最小値・最大値すべて一番低い
- Vi:平均・最小値・最大値は一番高い
- Vo:中央値が一番高い
| 属性 | Da | Vi | Vo |
|---|---|---|---|
| count | 10 | 11 | 11 |
| mean | 81120 | 92813 | 86673 |
| std | 32024 | 38596 | 37182 |
| min | 40096 | 46300 | 42544 |
| 25% | 54767 | 64640 | 49871 |
| 50% | 78107 | 82143 | 100476 |
| 75% | 110899 | 110700 | 118865 |
| max | 127482 | 170014 | 140000 |

期間
- 期間vsボーダー
- 相関行列:数値だけ見ると相関無さそう
- 期間が長ければポイント稼げるので、ボーダーラインの関係はゼロではないと思うが、他の要因のほうが強いと思われる
- 1位 vs 2001位
- 弱い正の相関
| 1位 | 2001位 | 期間 | |
|---|---|---|---|
| 1位 | 1 | 0.296 | -0.110 |
| 2001位 | 0.296 | 1 | -0.126 |
| 期間 | -0.110 | -0.126 | 1 |
期間 vs 1位
- 全データ

- 形式ごとに色分け

期間 vs 2001位
- 全データ
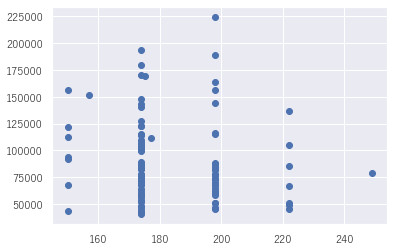
- 形式ごとに色分け

1位 vs 2001位
- 全データ

- 形式ごとに色分け

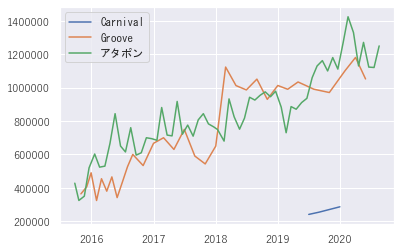
日付
1位ボーダー
- 全データ

- 形式ごとに色分け
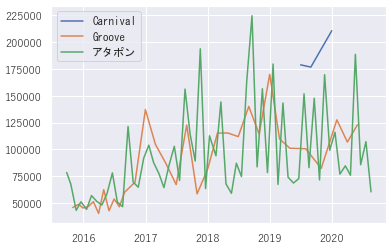
2001位ボーダー
- 全データ

- 形式ごとに色分け
期間
- 全データ
- 初期のイベントは200h超えがあるが、最近は160h~200hに固まっている

- 形式ごとに色分け

まとめ
- 形式
- 深堀りするなら、データ数が一番多いアタポンから手を付けるのが良さそう
- Carnivalはデータ数少ないから分析は厳しい
- 期間
- 期間が長いほどボーダーが高いかと思ったが、そうでもなかった
- 関係性ゼロではないと思うが、他の要因のほうが強いのかも
- 日付
- 傾向として、だんだん上がってるように見える
- パッと思いつく要因は以下
- プレイヤーが増えて争いが激しくなった
- ポイント稼ぎやすくなった
- キャラが増えた(能力インフレとか、放置編成できる人増えたとか)
- グランドライブとかできて、時間効率が上がった
- その他考えられる要因
- イベント毎のバラつき
- イベントランキング報酬のアイドルの人気
- イベント毎のバラつき