この記事は 検索エンジンプロダクトを一緒に開発してた同窓会 Advent Calendar 2023 の10日目の記事です。
昨日は todokr さんの CRaCを用いたJavaアプリケーションの起動高速化 でした。
はじめに
自分の前回の記事(deck.glで今年飲んだワインの本数と色の割合をクラスタリングして地図上に表示してみた)で今年からワインに惹かれ飲み始めたことを書きました。
ワインを覚えていく中で、いくつかの苦戦がありましたが、その一つが地域の名前でした。
店員さんがワインを紹介してくださっても、その産地に馴染みがないため、なかなか頭に残りませんでした。
それどころか、覚えたと思ってもすぐに忘れてしまうことがしばしばありました。
ワイン一本一本には独自の個性があり、当然それぞれの味わいをきちんと理解したいと思います。
しかし、基本的な知識がないと、それらを覚えていくのは一層難しくなります。
特に、ワインはその産地ごとに独特の特徴を持っていて、これを理解すればワインの傾向をつかむ手助けになります。
だからこそ、まずその産地の名前と位置を覚えることから始める必要があると感じ、自分の学ぶを助けてくれるツールを作ろうと思いました。
数あるワイン生産国の中でも、自分自身がスペイン語勉強中ということもあり、まずはスペインから学んでいこうと思いました。
最終的なアウトプット

仕様
- 自治州の名前が表示されるので、マップ上の正しい区画をタップする
- 正解の場合はタップした区画を赤で囲い、自治州の名前を表示する
- 不正解の場合は正解の区画を青で囲い、自治州の名前を表示する
- すべての州に解答したらクイズ終了とする
GeoJSONの用意
Opendatasoftが提供するAutonomous communities - Vintage/Millésimé - Spainをダウンロードさせていただきました。
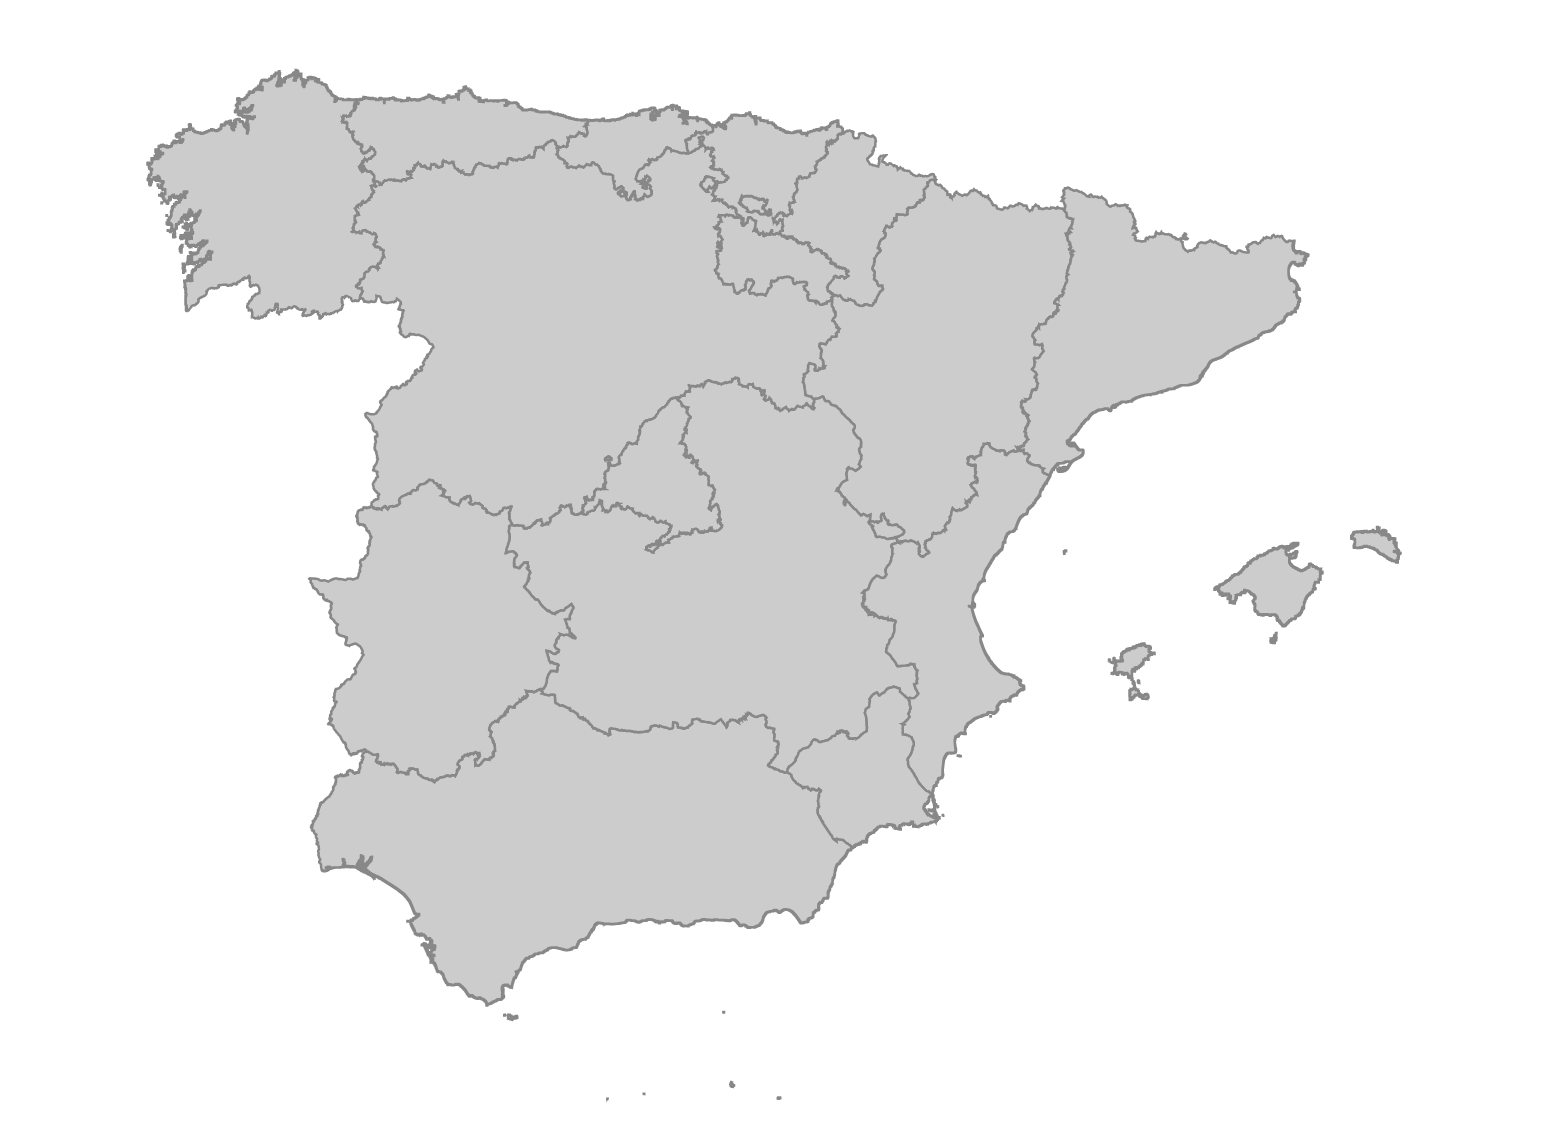
GeoJSONデータを元に地図を描画する
まずはGeoJSONを読み込み、D3を使用して地図を描画します。
D3はDOM要素を直接更新するため、useRefでsvg要素の参照を取得できるようにします。
次にselect関数にsvg要素の参照(ref.current)を渡し、D3がこのsvg要素を操作するための準備をします。
あとは読み込んだGeoJSONをSelectionオブジェクトのdata関数に渡すと自治州を表示出来るようになります。
import React, {useEffect, useRef} from "react";
import * as d3 from "d3";
import type {
    FeatureCollection,
} from "geojson";

const height = 500;
const width = 500;
const projection = d3.geoMercator();
const pathGenerator = d3.geoPath().projection(projection);

function Sample() {
    const ref = useRef(null);
    useEffect(() => {
        (async () => {
            const geoJson = await fetch(`/data.json`).then((res) =>
                res.json()
            ) as FeatureCollection;

            projection.fitSize([width, height], geoJson);

            d3.select(ref.current)
                .selectAll("path")
                .data(geoJson.features)
                .join("path")
                .attr("d", pathGenerator)
                .attr("fill", "#ccc")
                .attr("stroke", "#888");
        })();
    }, []);

    return (
        <svg
            ref={ref}
            style={{width: "60%", height: window.innerHeight * 0.8}}
            viewBox={`0 0 ${width} ${height}`}
        />
    );
}

export default App;
下記のように表示されます。
区画をタップし次の州あてに進めるようにする
各SVGパス要素にクリックイベントハンドラを追加します。
このハンドラ内で、タップされた地域を次の対象から除外し、新たな地域をランダムに選出し、次のタップするべき州として出題するようにします。
    const ref = useRef(null);
    const [geoJson, setGeoJson] = useState<FeatureCollection | null>(null);
    const [currentName, setCurrentCommunity] = useState<string | null>(null);
    const [communityNames, setCommunityNames] = useState<string[]>([]);

    useEffect(() => {
        (async () => {
            const geoJson = await fetch(`/data.json`).then((res) =>
                res.json()
            ) as FeatureCollection;
            setGeoJson(geoJson);

            projection.fitSize([width, height], geoJson);

            const communityNames = geoJson.features.map((d) => d.properties!.name) as string[];
            setCommunityNames(communityNames);

            const randomIndex = Math.floor(Math.random() * communityNames.length);
            setCurrentCommunity(setCommunityNames[randomIndex]);
        })();
    }, []);

    useEffect(() => {
        if (!geoJson) return;

        projection.fitSize([width, height], geoJson!);
        const svg = d3.select(ref.current)
        svg
            .selectAll("path")
            .data((geoJson as FeatureCollection).features)
            .join("path")
            .attr("d", pathGenerator)
            .attr("fill", "#ccc")
            .attr("stroke", "#888")
            .attr("data-name", (d) => d.properties?.name)
            .on("click", function (event, d) {
                const leftCommunityNames = communityNames.filter(e => e !== currentCommunity);
                const randomIndex = Math.floor(Math.random() * leftCommunityNames.length);
                setCommunityNames(leftCommunityNames);
                setCurrentCommunity(leftCommunityNames[randomIndex]);
            });
    }, [communityNames]);

    return (
        {currentCommunity && <p>Click {currentCommunity}</p>}
        <svg
            ref={ref}
            style={{width: "60%", height: window.innerHeight * 0.8}}
            viewBox={`0 0 ${width} ${height}`}
        />
    );
区画を塗りつぶす
正否判定を行い、正解の場合はタップした区画を赤で囲い、不正解の場合は青で囲うようにします。
svgの作成時に各pathに州名を付与しているので、selectメソッドで出題した州を取得し、その色を変えます。
useEffect(() => {
  // 途中までのコードは省略
  svg
    .on("click", function (event, d) {
        if (d.properties?.name === currentCommunity) {
          svg
            .select(`path[data-name='${currentCommunity}']`)
            .style("fill", "#FF0060");
        } else {
          svg
            .select(`path[data-name='${currentCommunity}']`)
            .style("fill", "#0079FF");
        }
    }
}, [communityNames]);
区画に名前を表示する
まずはFeature<Geometry, GeoJsonProperties>オブジェクトを取得します。
click関数の第二引数にはclickされたFeatureオブジェクトが渡ってくるので、正解時の場合はそれを使います。
不正解時の場合は、GeoJsonから出題した州のFeatureオブジェクトを取得します。
次にpathGenerator.centroid()の引数にFeatureオブジェクトを与え、中央座標を取得し設定します。
このままだと州名が中央から始まり、右寄せの状態で表示されてしまうのでattr("text-anchor", "middle")で、テキストを水平方向に中央揃えにします。
最後にtext関数に州名を渡すと、タップ後に州名を表示することができるようになります。
useEffect(() => {
  // 途中までのコードは省略
  svg
    .on("click", function (event, d) {
        if (d.properties?.name === currentCommunity) {
          svg
            .select(`path[data-name='${currentCommunity}']`)
            .style("fill", "#FF0060");

          // 区画上の中心に州名を表示
          svg
            .append("text")
            .attr("class", "place-label")
            .attr("transform", "translate(" + pathGenerator.centroid(d) + ")")
            .attr("text-anchor", "middle") // テキストを水平方向に中央揃えにする
            .attr("font-size", "10px")
            .text(currentCommunity);

        } else {
          svg
            .select(`path[data-name='${currentCommunity}']`)
            .style("fill", "#0079FF");

          const correctData = geoJson.features.find((feature) => feature.properties?.name === currentCommunity);

          if (correctData) {
            svg
                .append("text")
                .attr("class", "place-label")
                .attr("transform","translate(" + pathGenerator.centroid(correctData) + ")")
                .attr("text-anchor", "middle")
                .attr("font-size", "10px")
                .text(currentCommunity);
            }
        }
    }
}, [communityNames]);
終わりに
日常で使ってみた結果、結構覚えるのに役立っているなと実感しています。
現在はフランス、ドイツ版も作成しました。
まだまだやりたいことが山積みなので、引き続き改良を続けていきたいと思います。