0
0

Delete article

Deleted articles cannot be recovered.

Draft of this article would be also deleted.

Are you sure you want to delete this article?

Power BI 表を作成

0
Last updated at Posted at 2026-09-29

一連の投稿で、
「Cognos Analytics をエンドユーザーの方に自己学習して頂くためのサイト」 (https://qiita.com/shinyama/items/95885c7246dc413b6448)
内の手順をPower BIで再現してみます。
今回は上記サイトのうち「Cognos Analytics レポートでリストを作成し保存する」という手順を行います。

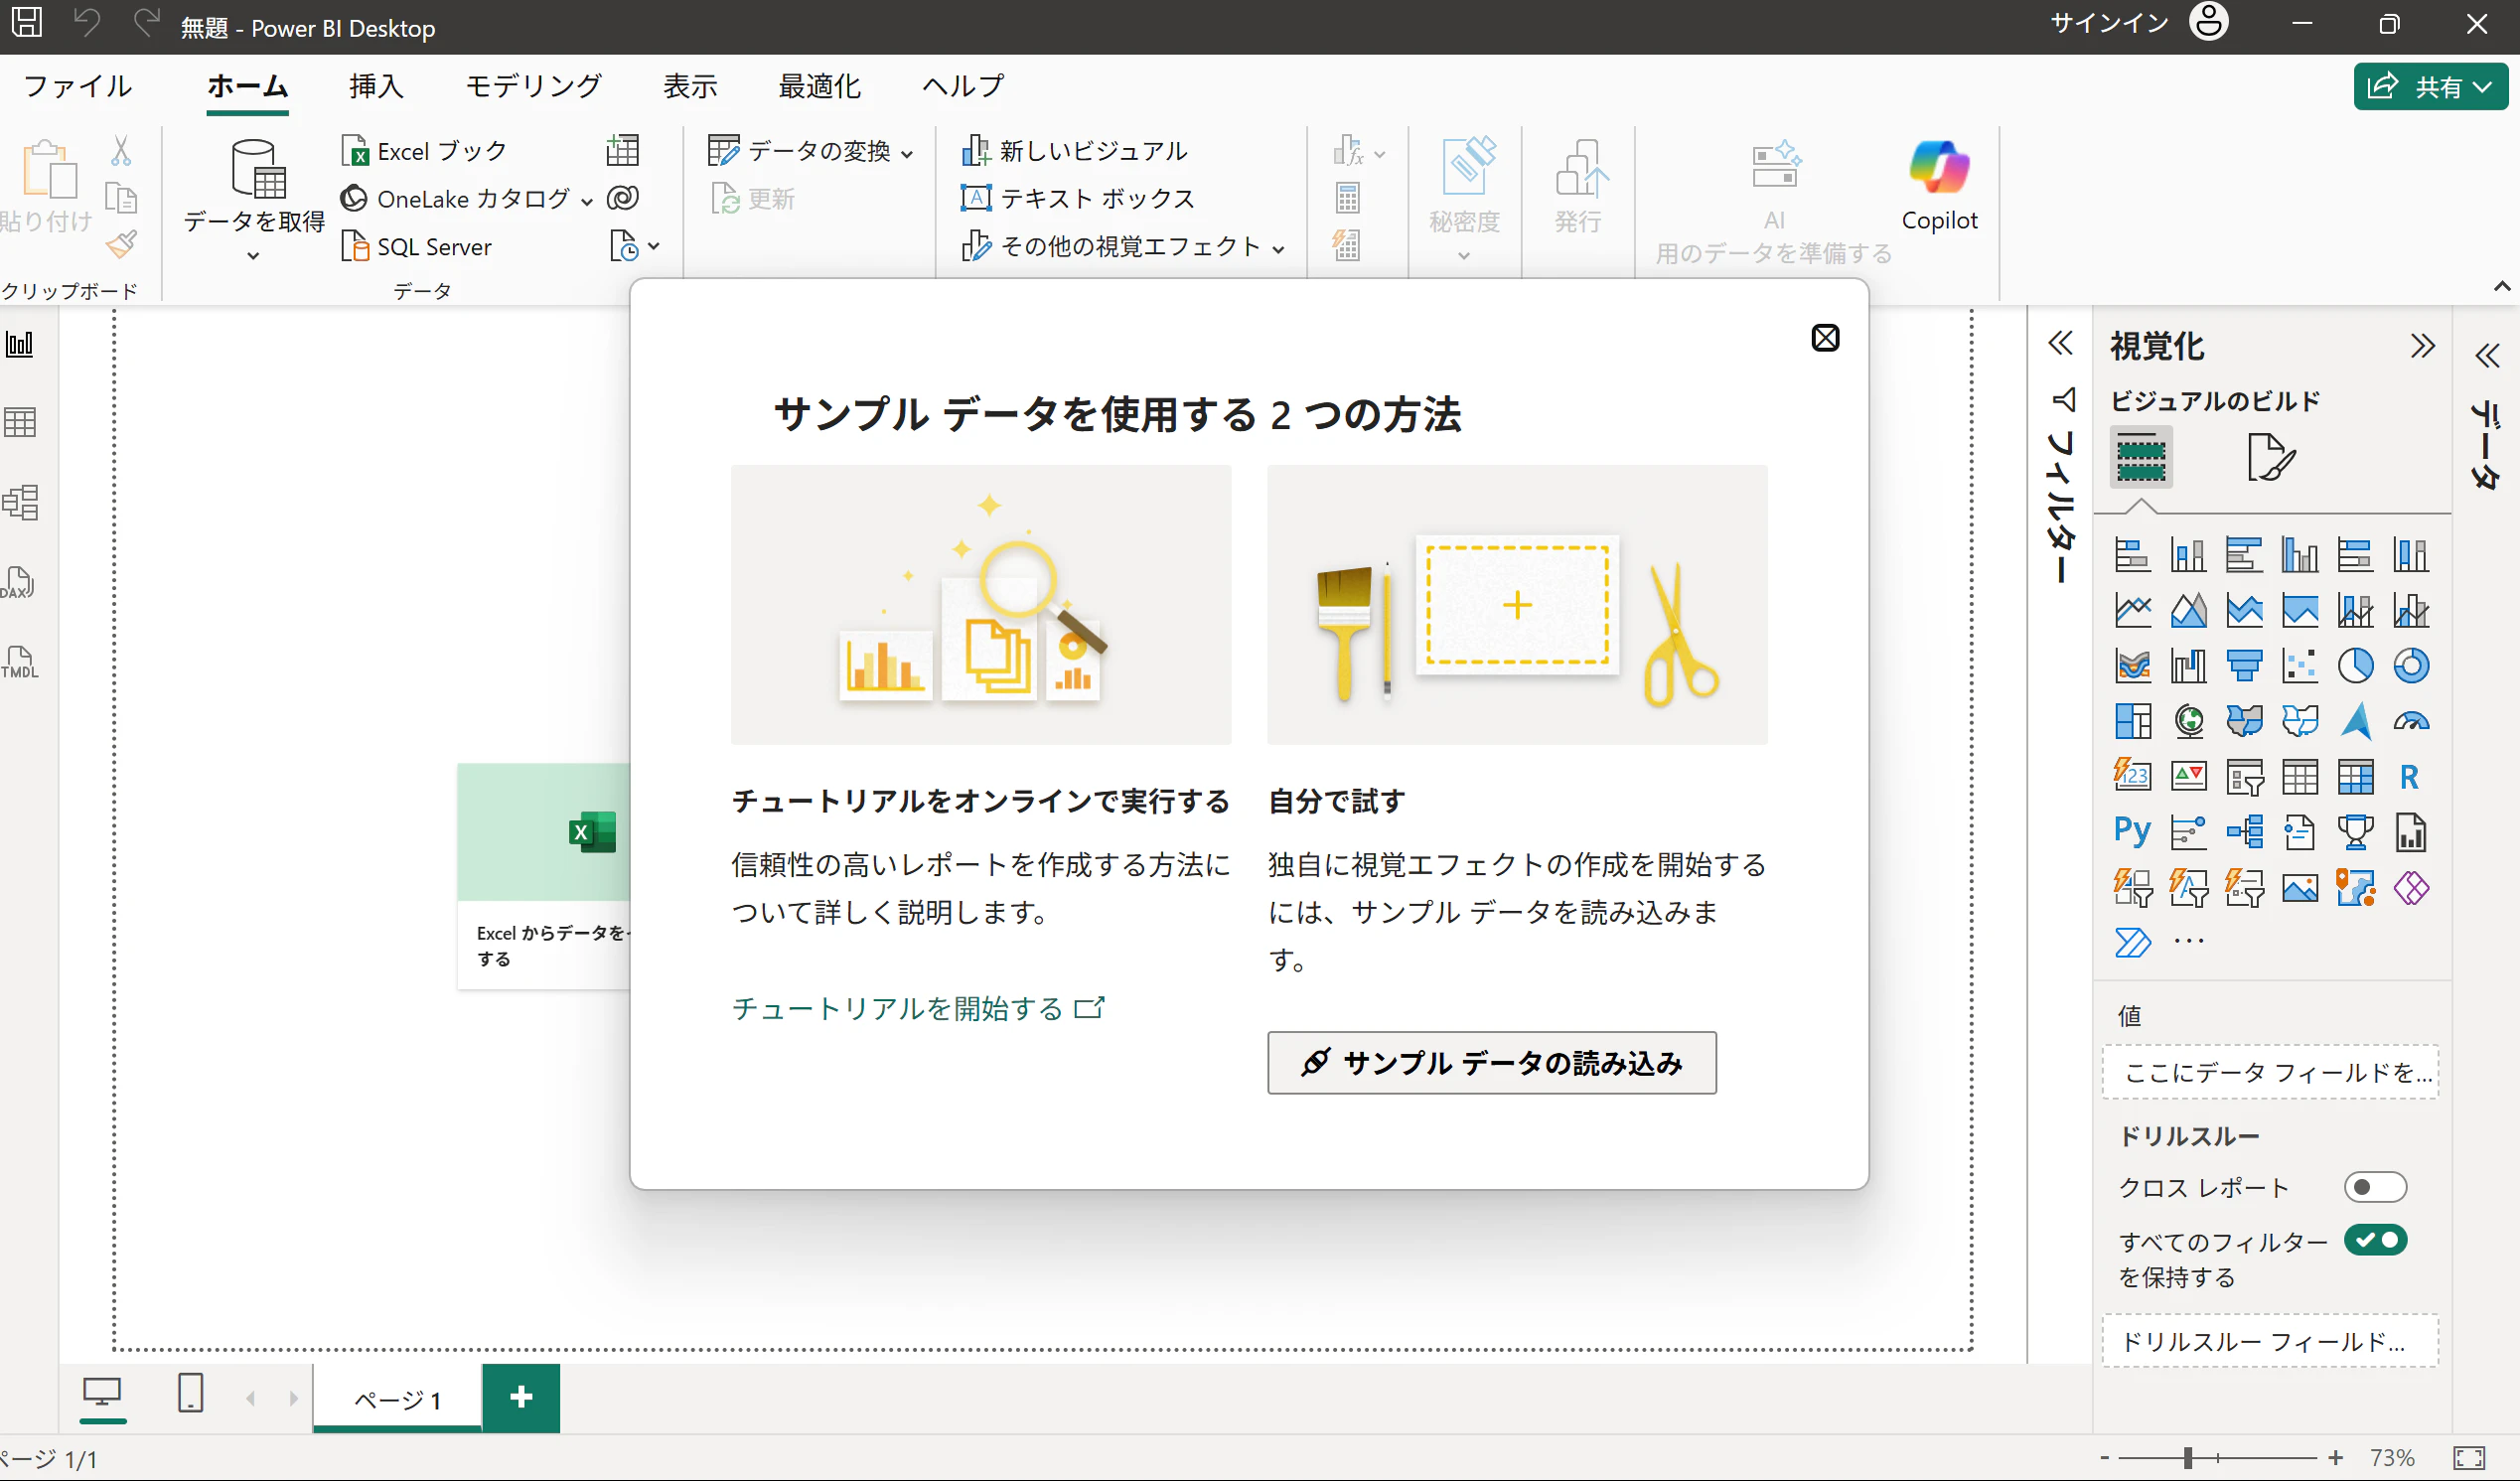
1.画面中央にある「サンプル データ の使用」のボタンをクリック
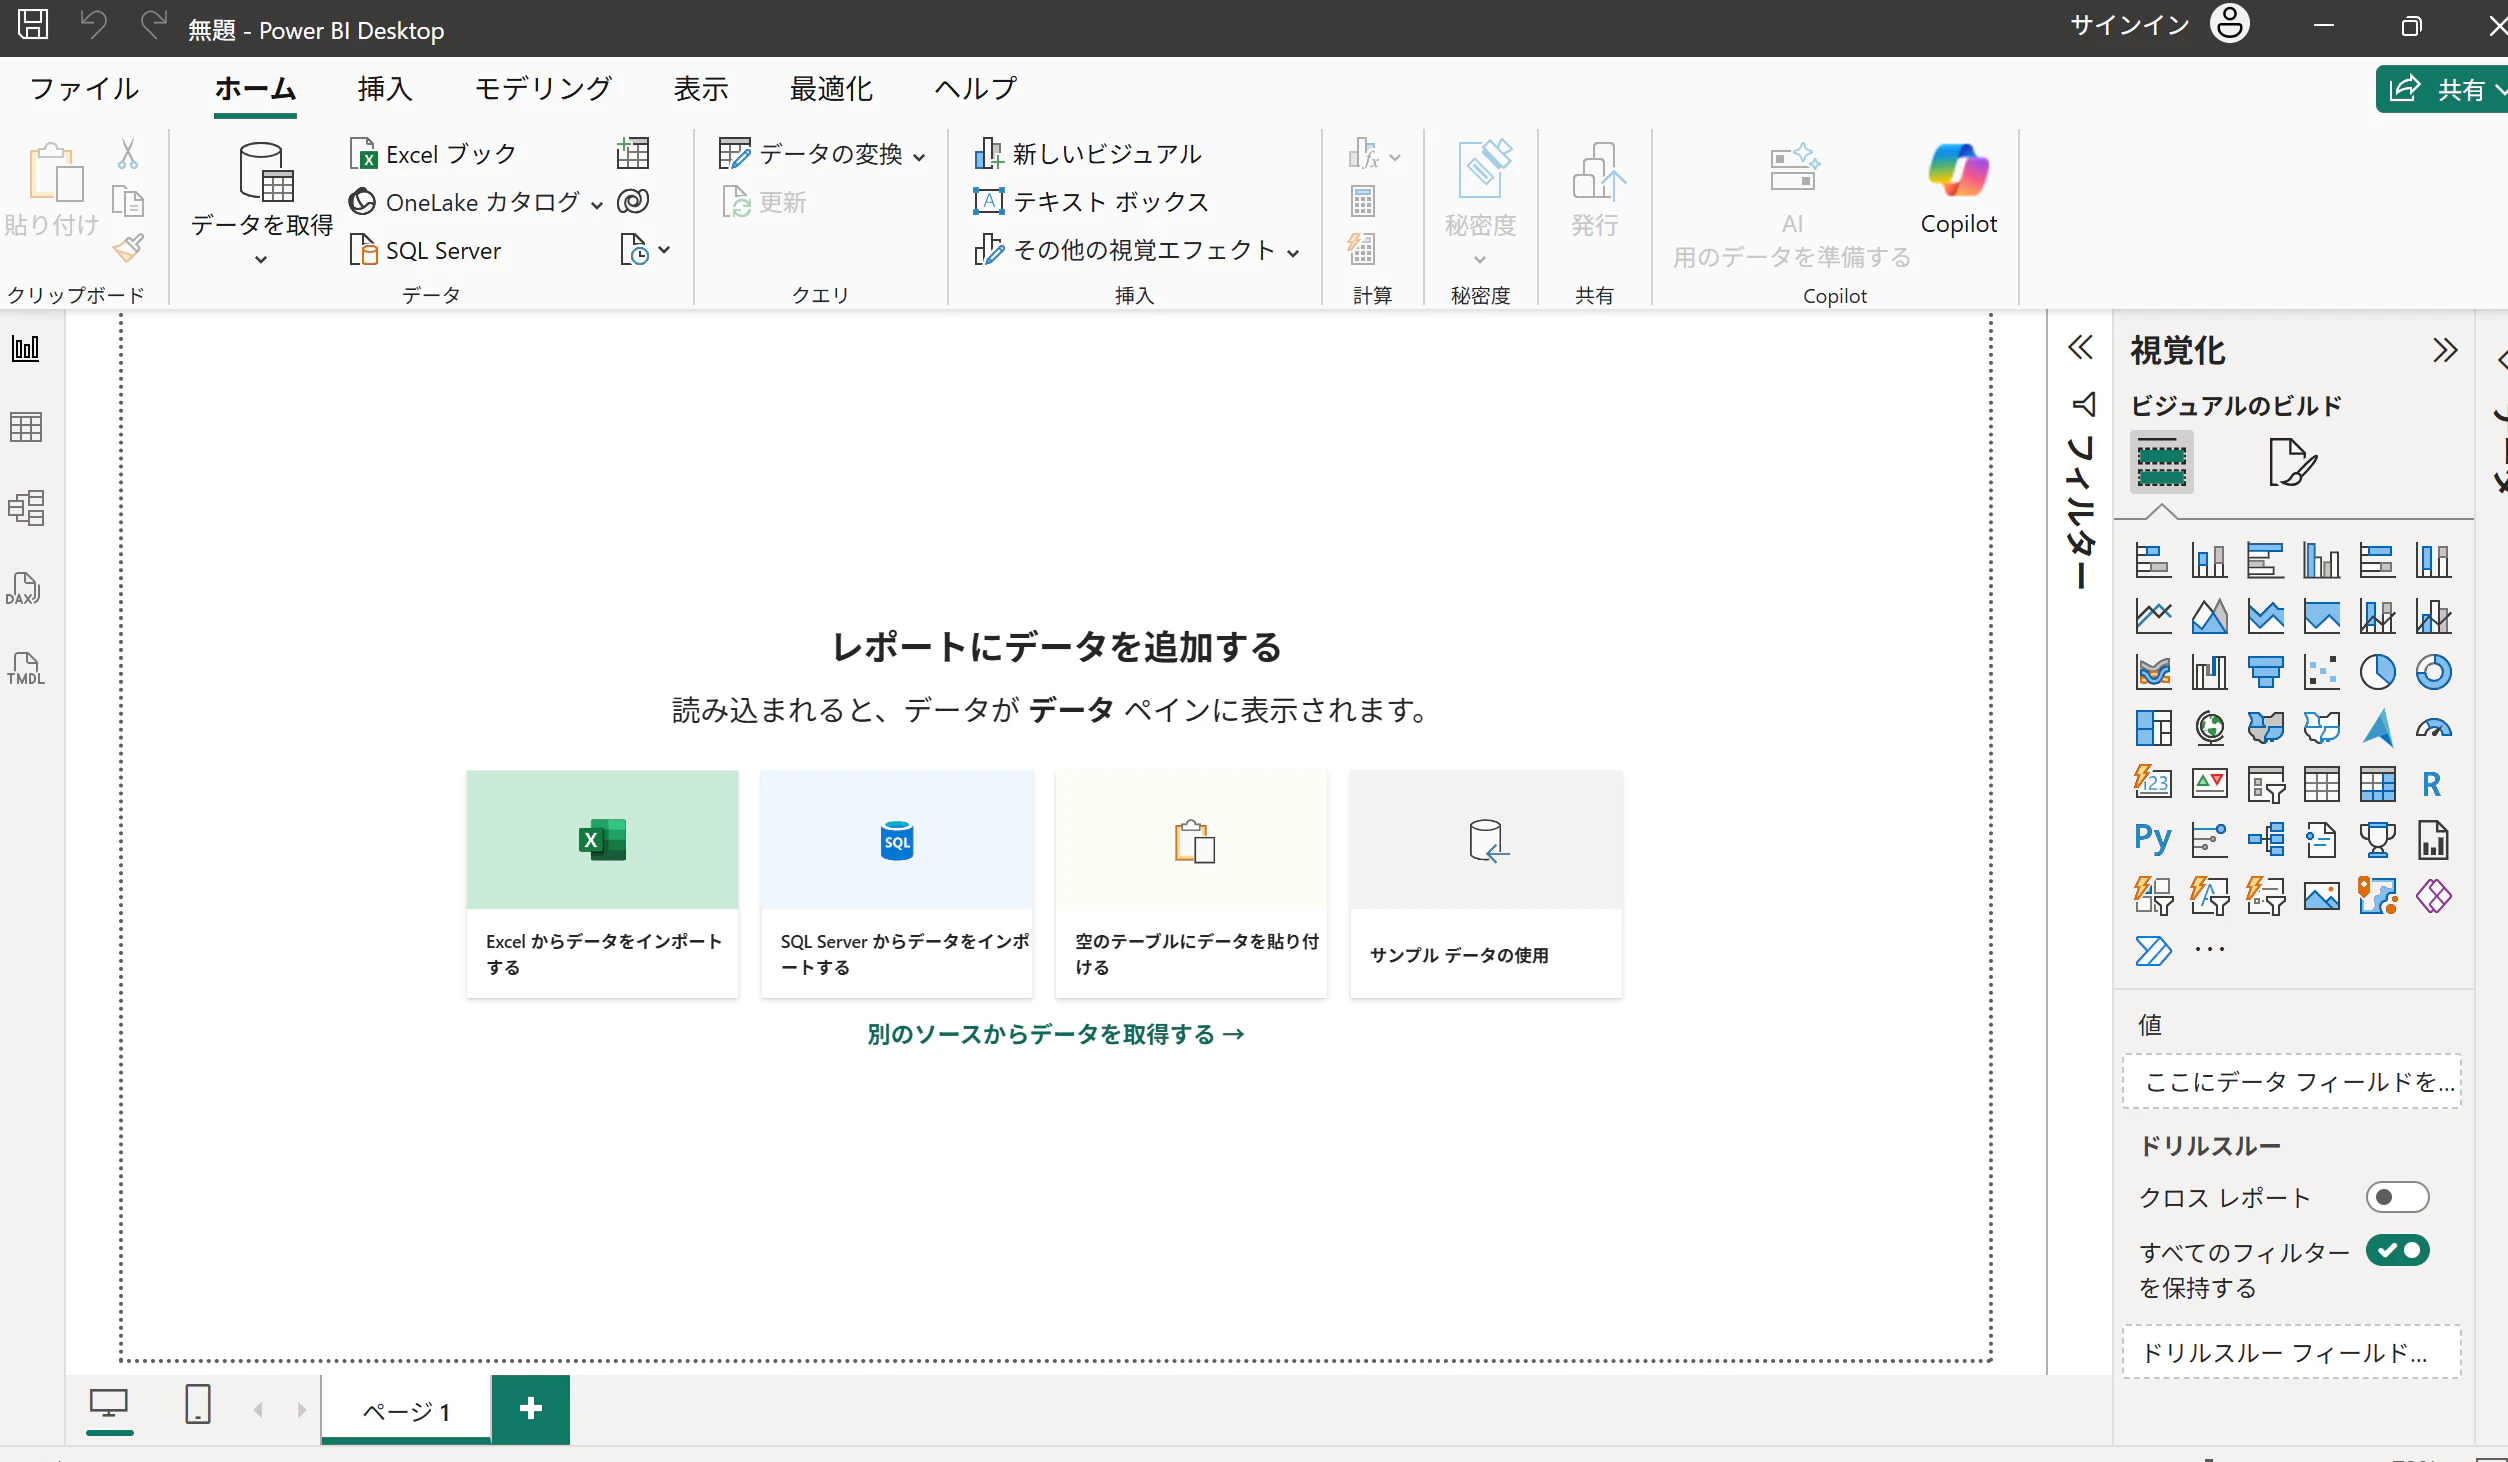
image.png

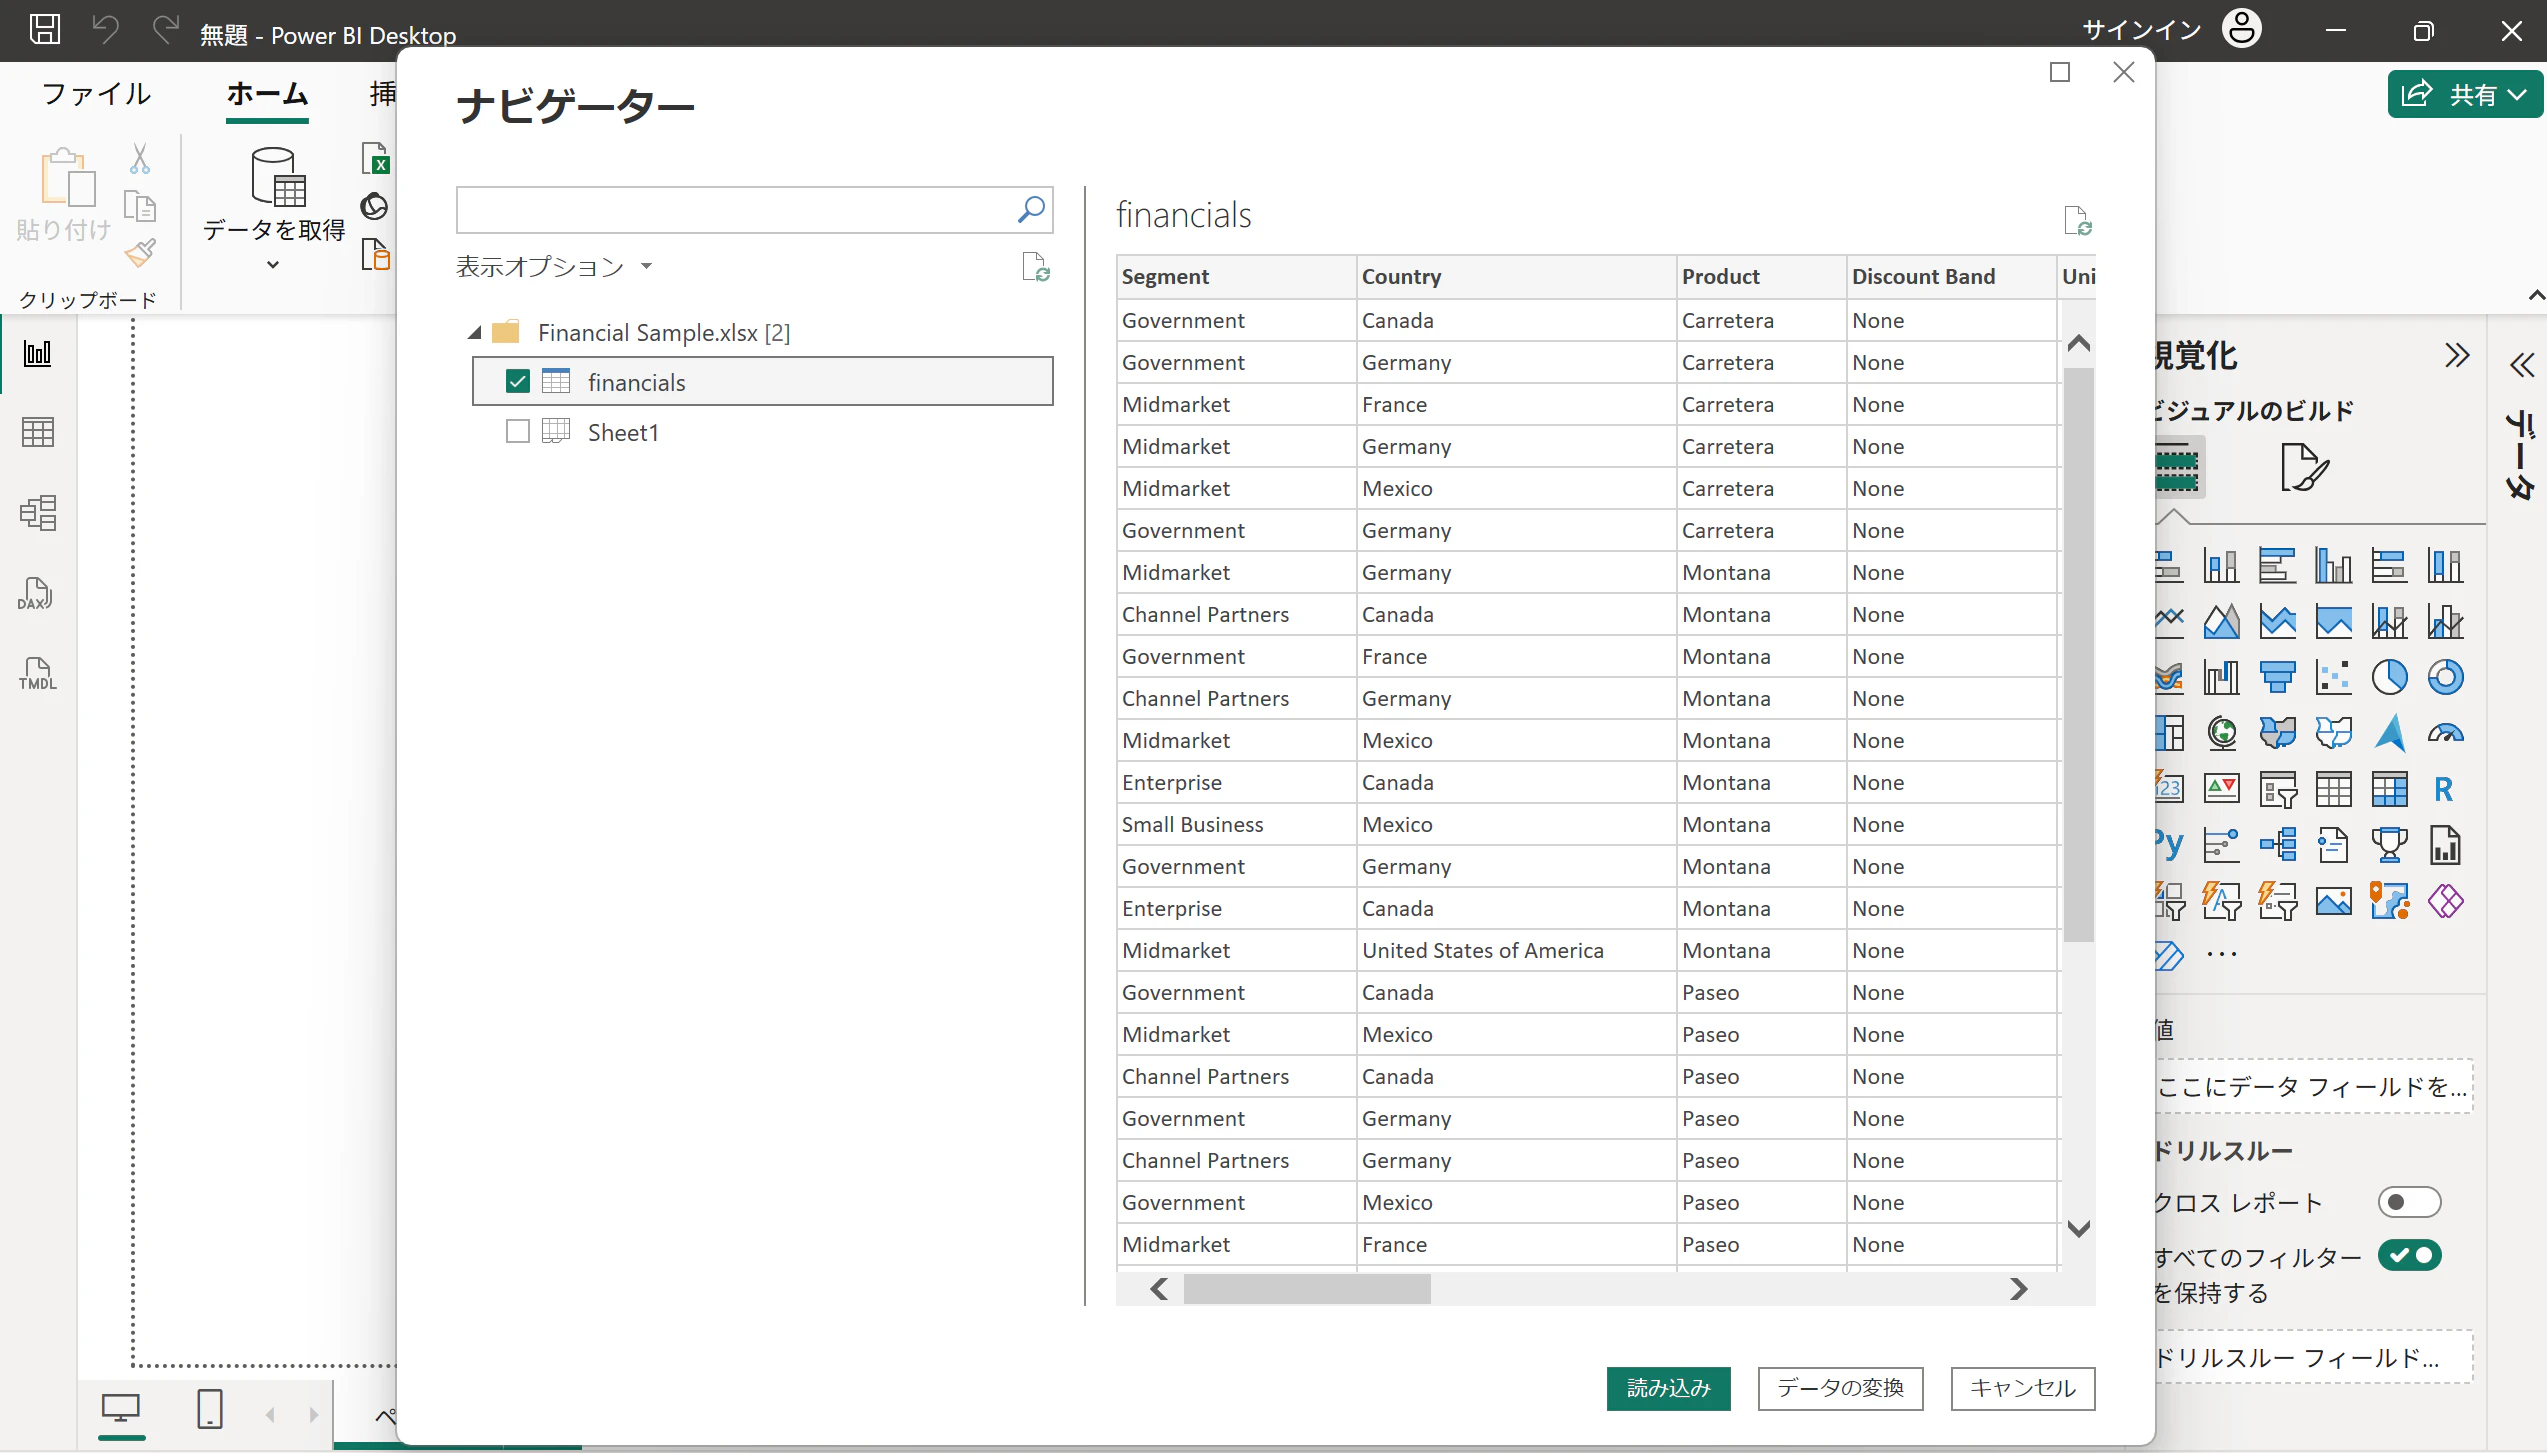
2.サンプルデータの読み込み
image.png

3.「financials」のチェックボックスにチェックを入れ読み込み
image.png

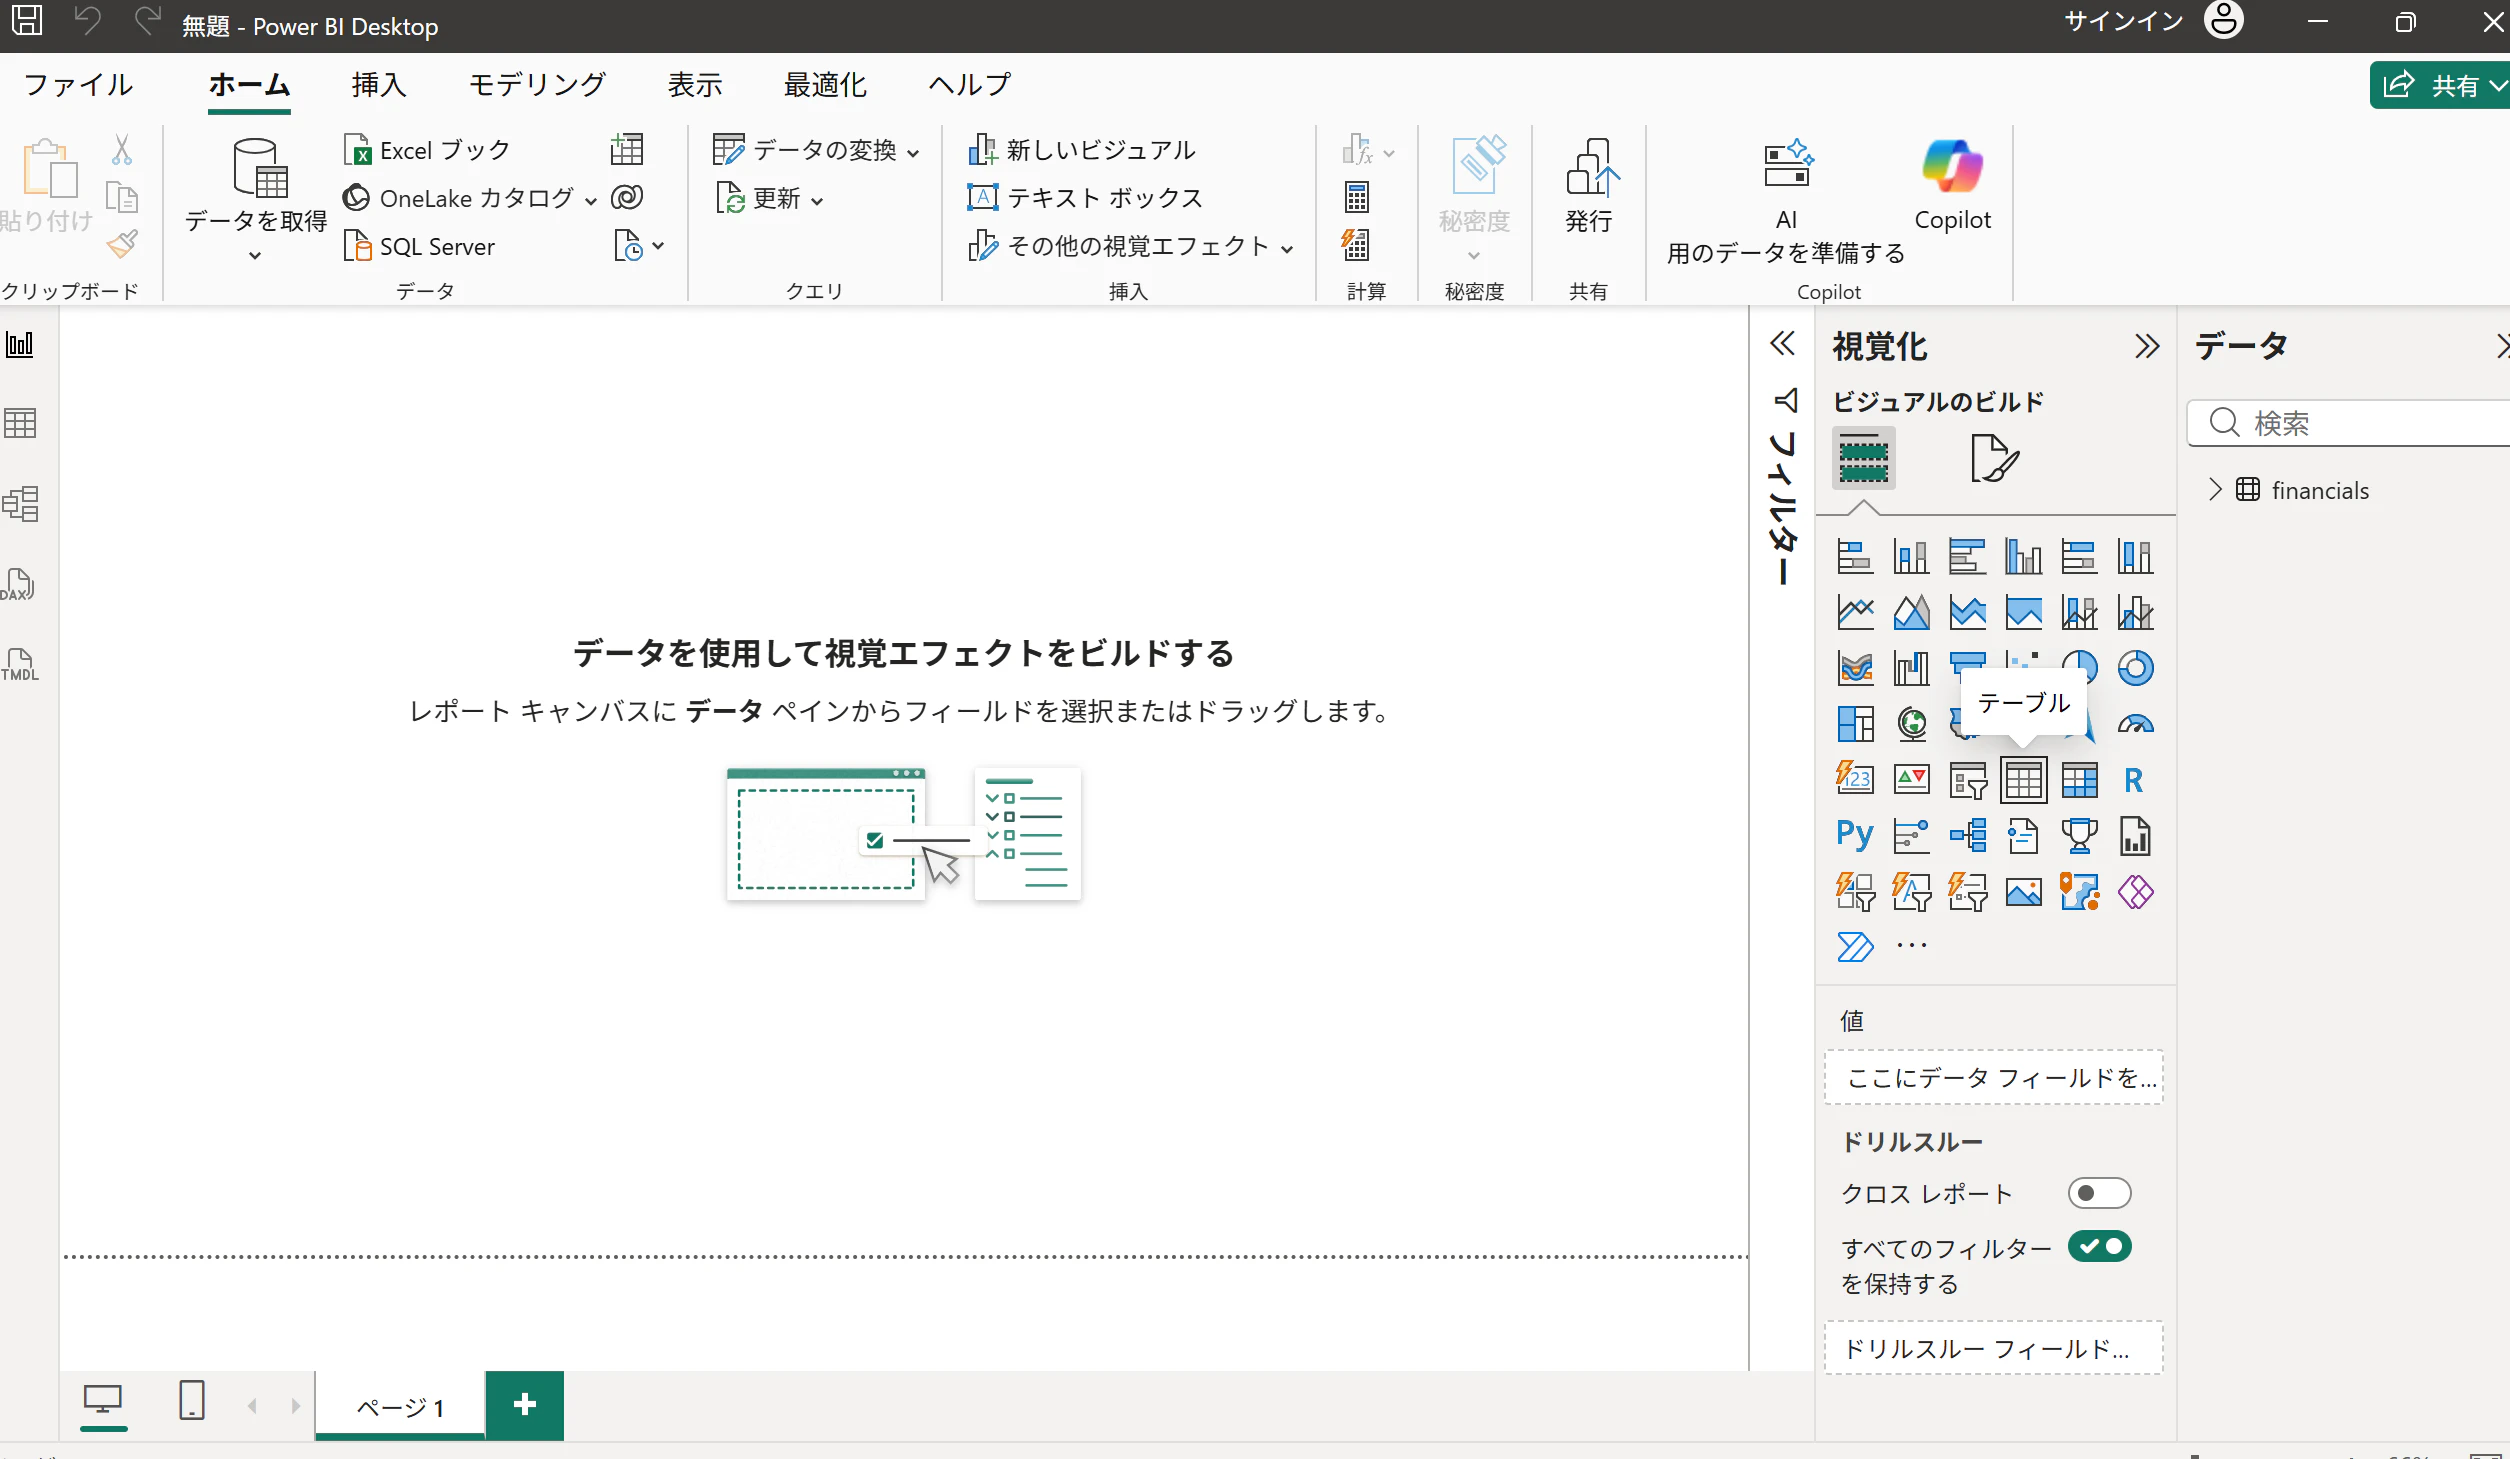
4.視覚化>テーブル からテーブルを配置
image.png

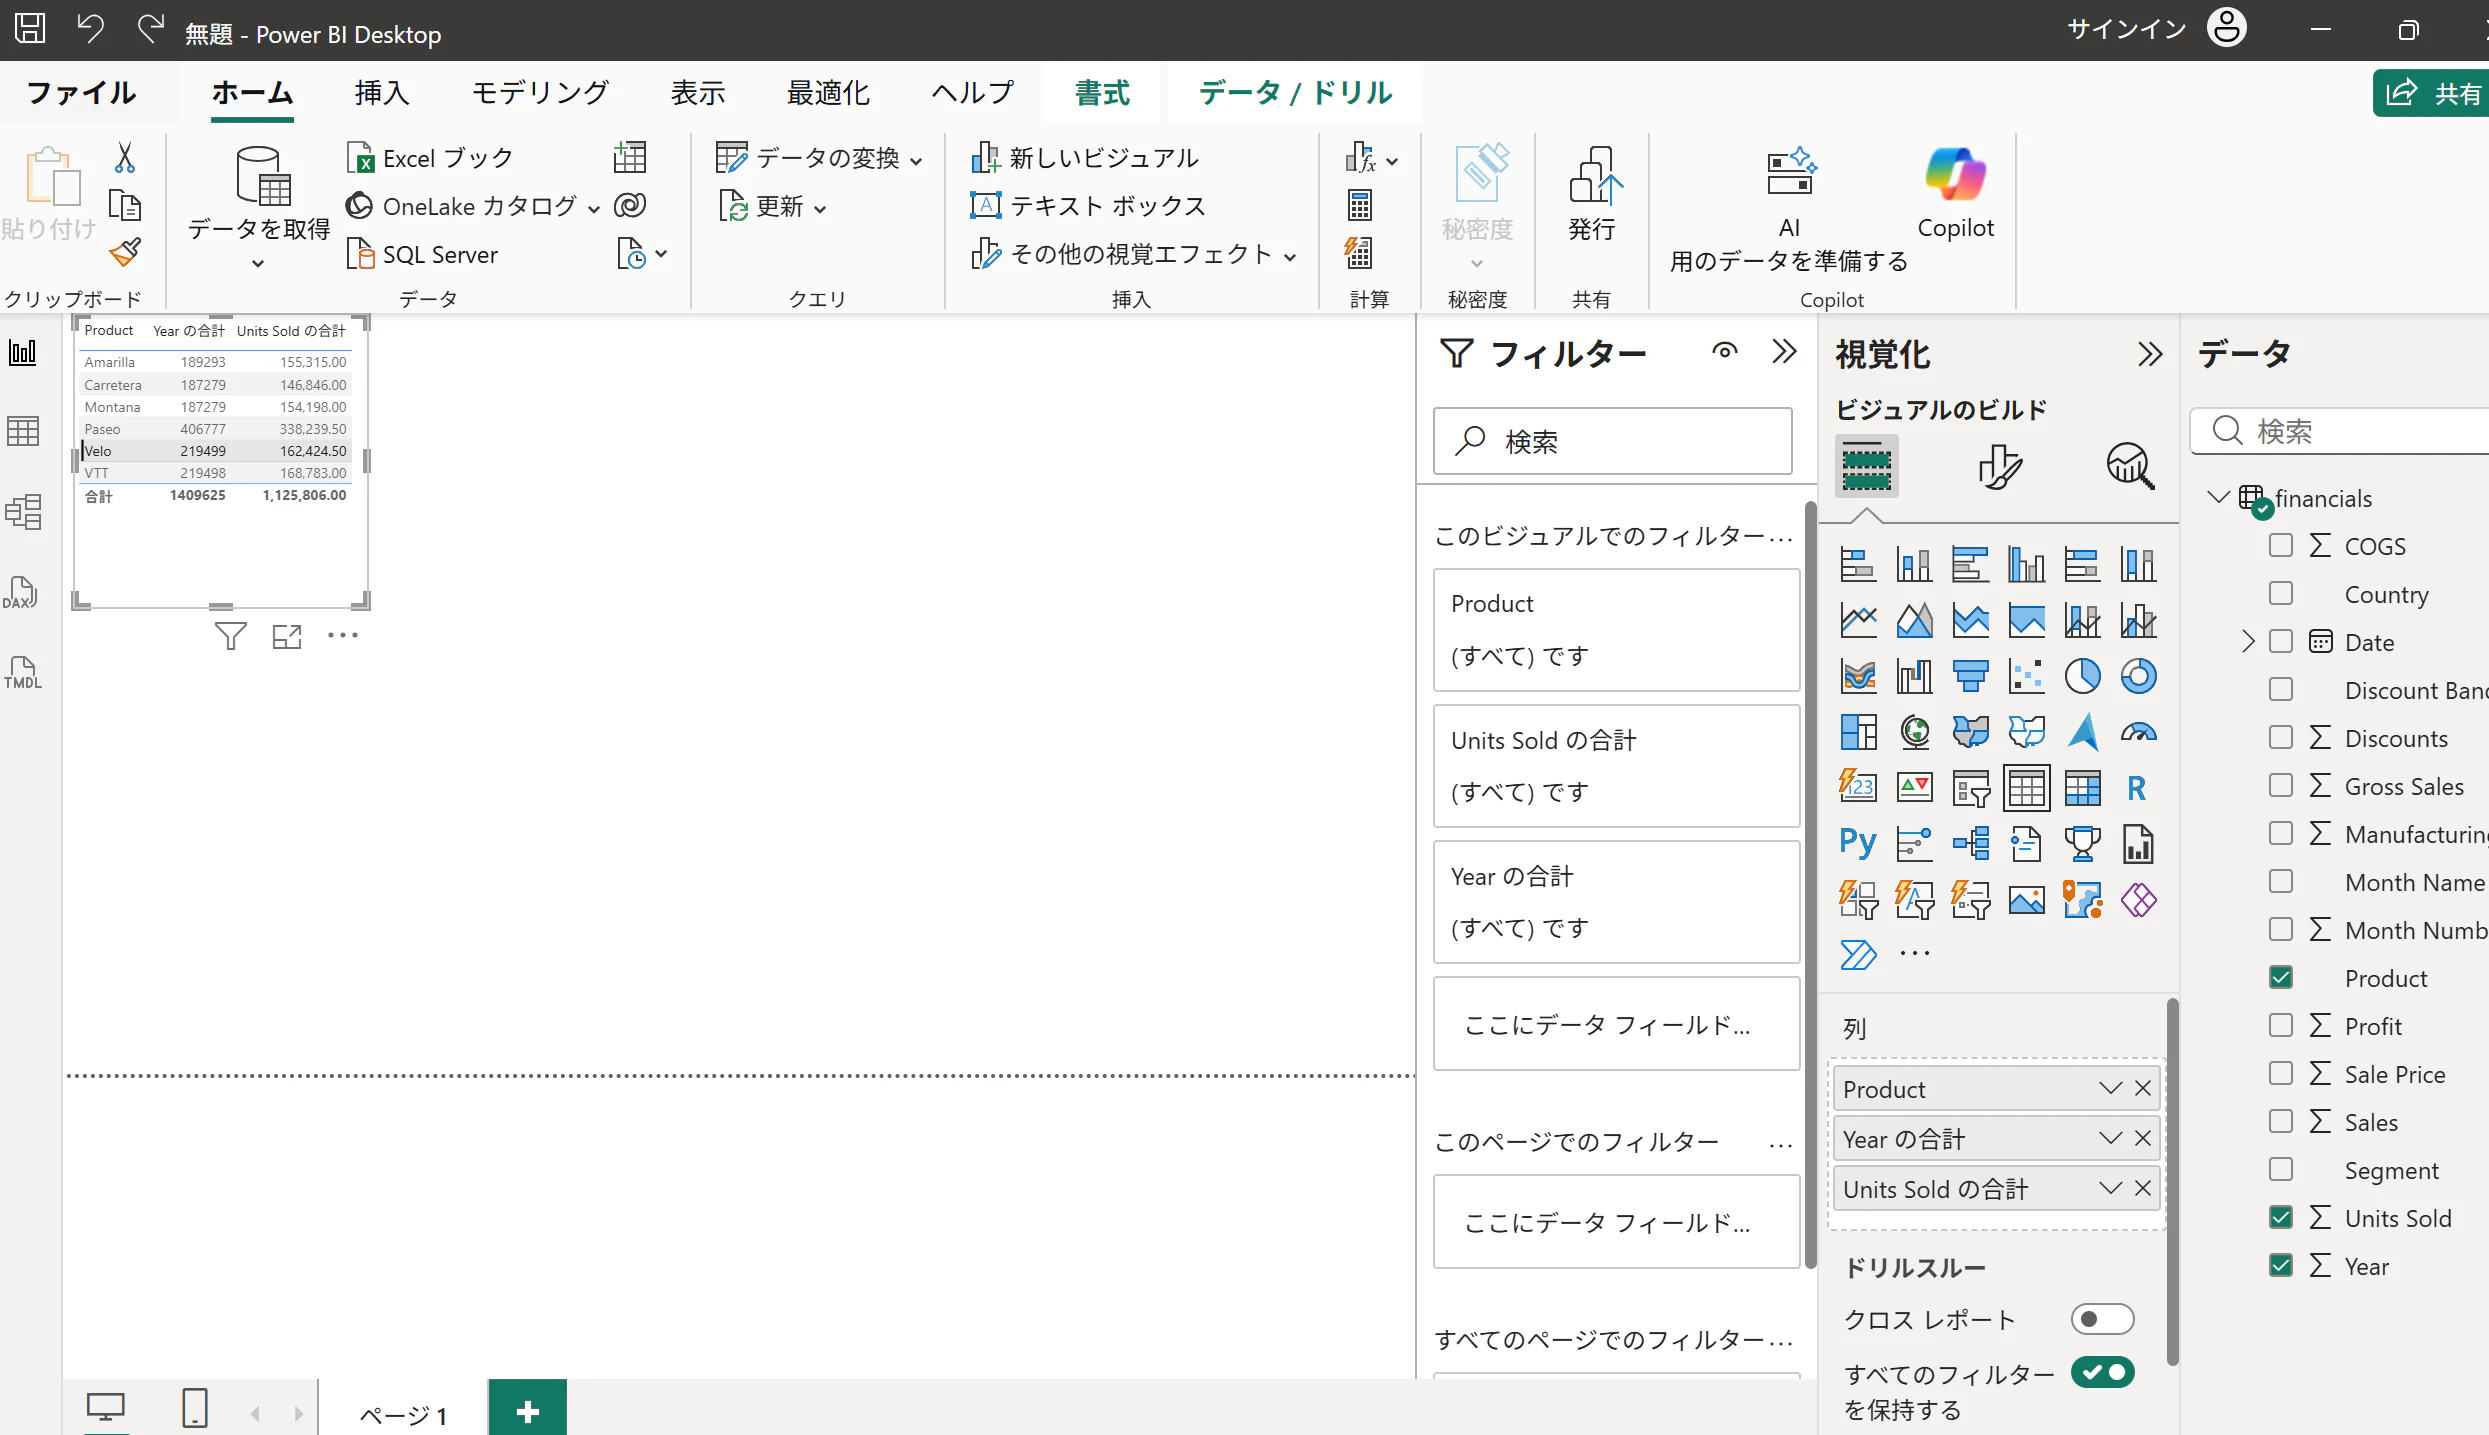
5.データ>Product, Year, Unit Sold にチェック
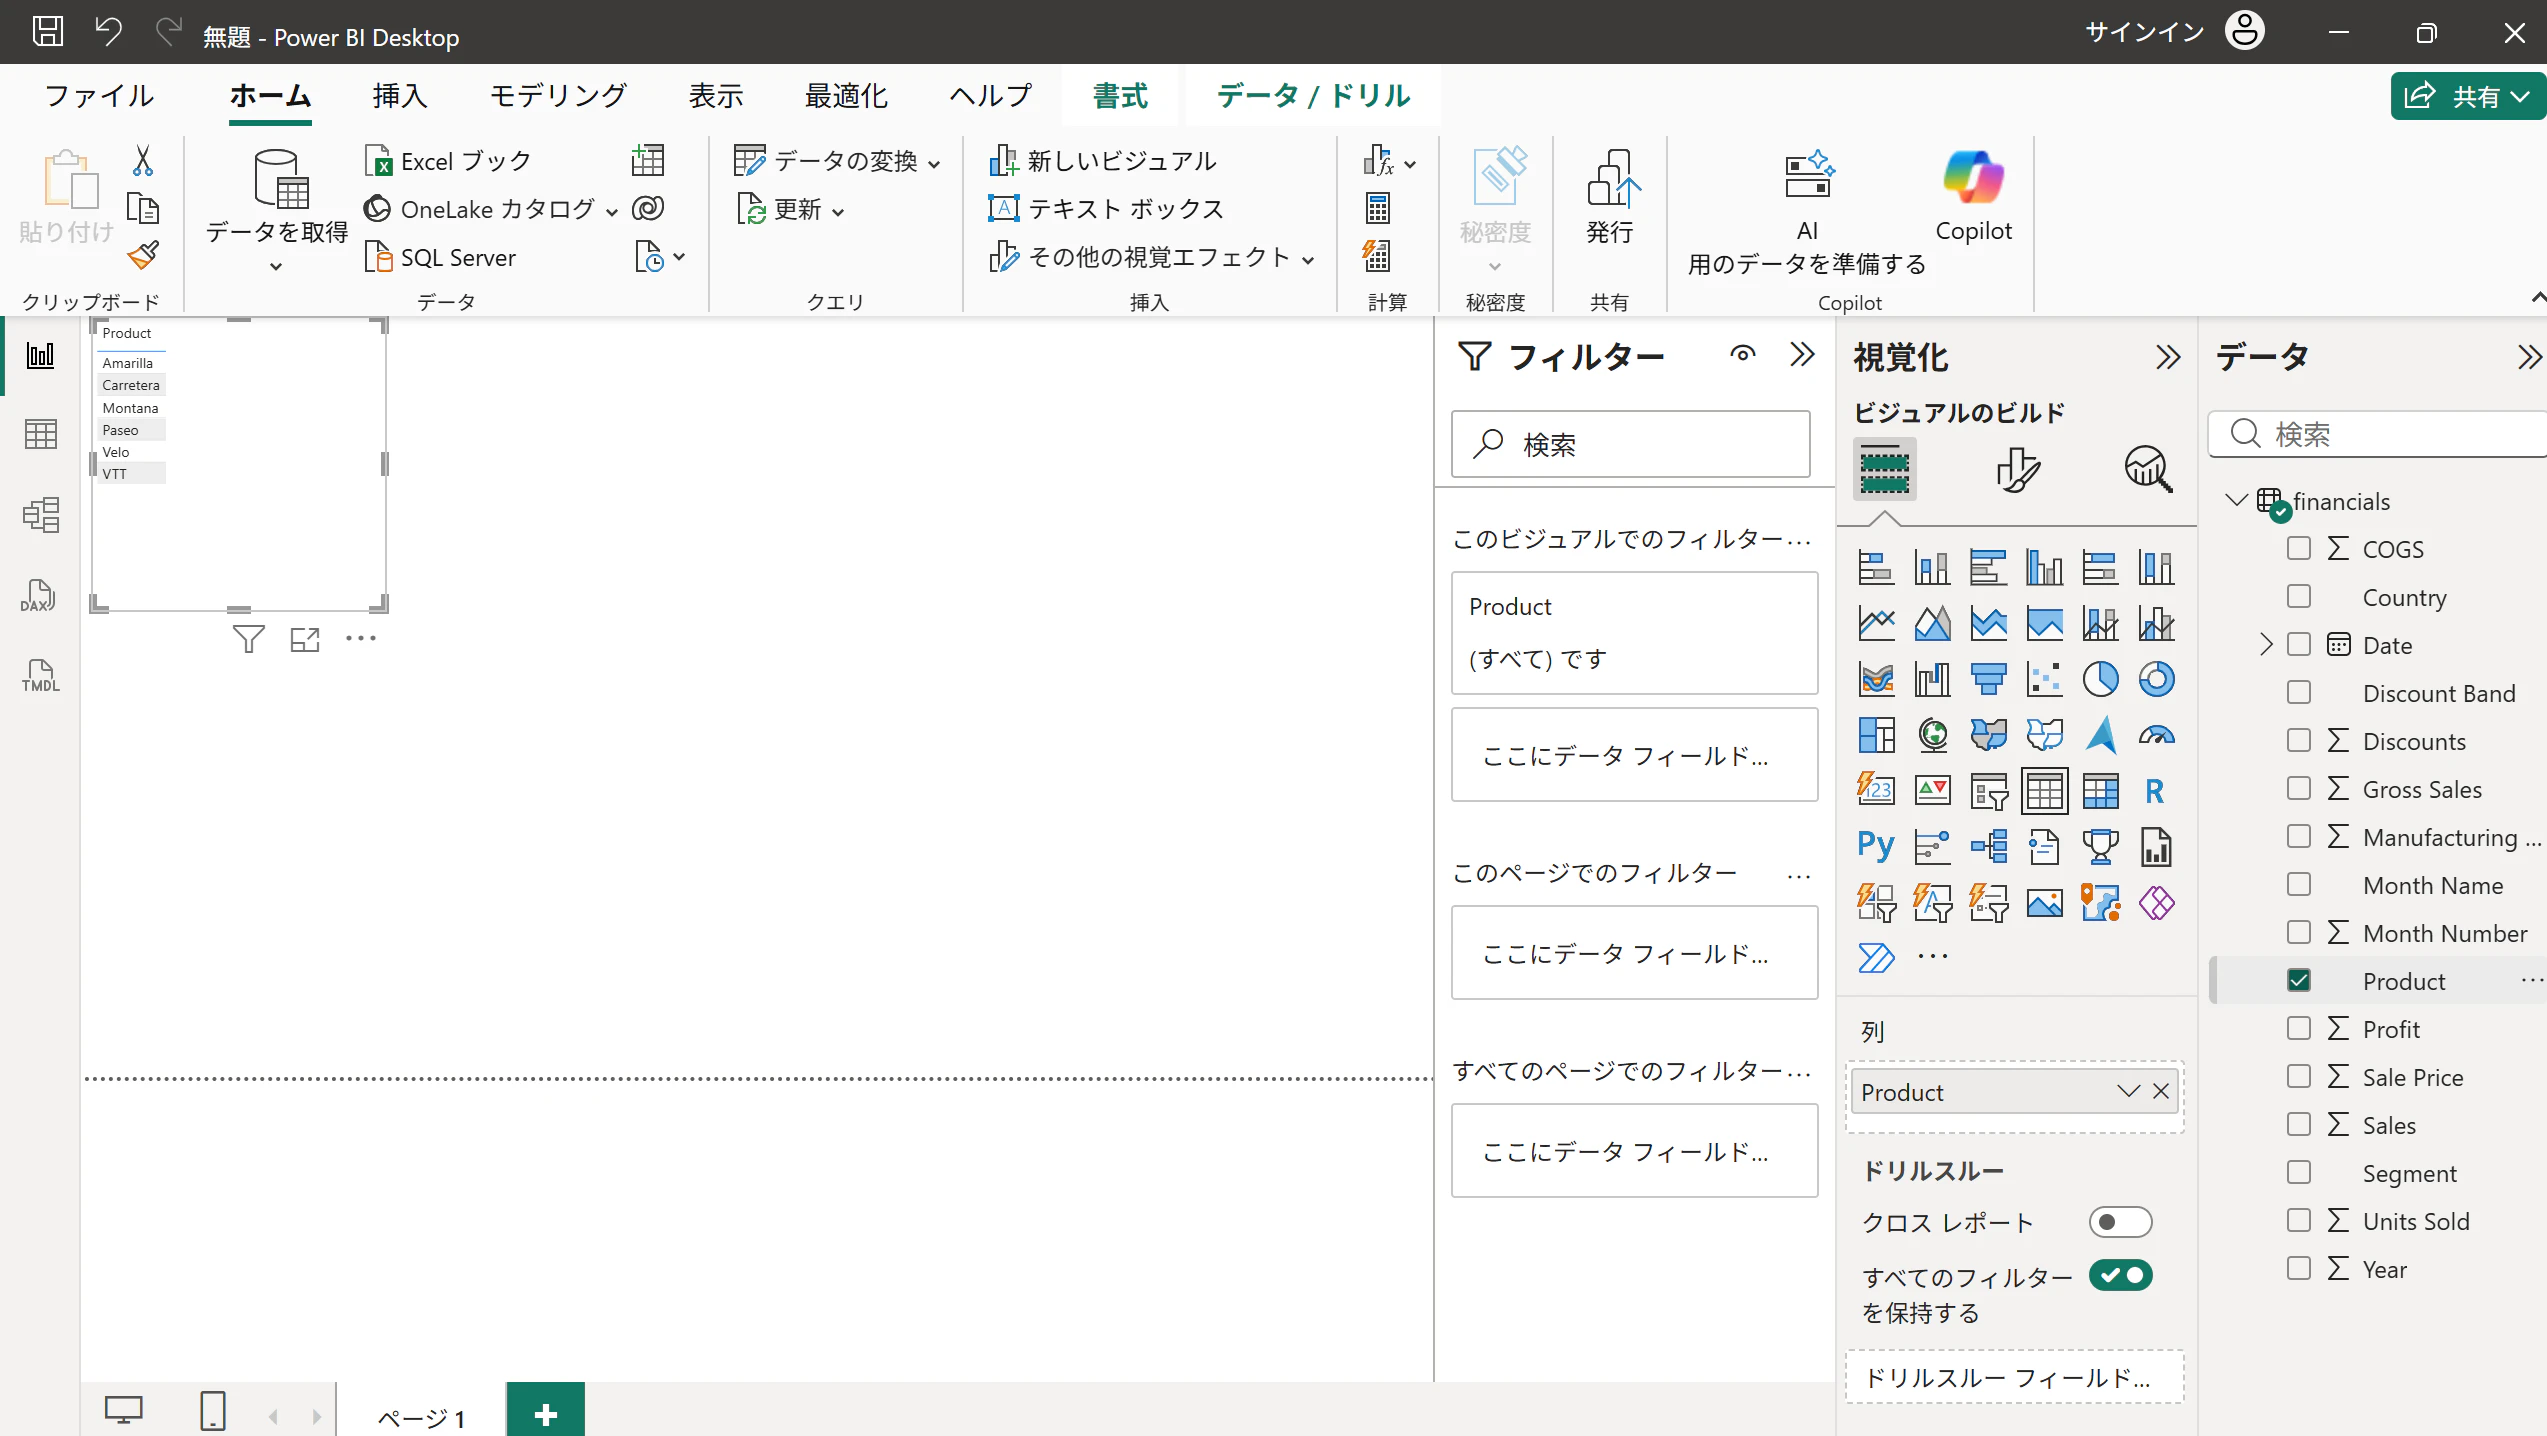
image.png
image.png

6.ファイル>名前を付けて保存

0
0
0

Register as a new user and use Qiita more conveniently

  1. You get articles that match your needs
  2. You can efficiently read back useful information
  3. You can use dark theme
What you can do with signing up
0
0

Delete article

Deleted articles cannot be recovered.

Draft of this article would be also deleted.

Are you sure you want to delete this article?