一連の投稿で、
「Cognos Analytics をエンドユーザーの方に自己学習して頂くためのサイト」 (Cognos Analytics レポート グラフとリストを自在に配置する)
内の手順をPower BIで再現してみます。
今回は上記サイトのうち「Cognos Analytics レポート グラフとリストを自在に配置する」という手順を行います。
※Power BIは、PowerPointのように「キャンバス上に各ビジュアルを直接置き、絶対位置(X/Y座標)とサイズ(幅/高さ)で自由配置する」設計になっています。そのため、Cognosのような「レイアウト用のテーブル枠を配置してそこにドラッグ&ドロップする」という概念・操作自体が存在しません。
1.視覚化オブジェクトの配置
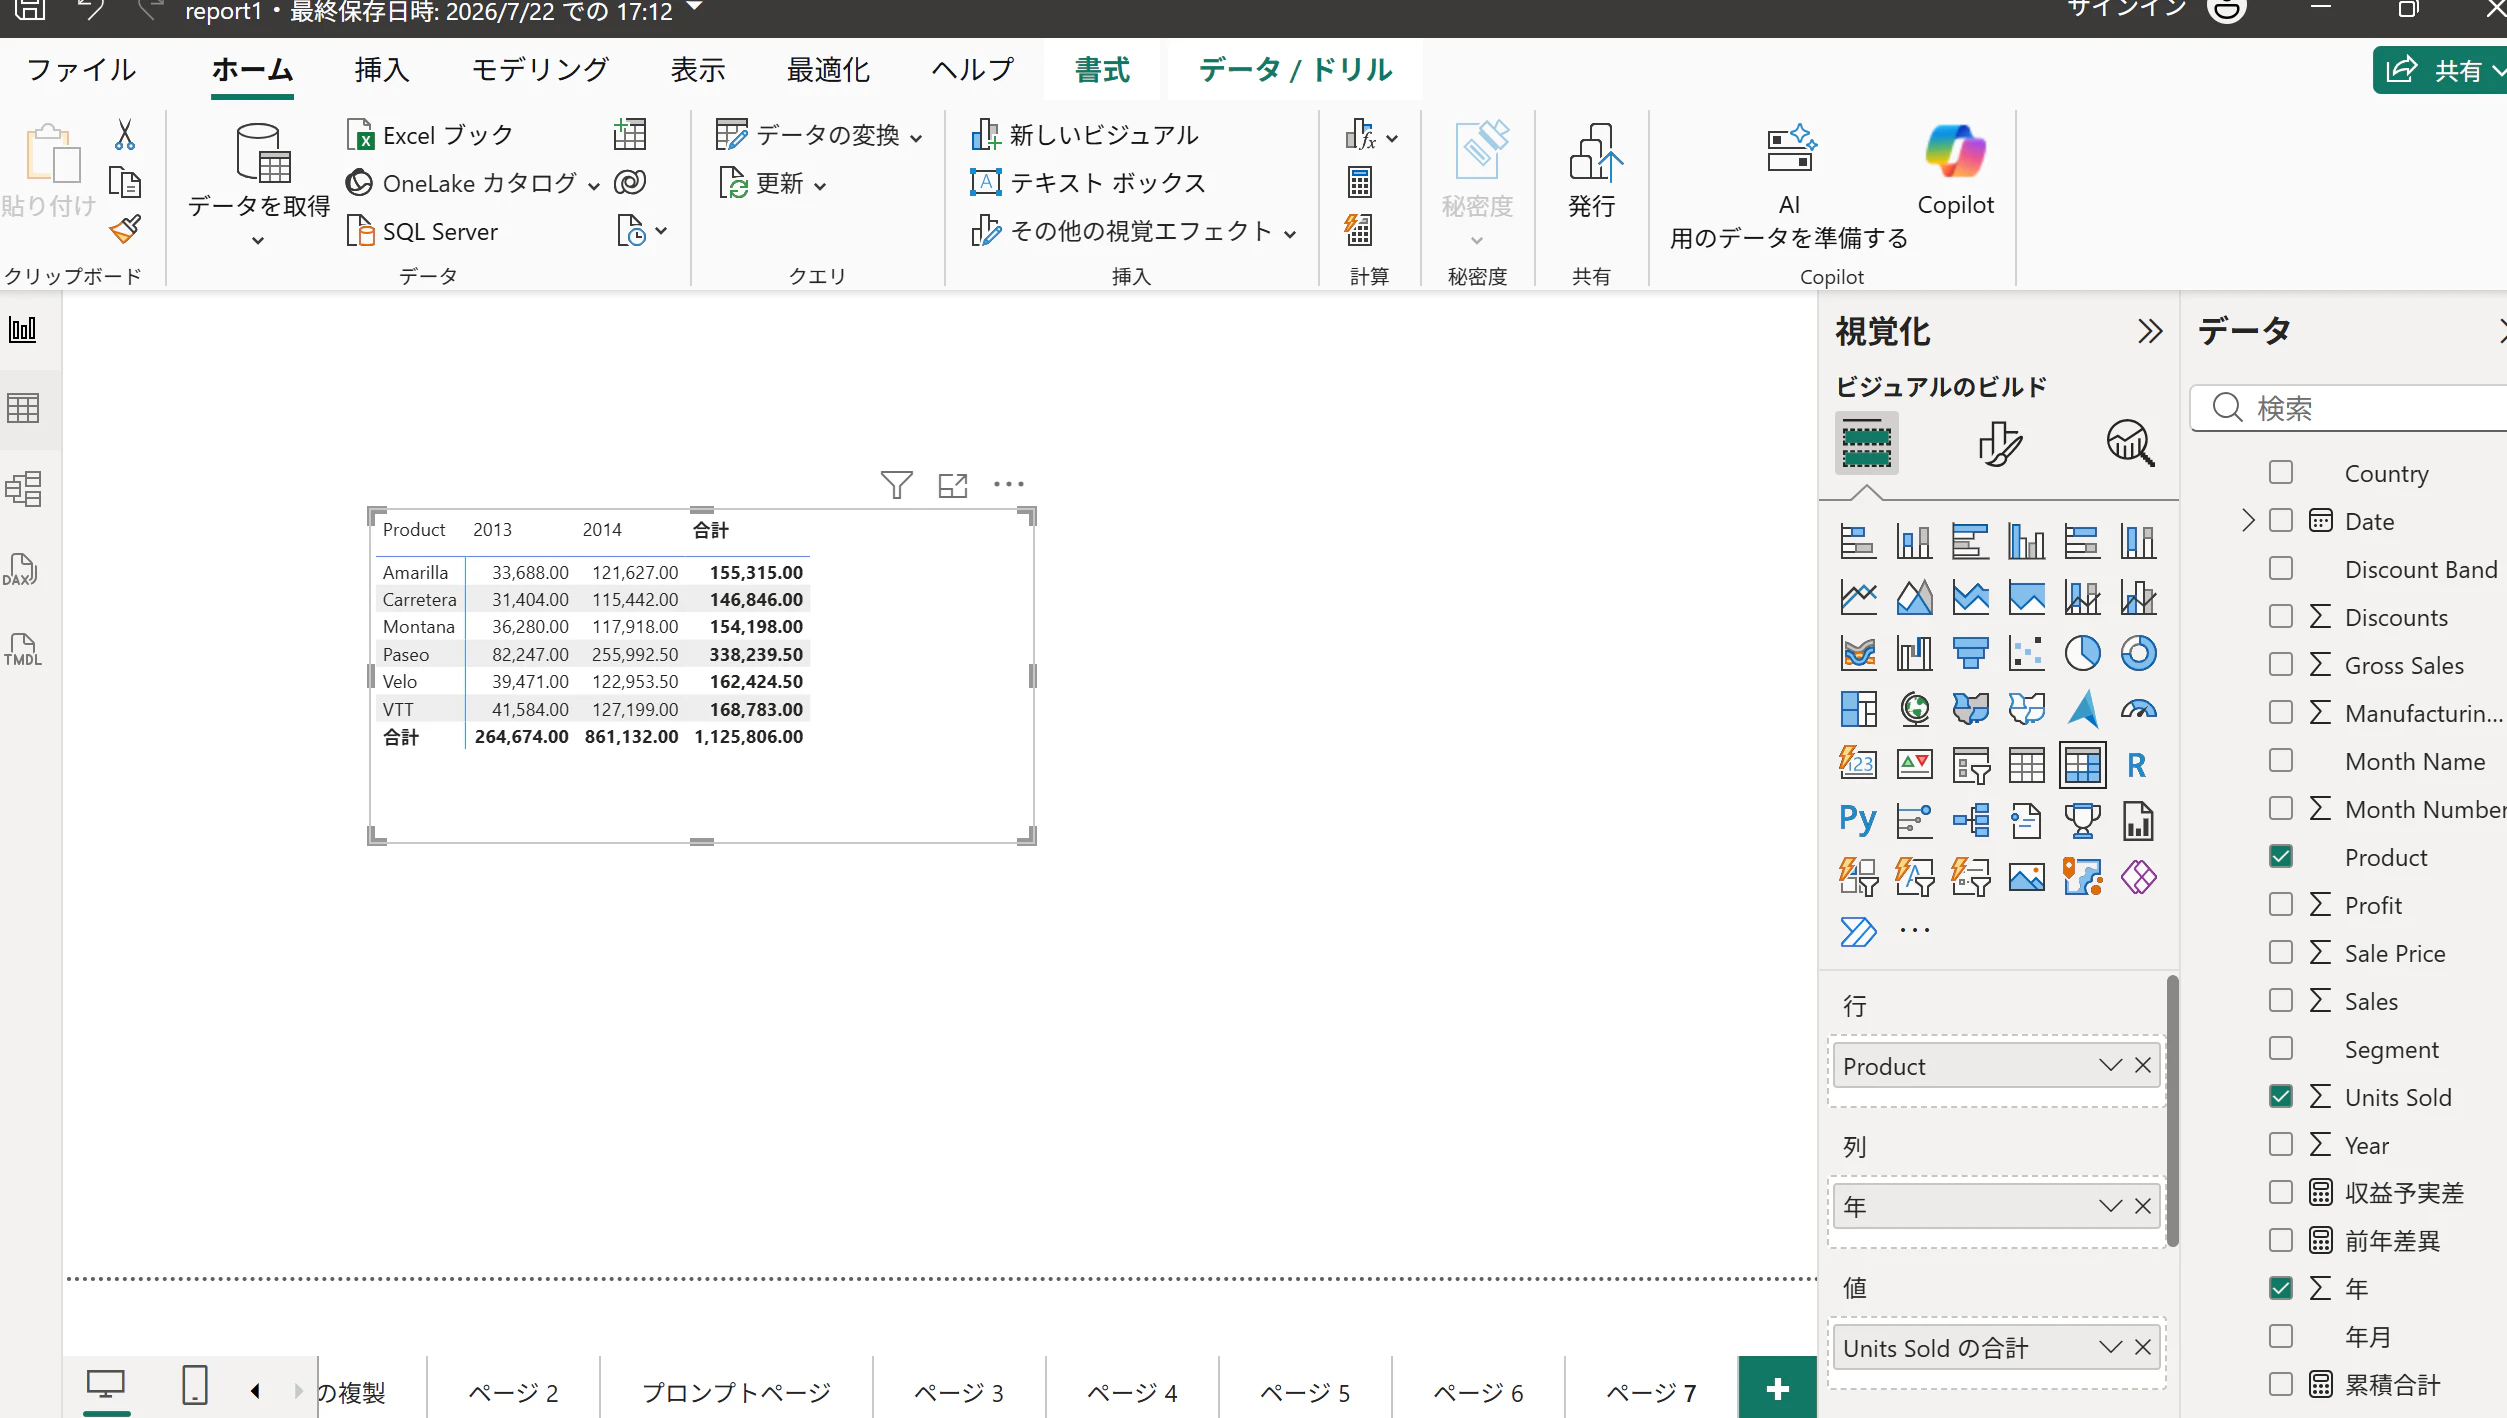
画面右側にある「視覚化」ペインから「マトリックス」をクリックして、キャンバス上に視覚化オブジェクトを配置します。
画面右側の「データ」ペインを展開し、以下の項目を「視覚化」ペインの各領域にドラッグ&ドロップします。
行: financials > Product
列: financials > 年
値: financials > Units Sold
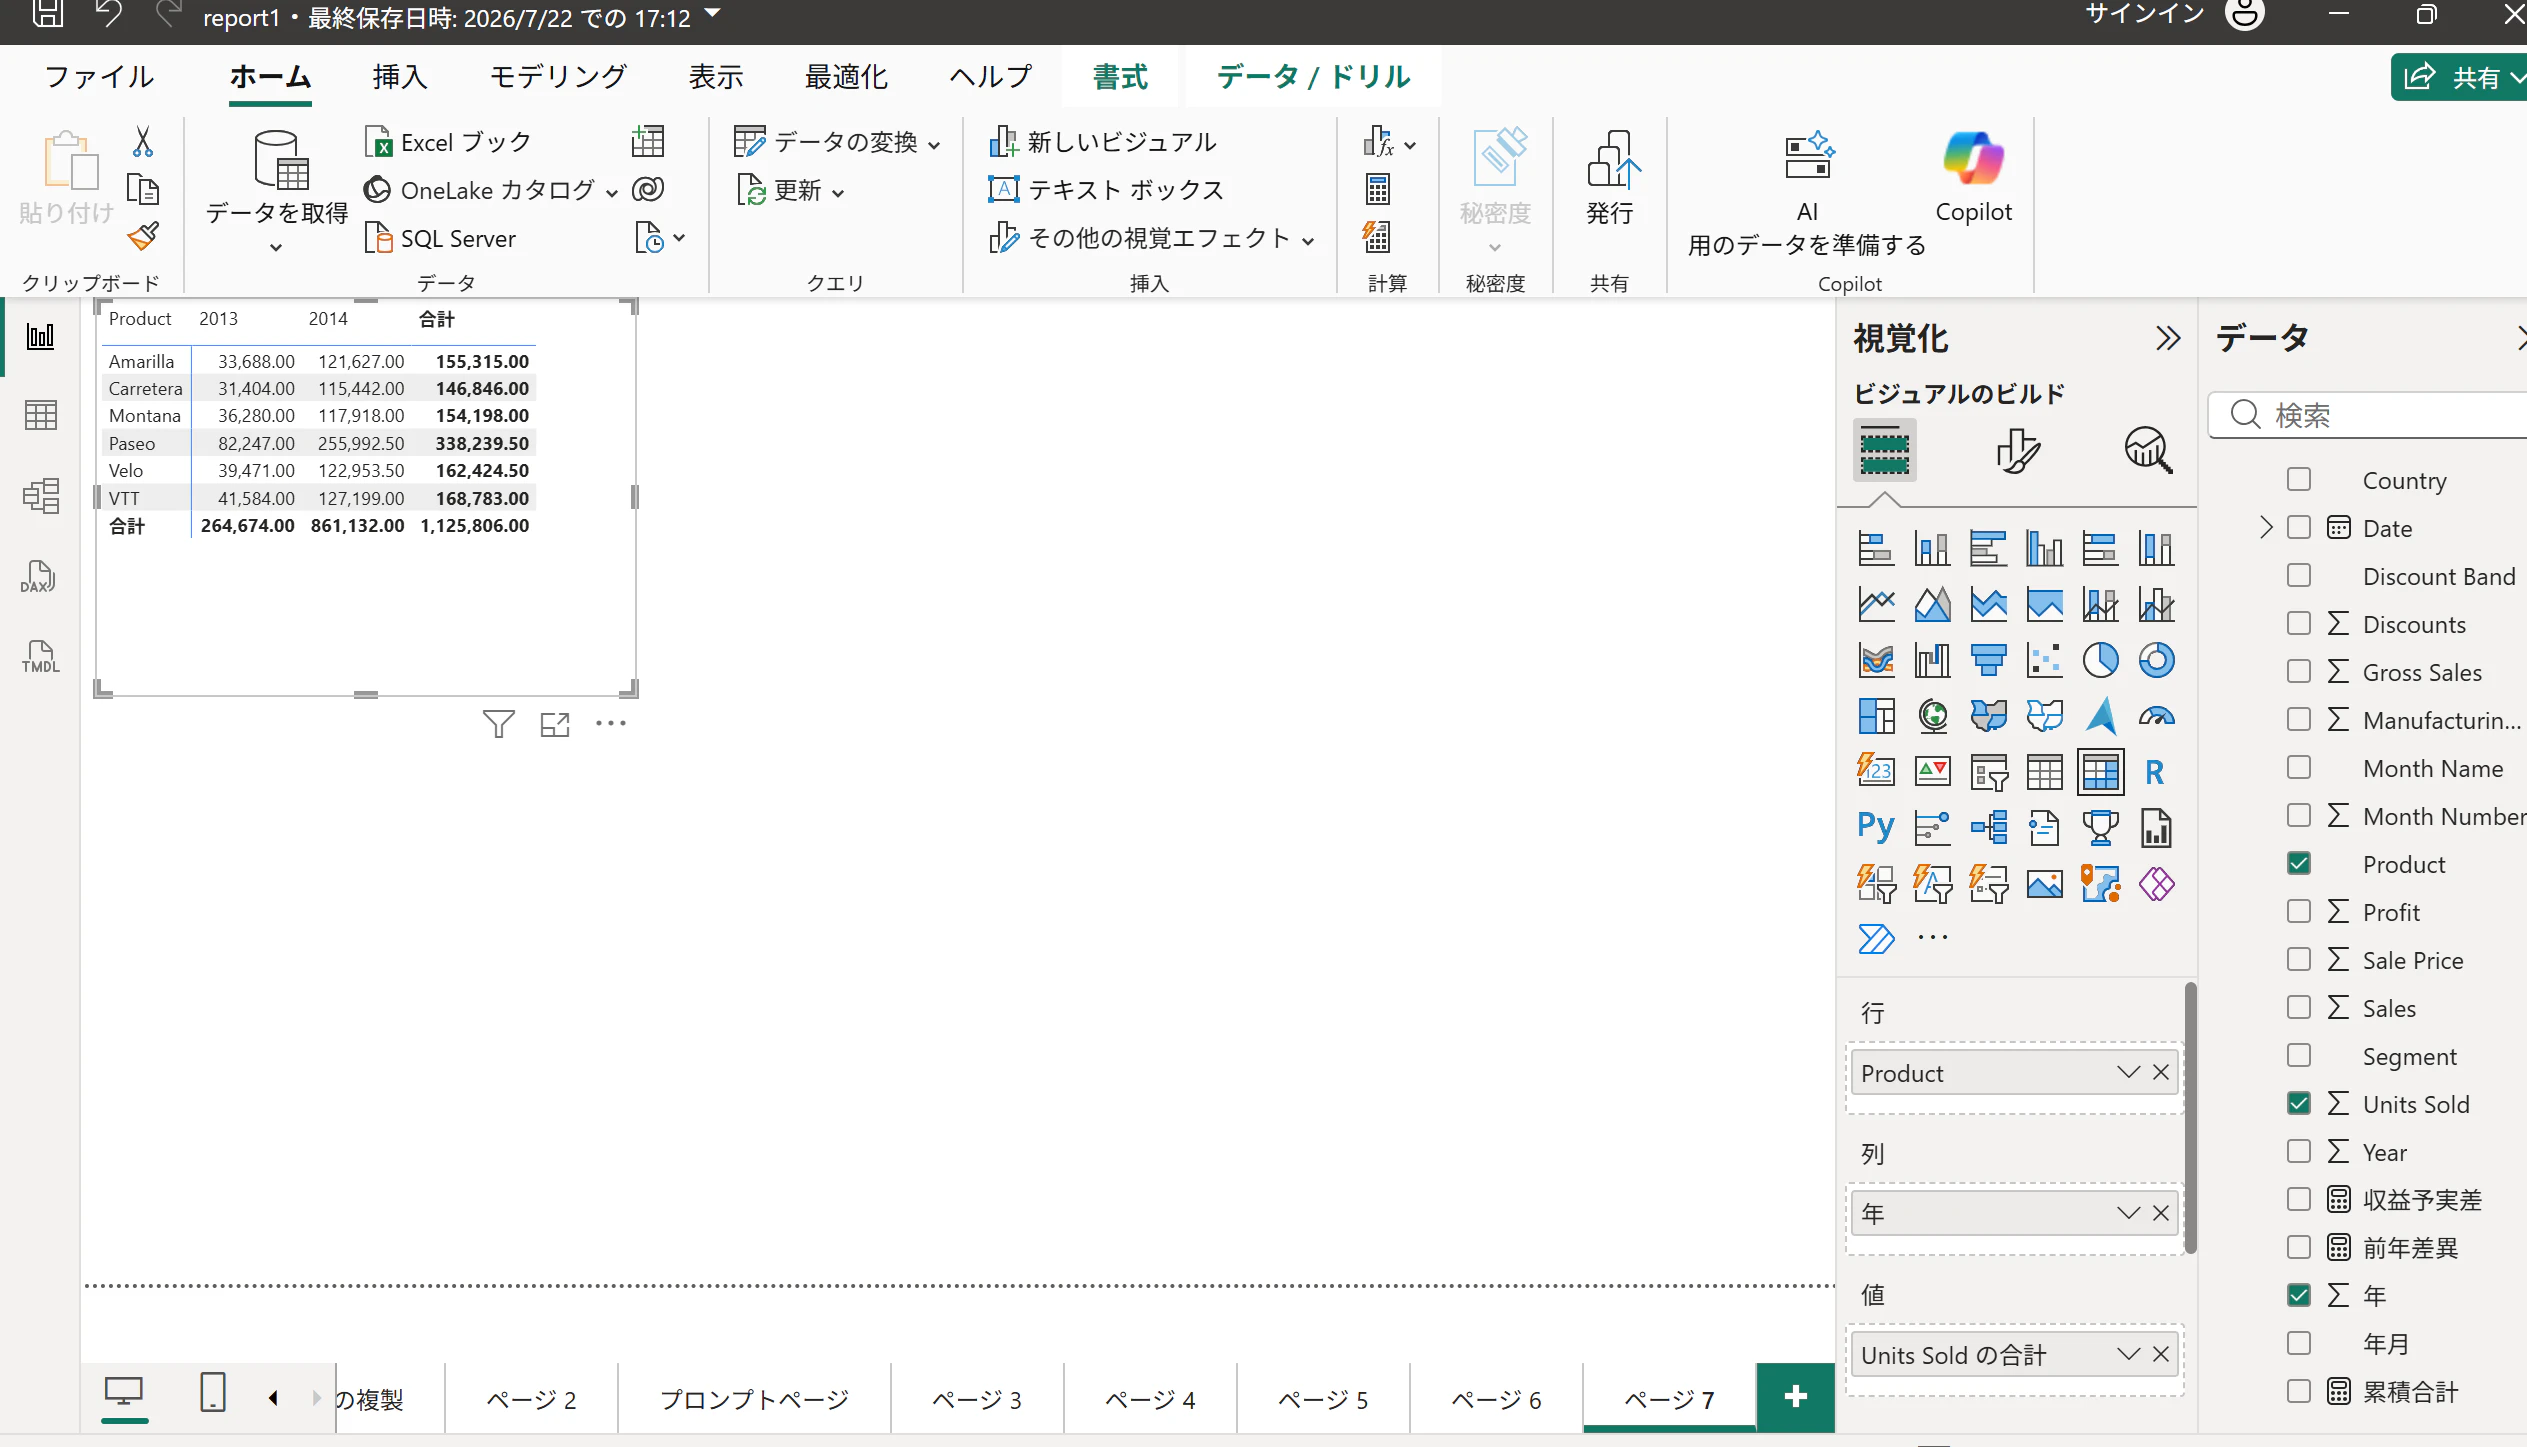
マトリックスをドラッグしたり縁をドラッグすることで、表の移動やサイズ変更などが可能です。
2.集合縦棒グラフの配置と設定
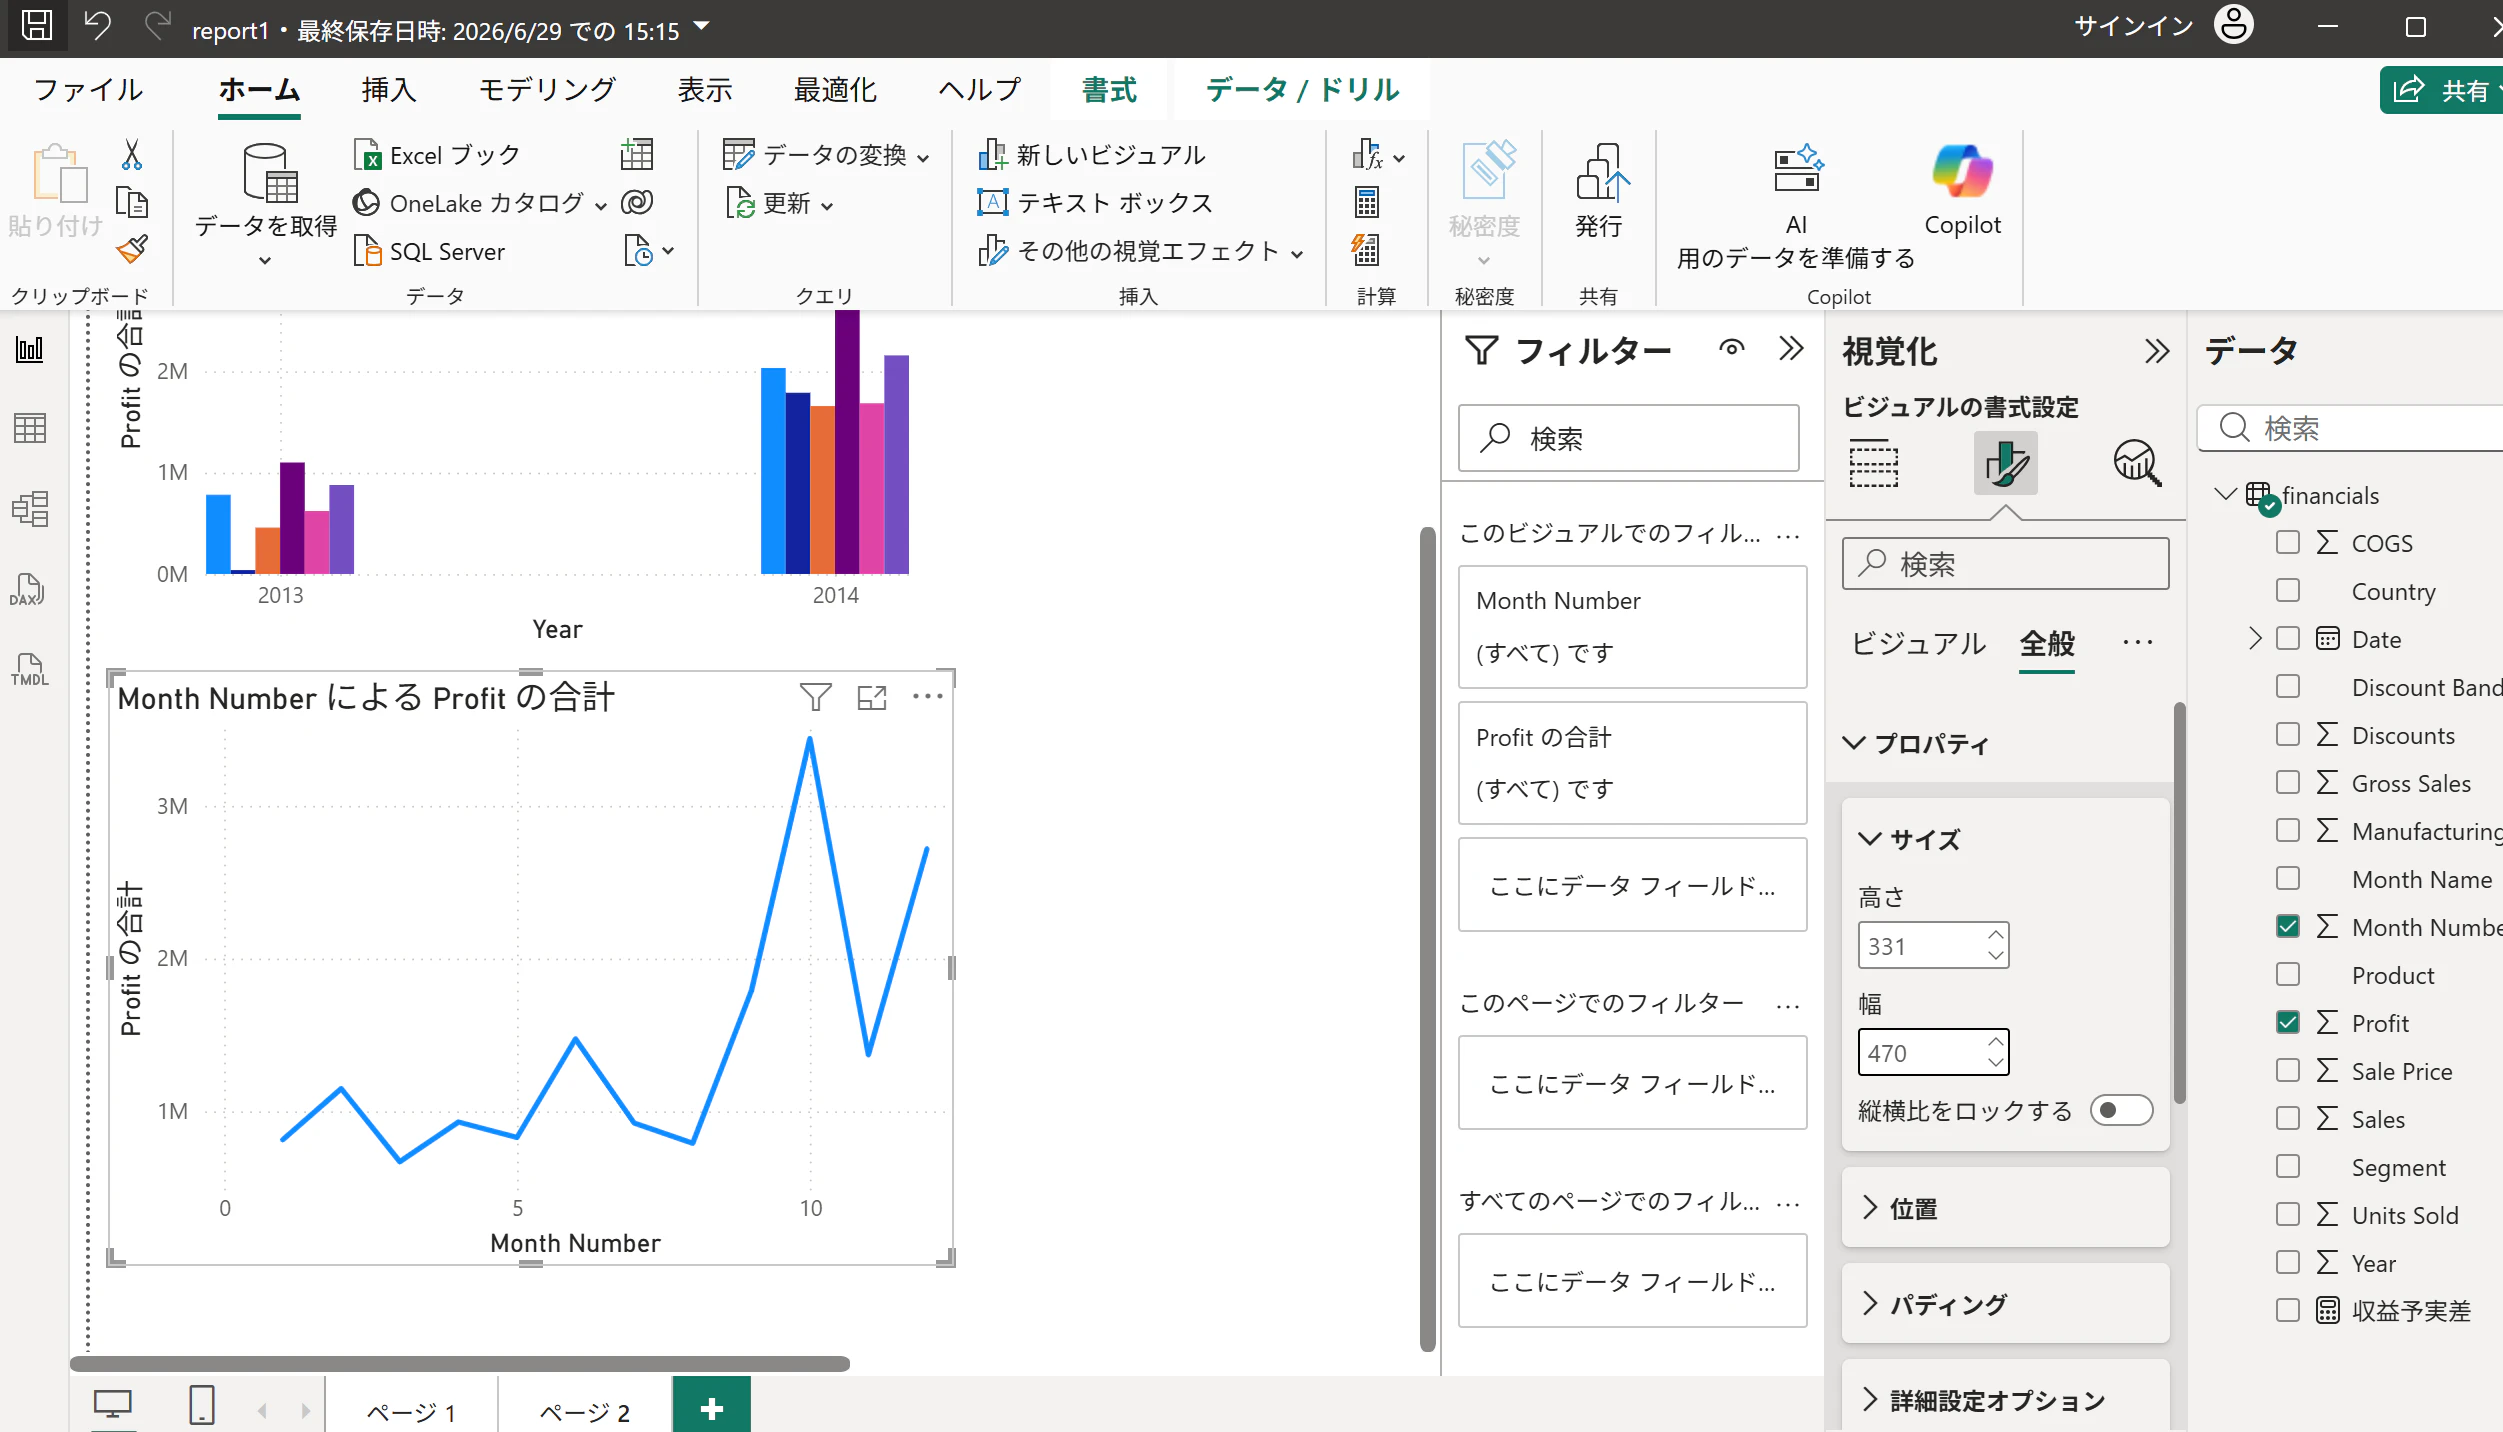
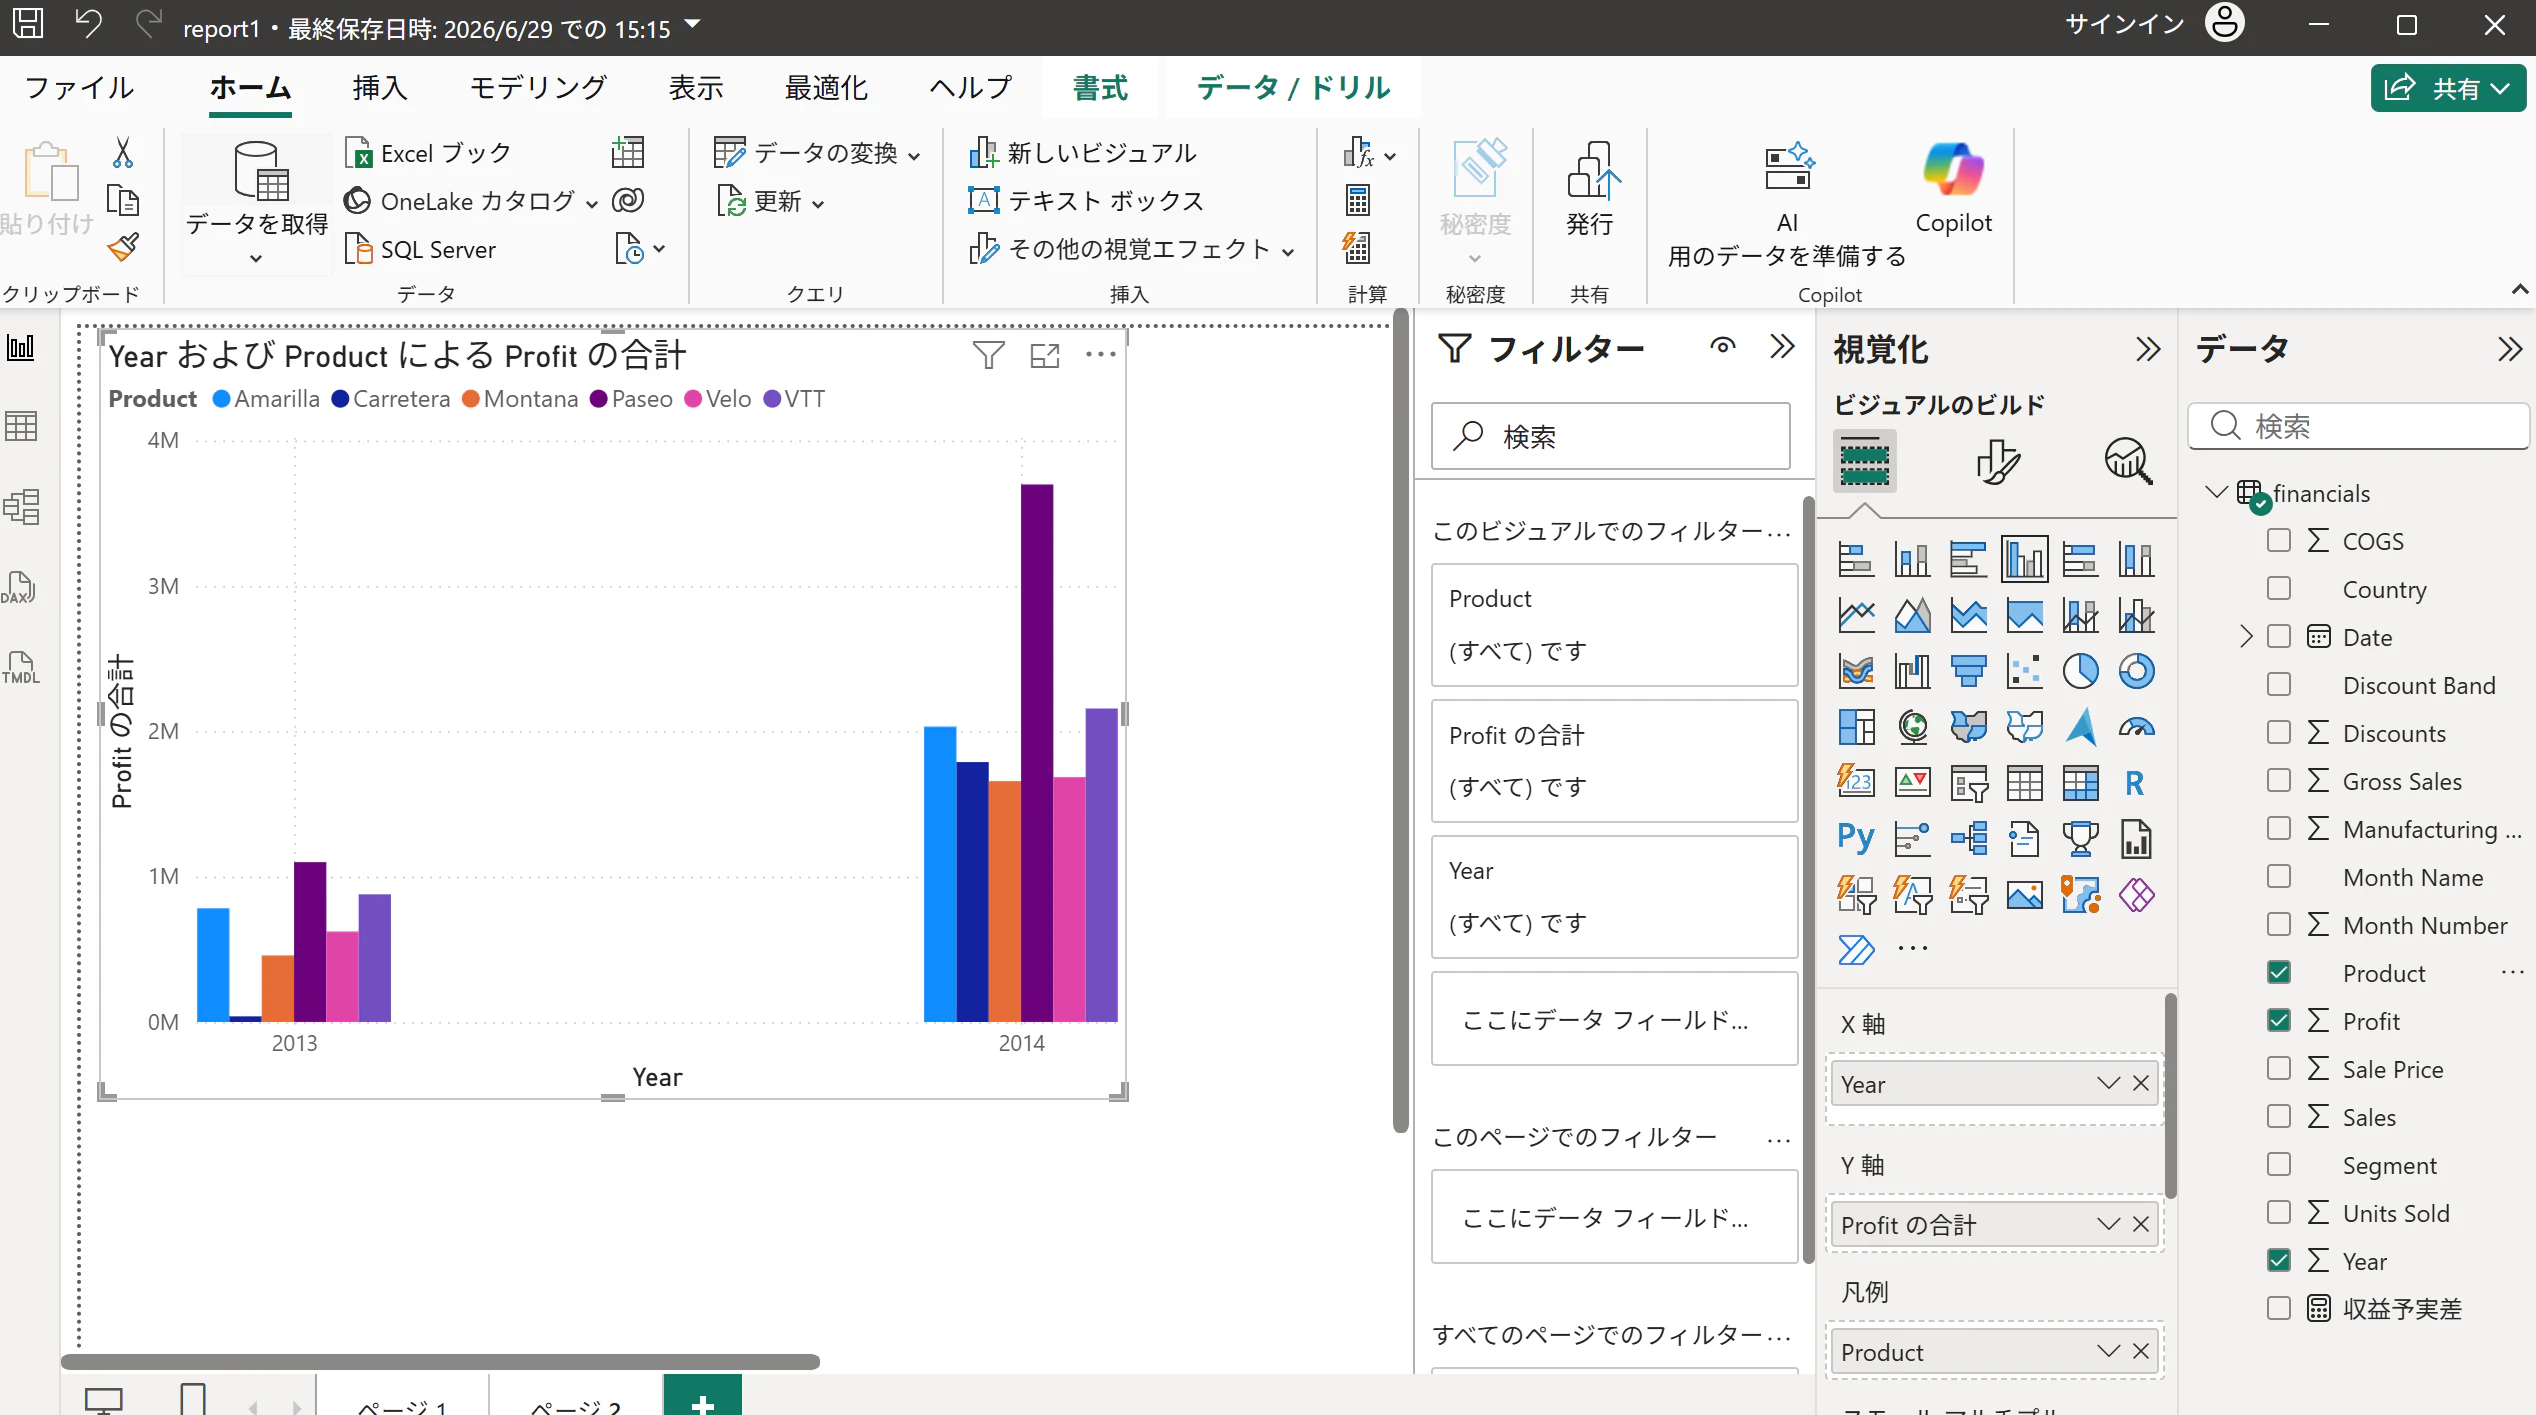
右側の「視覚化」ペインから「集合縦棒グラフ」のアイコンをクリックします。キャンバス上に新しいビジュアルが追加されます。
「データ」ペインから、該当のフィールドをビジュアルの各領域(フィールド枠)へドラッグ&ドロップします。
X軸:Year
Y軸:Profit
凡例(Cognosのデータ系列):Product
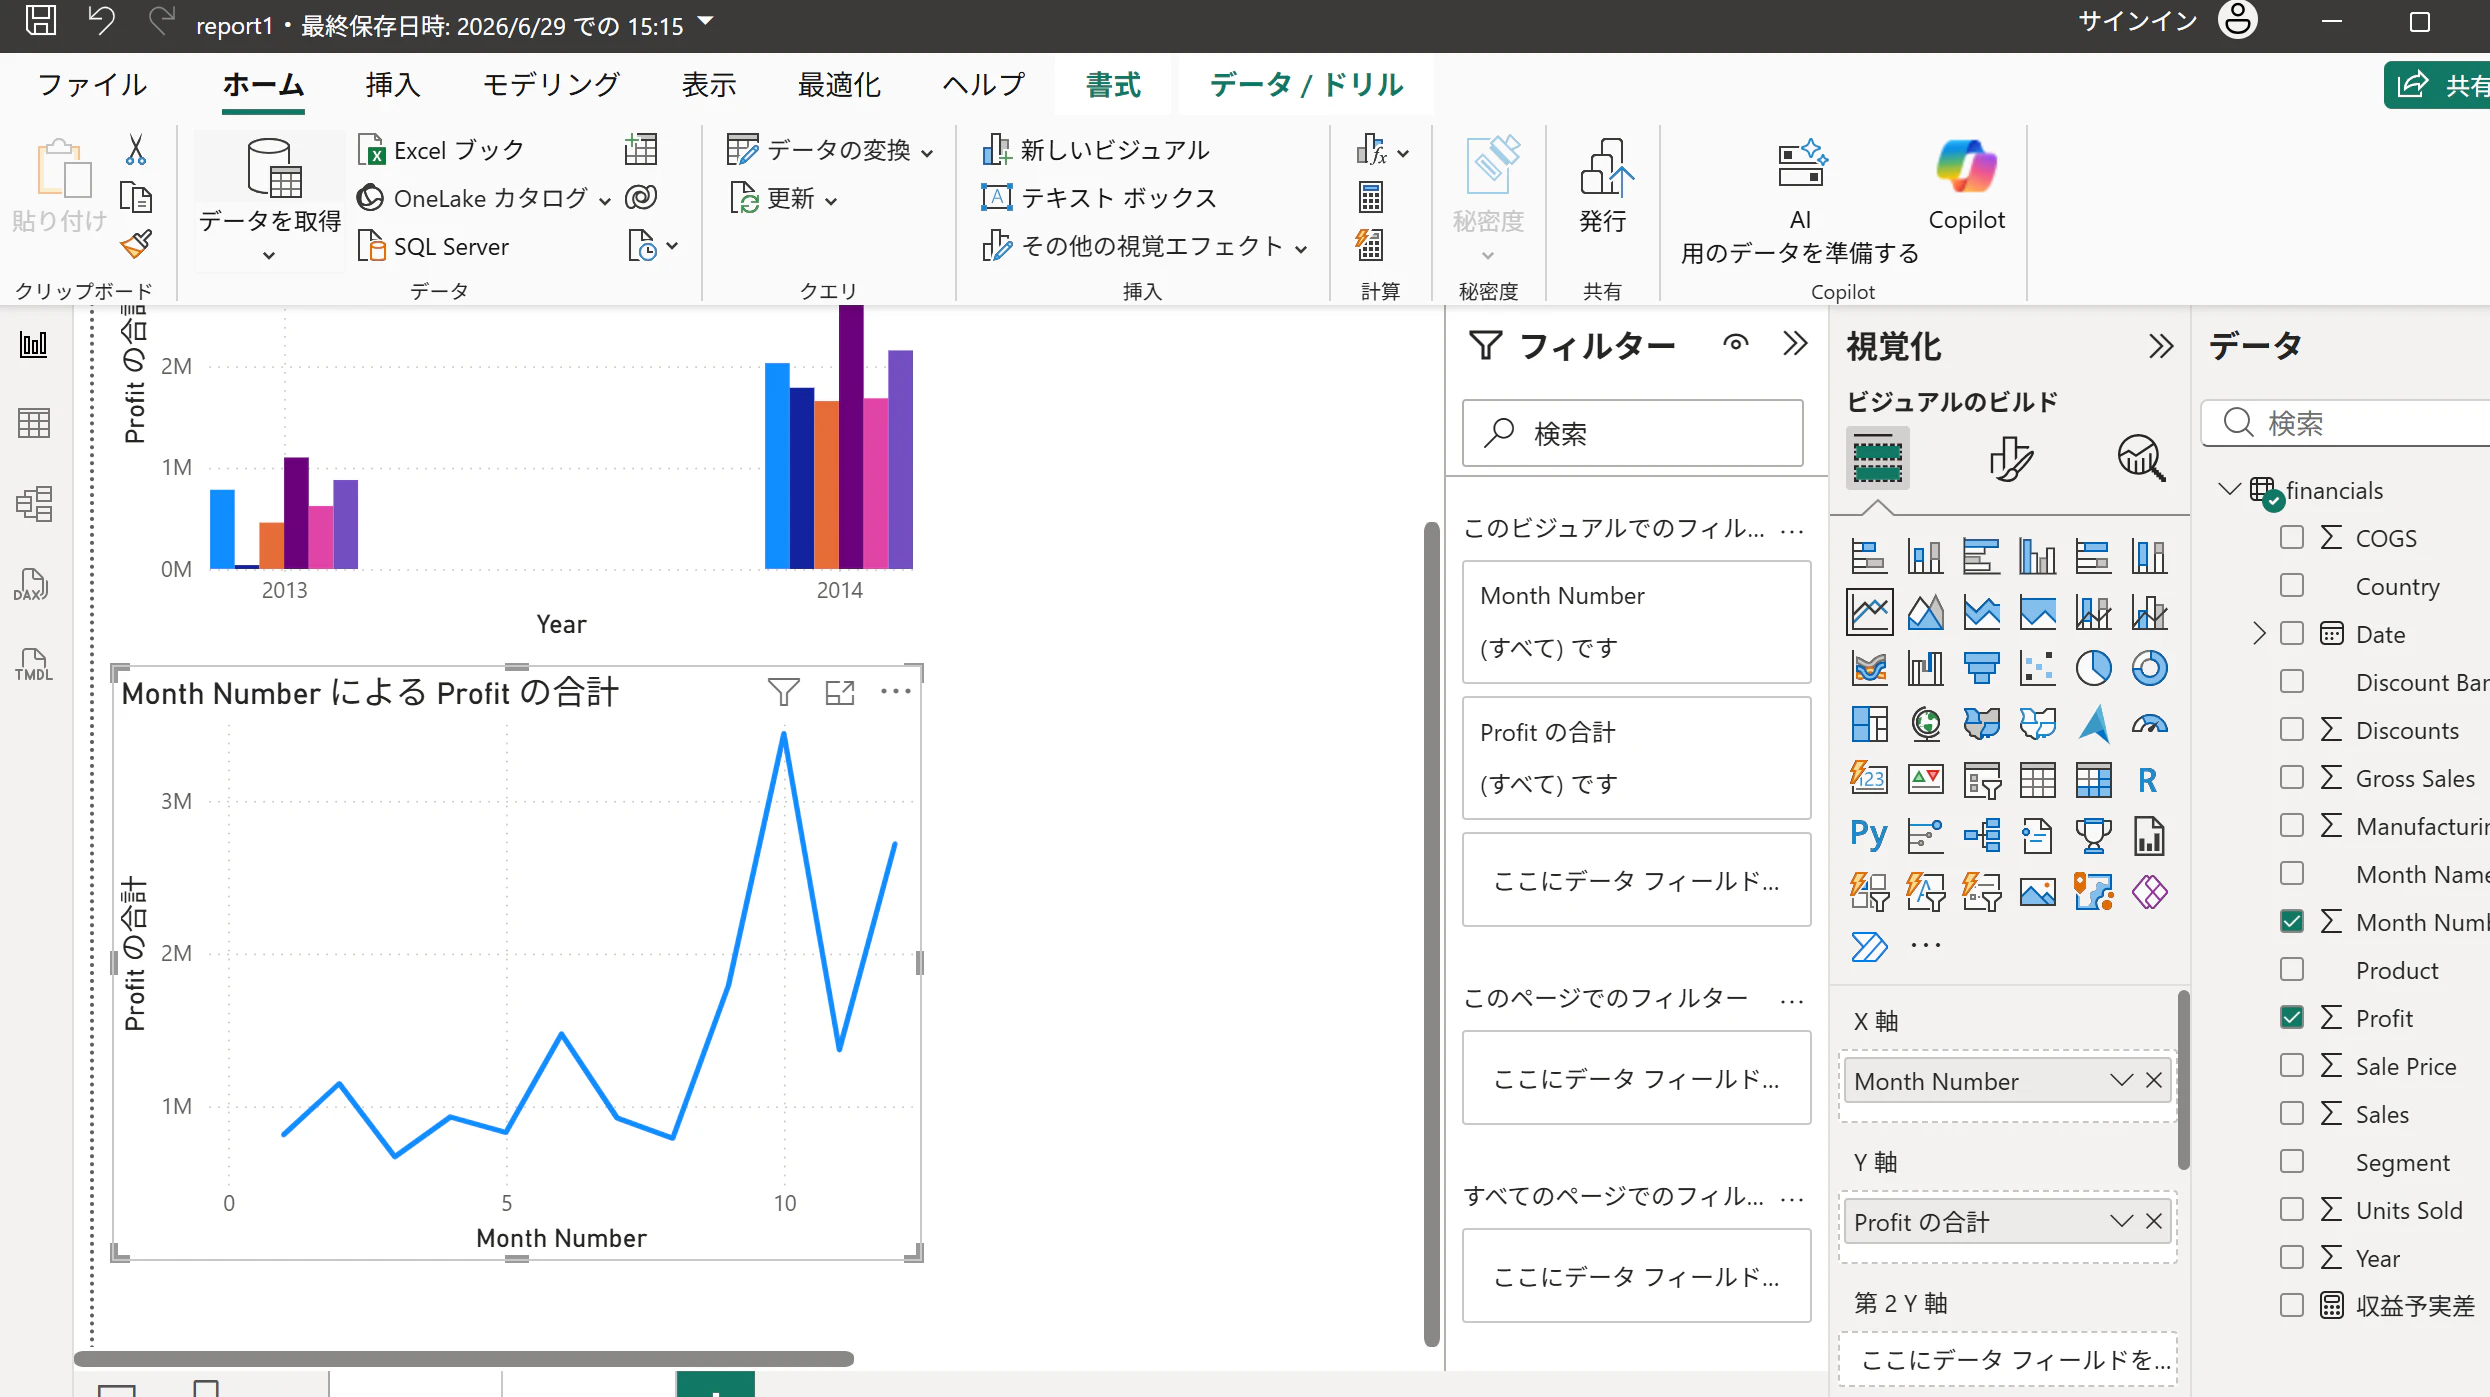
折れ線グラフの配置と設定
視覚化ペインから「折れ線グラフ」のアイコンをクリックします。
フィールドを設定します。
X軸:Month Number
Y軸:Profit
サイズ変更したいビジュアルを選択します。
視覚化ペインの「ビジュアルの書式設定」(ペンとグラフのアイコン)を選択します。
「全般」>「プロパティ」>「サイズ」を開き、サイズを任意の値に変更します。