はじめに
Chart.jsはjavascriptで簡単に綺麗なグラフを描くことができるチャートライブラリです。
そのChart.jsをVue.jsから利用できるようにしたvue-chart.jsというライブラリがあり、今回はそちらを利用してNuxt + vue-chart.jsにてチャートの作成を行ってみました!
vue-chart.jsをインストール
公式ドキュメントを参考にNuxtプロジェクトにvue-chart.jsをインストールします。
npm install vue-chartjs chart.js --save
chartの実装方法
インストールが完了したら早速vue-chart.jsを利用してチャートの作成に取り掛かります。
公式ドキュメントによると以下の実装でチャートを作成できます。
import { Bar } from 'vue-chartjs'

export default {
  extends: Bar,
  mounted () {
    this.renderChart(data, options)
  }
}
基本的にはvue-chartjsから利用したいChartをインポートし、extendした上でmountedのタイミングでパラメータ(データセット、オプション)渡しChartを描画します。
各pageファイルで上記実装を行ってあげればChartを描画できますが、棒グラフや線グラフ、円グラフなど各Chart毎Componentに切って実装してあげた方が良さそうです。
そこでPluginを実装し、利用したいChartをGlobalなコンポーネントとして登録することにしました。
Pluginを実装
Pluginの実装にあたり、pluginsディレクトリ配下にvue-chartjs.jsファイルを作成します。
その中にプロジェクト内で利用するchartコンポーネントを作成し、Vue.componentメソッドにてGlobalなコンポーネントとして登録をします。
今回はサンプルとしてDoughnut Chartのコンポーネント(doughnut-chart)を作成しました。
import Vue from 'vue';
import { Doughnut, mixins } from 'vue-chartjs';
const { reactiveProp } = mixins;

Vue.component('doughnut-chart', {
  extends: Doughnut,
  mixins: [reactiveProp],
  props: {
    options: {
      type: Object,
      default: () => {},
    },
  },
  mounted() {
    this.renderChart(this.chartData, this.options);
  },
});
ここで注意点ですが、Chart.js自身ではデータセット(this.chartDataの値)が変更された際、ライプアップデートの機能を提供していません。
ライブアップデートを実現するためには、vue-chart.jsが提供しているmixinを利用します。
https://vue-chartjs.org/guide/#updating-charts
doughnut-chartコンポーネントではreactivePropを利用し、propsとして渡されたデータセットが変更された際にチャートもライブアップデートされるように実装しました。
Pluginの実装が完了したらnuxt.config.jsのpluginsに追記をします。
module.exports = {
  // ・・・省略
  plugins: [
    {
      src: '@/plugins/vue-chartjs',
      ssr: false,
    },
  ],
  // ・・・省略
};
chartを実装する
Pluginを作成し、Globalなコンポーネントとしてdoughnut-chartコンポーネントを登録したら、あとは各Pageからそのコンポーネントを呼び出しチャートを描画するだけです。
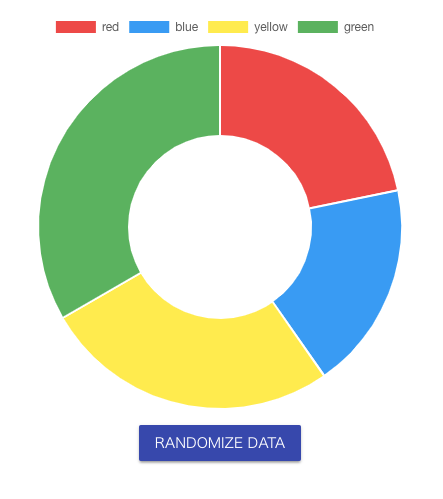
今回は、チャートの描画に加えランダムにデータを更新するボタンの実装も行いました。
※以下のサンプルはコンポーネントフレームワークにVuetifyを利用しています。
<template>
  <v-container fluid>
    <doughnut-chart :chart-data="chartData" :options="chartOptions"/>

    <div class="text-xs-center mt-2">
      <v-btn dark color="indigo" @click="randomizeData()">Randomize data</v-btn>
    </div>
  </v-container>
</template>

<script>
import colors from 'vuetify/es5/util/colors';

export default {
  data() {
    return {
      chartDataValues: [],
      chartColors: [
        colors.red.lighten1,
        colors.blue.lighten1,
        colors.yellow.lighten1,
        colors.green.lighten1,
      ],
      chartLabels: ['red', 'blue', 'yellow', 'green'],
      chartOptions: {
        maintainAspectRatio: false,
        animation: {
          duration: 1500,
          easing: 'easeInOutCubic',
        },
      },
    };
  },
  computed: {
    chartData() {
      return {
        datasets: [
          {
            data: this.chartDataValues,
            backgroundColor: this.chartColors,
          },
        ],
        labels: this.chartLabels,
      };
    },
  },
  mounted: function() {
    this.randomizeData();
  },
  methods: {
    randomizeData: function() {
      var data = [];
      for (var i = 0; i < this.chartLabels.length; i++) {
        data.push(Math.floor(Math.random() * 100));
      }
      this.chartDataValues = data;
    },
  },
};
</script>
実行結果は以下のようになり、ボタン押下でチャートが更新されることも確認できました。
