はじめに
この記事は、アイカツ! Advent Calendar 2018の21日目の記事です。内容としては、現在大好評稼働中のアーケードゲーム、データカードダス アイカツフレンズ!のマイページから情報を取得するツール……は頓挫したので、今回は公開されている各弾のランキングからアピールポイント(ハイスコア)を可視化してみる記事でお茶を濁します。
前日の記事はiyanayatudazeさんによるアイカツフレンズ!& テヅカツ! コレクション 2018 レポ - ねむいでした。
ちなみに、これまでアイカツ! Advent Calendar 2018では以下のような技術系記事が投稿されています。
-
アイカツ!画像でLGTMできるChrome拡張機能をストアに公開しました - matのブログ
- 2日目
-
Aikatsu Music Medoly - アトリエあざらし
- 5日目
-
アイカツ!のマイページから情報を取得するやつを作る その1 - Qiita
- 7日目
-
アイカツ!のマイページから情報を取得するやつを作る 番外編その1 - 各環境で実行可能なバイナリをgoreleaserでビルドしてGitHub Releasesでリリースする
- 11日目
-
冴草きいちゃんがアイカツ!画像を探してくれるdiscord botを作った話 - nyakuroのブログ
- 12日目
-
アイカツ!のマイページから情報を取得するやつを作る その2 - Qiita
- 14日目
2018/12/23 22:45更新
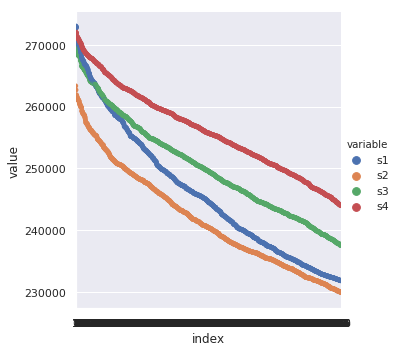
各弾と言いながら4弾のものしか取得していなかったので、現在ハイスコアが確定した1弾〜4弾全部のデータを取得して描画するように書き換え。また、ランキングを100位までではなく1000位まで描画するように変更。
概要
Jupyterlabでいつものスクレイピングしてseabornで突っ込んだら出ました。Jupyterlab便利です。Jupyter Notebookの正当進化。
インポートとかする部分
from bs4 import BeautifulSoup
import requests

import numpy as np
import pandas as pd
import matplotlib.pyplot as plt
import seaborn as sns
sns.set(style="darkgrid")

# 指定したURLからアピールポイント出すやつ(101位以降については未検証、ページの形が違うから微妙)
def get_appealpoint(url):
    resp = requests.get(url)
    soup = BeautifulSoup(resp.text, 'lxml')
    return list(map(lambda x: int(x.text), soup.select('dd.appeal-point')))
実際にデータを取得する部分
このURLのパラメータのうち、unit=0 or 1がソロorフレンズ、seriesが弾数(1400が3弾、1500が4弾)を表していて、p(page)が1位-100位ではp1_{1..10}という感じで10位ずつ、それ以降はp2みたいな感じで100位ずつ表されている。
def get_seriespoints(seriesID):
    pages = ["1_{}".format(i) for i in range(1, 11)] + list(map(str, (range(2, 11))))
    urls = [
        'https://www.aikatsu.com/friends/ranking/series_high_score_ranking.php?r_type=series_score&unit=0&series={}&area=0&p={}'
        .format(seriesID, p) for p in pages
    ]

    appeal_points = []
    for url in urls:
        appeal_points = appeal_points + get_appealpoint(url)
    return appeal_points

season1_ap = get_seriespoints('1200')
season2_ap = get_seriespoints('1300')
season3_ap = get_seriespoints('1400')
season4_ap = get_seriespoints('1500')
データをpandasのDataFrameに突っ込んでプロットする様子。
data = pd.DataFrame({
    's1': season1_ap,
    's2': season2_ap,
    's3': season3_ap,
    's4': season4_ap,
}).reset_index()
plt_data = data.melt('index')
sns.catplot(x='index', y='value', hue='variable', data=plt_data)
結果
概ね線形ですが、トップ5名付近が飛び抜けているように見えます。また、弾が進むにつれてハイスコアも上昇していますが、2弾だけ下がっているのと、トップランカー周辺は各弾同じ27万点台に集まっているようです。
おわりに
突如aikatsu-dcd-parserの開発が中断となってしまった上に期限に間に合わせるには徹夜しかないので突貫で1時間でコード書いて記事書いたけどやはりJupyterLabは便利です。初めて使ったけど。
明日の執筆者は未定です。
ところで、なぜ中断?
以下のような事情があります。
- ログイン周りを実装する必要があり、流石に不正アクセス禁止法に踏み込みそうだと感じた
- 法的にグレーでも、異常なログイン処理を行った結果BANされても困る(自分がされても、使ってくれた方がされても)
- 上記2点を一旦無視してちょっとやろうとしてみたもののなかなか上手く行かず、期限に間に合いそうになかった
-
mnw.value指定してみたけどだめだった
-
という感じなので、もし気が向いたらまた続きを作るかもしれません。
