Androidでグラフを描写したい。
Webだと、色々なライブラリの情報があるけど、Androidネイティブだと経験もなく、あまり知りません。Androidでは「MPAndroidChart」が標準のようですね。
利用準備
1.GradleScriptに追記
2.SyncGradle
3.View(XML)ファイル追加
4.クラスの修正
1.GradleScriptに追記
build.gradle
(Module:app)
・・・
・・
//ファイル末尾にに以下を追加
repositories {
    maven { url "https://jitpack.io" }
}
dependencies {
    compile 'com.github.PhilJay:MPAndroidChart:v2.1.0'
}
2.SyncGradle
IDEの上部にある、Syncを押下する。
↓一番左のボタン押下して、5分待ちます。
3.View(XML)ファイル追加
ファイル名はなんでも良いので、作る
chart.xml
<?xml version="1.0" encoding="utf-8"?>
<LinearLayout xmlns:android="http://schemas.android.com/apk/res/android"
    android:orientation="vertical"
    android:layout_width="match_parent"
    android:layout_height="match_parent">

    <com.github.mikephil.charting.charts.BarChart
        android:id="@+id/bar"
        android:layout_width="match_parent"
        android:layout_height="match_parent"
        />
</LinearLayout>
4.クラスの修正
クラスにて、グラフで表現したいデータを投入する
MainActivity.java
BarChart CObj;
@Override
protected void onCreate(Bundle savedInstanceState) {
  super.onCreate(savedInstanceState);
  setContentView(R.layout.chart);
  CObj = (BarChart) findViewById(R.id.bar);
  CObj.getAxisLeft().setAxisMaxValue(10000f);
  CObj.getAxisLeft().setAxisMinValue(1000f);
  CObj.getAxisLeft().setStartAtZero(false);
  entry();
}

private void entry() {
  List<BarEntry> entry = new ArrayList<>();
  List<String> value = new ArrayList<>();
  value.add("" + (1 + 1));
  value.add("" + (2 + 1));
  value.add("" + (3 + 1));
  value.add("" + (4 + 1));
  value.add("" + (5 + 1));
  value.add("" + (6 + 1));
  value.add("" + (7 + 1));
  value.add("" + (8 + 1));
  value.add("" + (9 + 1));
  value.add("" + (10 + 1));

  entry.add(new BarEntry(1000f, 1));
  entry.add(new BarEntry(2000f, 2));
  entry.add(new BarEntry(3000f, 3));
  entry.add(new BarEntry(4000f, 4));
  entry.add(new BarEntry(5000f, 5));
  entry.add(new BarEntry(6000f, 6));
  entry.add(new BarEntry(7000f, 7));
  entry.add(new BarEntry(8000f, 8));
  entry.add(new BarEntry(9000f, 9));
  entry.add(new BarEntry(10000f, 10));

  BarDataSet data = new BarDataSet(entry, "データ表示");
  data.setColor(Color.BLUE);
  List<BarDataSet> dataset = new ArrayList<>();
  dataset.add(data);
  BarData data = new BarData(value, dataset);
  CObj.setData(data);
  CObj.invalidate();
}
実機で確認した結果
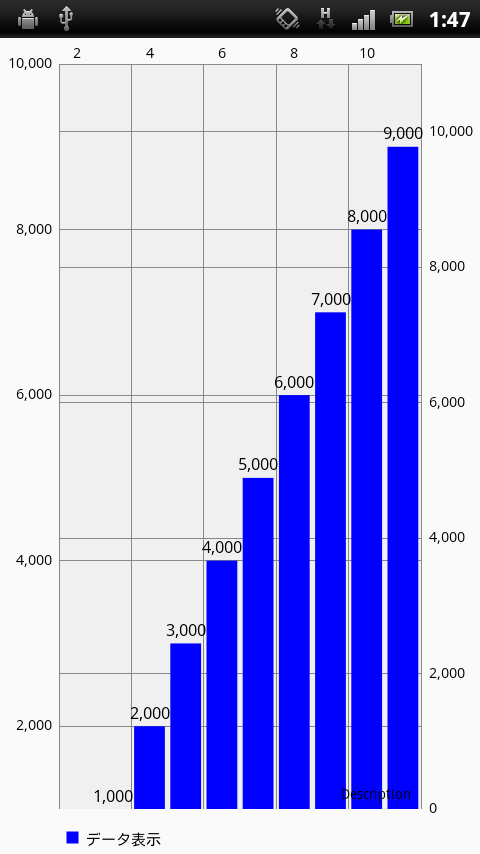
縦軸、横軸の表示・感覚も細く設定できるようです。Gradleまわりも含めて、きちんと勉強しよう。。