設定を忘れるので、メモ。
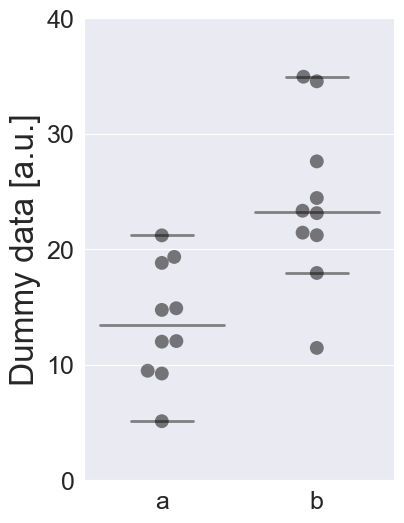
このようなグラフが描けます。boxplotのboxなし・whiskerなしとswarmplotを重ねます。

ダミーデータの生成
自分のデータを持っている人はスキップしてください。
Python
import numpy as np
import pandas as pd
import matplotlib.pyplot as plt
import seaborn as sns

# 2種類のダミーデータを生成
np.random.seed(seed=0)
a = np.random.normal(10, 5, 10) #平均、標準偏差、個数
b = np.random.normal(20, 10, 10)

# seabornでboxplotを描きやすいようにくっつける
df_a = pd.DataFrame([a, ["a"]*len(a)]).T
df_a.columns = ["data", "category"]
df_b = pd.DataFrame([b, ["b"]*len(a)]).T
df_b.columns = ["data", "category"]

df_melt = pd.concat([df_a, df_b], axis=0).reset_index(drop=True)
boxplotのboxなしとswarmplotを重ねる
Python
sns.set_style('darkgrid')

fig, ax =plt.subplots(figsize = [4, 6])

sns.boxplot(x="category", y="data", data=df_melt, showfliers=False, showbox=False, whiskerprops=dict(linewidth=0), linewidth=2, ax=ax)
sns.swarmplot(x="category", y="data", data=df_melt, ax=ax, color="black", size=10, alpha=0.5)

plt.setp(ax.lines, color="gray") #横線の色
ax.set_xlabel("", size = 24)
ax.set_ylabel("Dummy data [a.u.]", size = 24)
ax.set_xticks([0, 1], ["a", "b"], size = 18) #字を大きくするためにset
ax.set_yticks([0, 10, 20, 30, 40], [0, 10, 20, 30, 40], size = 18) #字を大きくするためにset

plt.savefig("dummy.png", dpi=100, bbox_inches="tight")
実際に使う時はdpiは200にしていますが、Qiitaにアップしようとしたら大きすぎたので100に設定。
