やりたいこと
matplotlibで微生物の軌跡を可視化する時に、プロットの色で時刻を示したい。
例えば、赤が0秒、黄色が1秒、緑が2秒、青が3秒、紫が4秒、……みたいに。
問題点
- for文を使って1点ずつ点を打っていけば1点ずつ色を変えることができるが、例えばカラーマップの全体を100フレームに割り振りたい(カラーマップの全体に対応する時間の長さを指定した状態でプロットしたい)場合、そのままではできない。
- plt.colorbarの挙動がよくわからない。
解決策
- 手動で色を指定し、手動でcolorbarを描く。
- 設定によるが、トラッキング結果のフレームは時々飛んでいる(例えば時刻0, 1, 2, 4,... となっている)ので、時刻と色を対応づけるデータフレームを先に作り、そのデータフレームから辞書的に色を引っ張ってくる。
環境
- MacOS Mojave 10.14.6
- Python 3.7.10
- Anaconda
- Jupyter notebook
コード
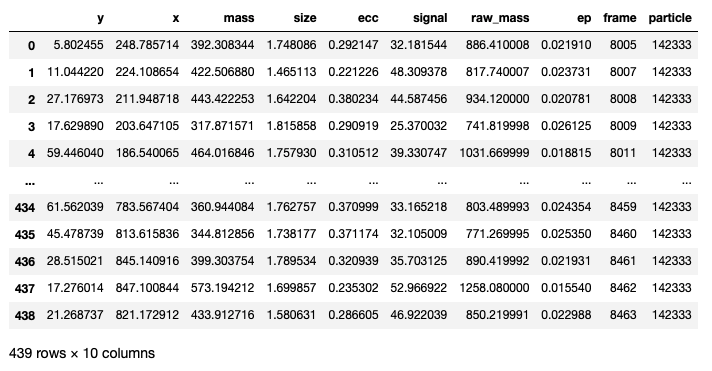
Trackpyでトラッキングした軌跡を描画します。TrackMateなどのトラッキング結果を使う時は列名など適宜改変してください。
準備
Python
import pandas as pd
import numpy as np
import matplotlib.pyplot as plt

# データ読み込み
p = pd.read_csv("trajectory.csv")

# カラーマップ指定
cmap = plt.cm.get_cmap("gist_rainbow")
データの長さ(この場合1軌跡)を確認しておきます。


全部で458フレームです。時々フレームが飛んでいるので、行数(439)とは異なります。
カラーコードの準備
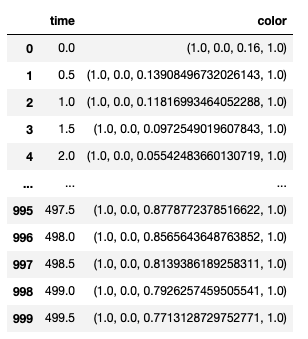
時刻と色を対応させた辞書的なデータフレームを作ります。
Python
color_code = [] #データ格納用の空のリスト
max_frame = 100 #カラーマップに対応させるフレーム数。これを超えると色を最初に戻す

for i in np.arange(0, max_frame, 0.5): #0.5刻みならカラーバーを描く時に十分細かい?
    idx = i/max_frame
    col = cmap(idx)
    color_code.append(col)

#時刻と色を対応させる。max_frameを超えた分は循環させる
#全体で458フレームなので、500フレームまで対応させておく
colors = pd.DataFrame([np.arange(0, 500, 0.5), color_code * 5]).T
colors.columns = ["time", "color"]
プロット
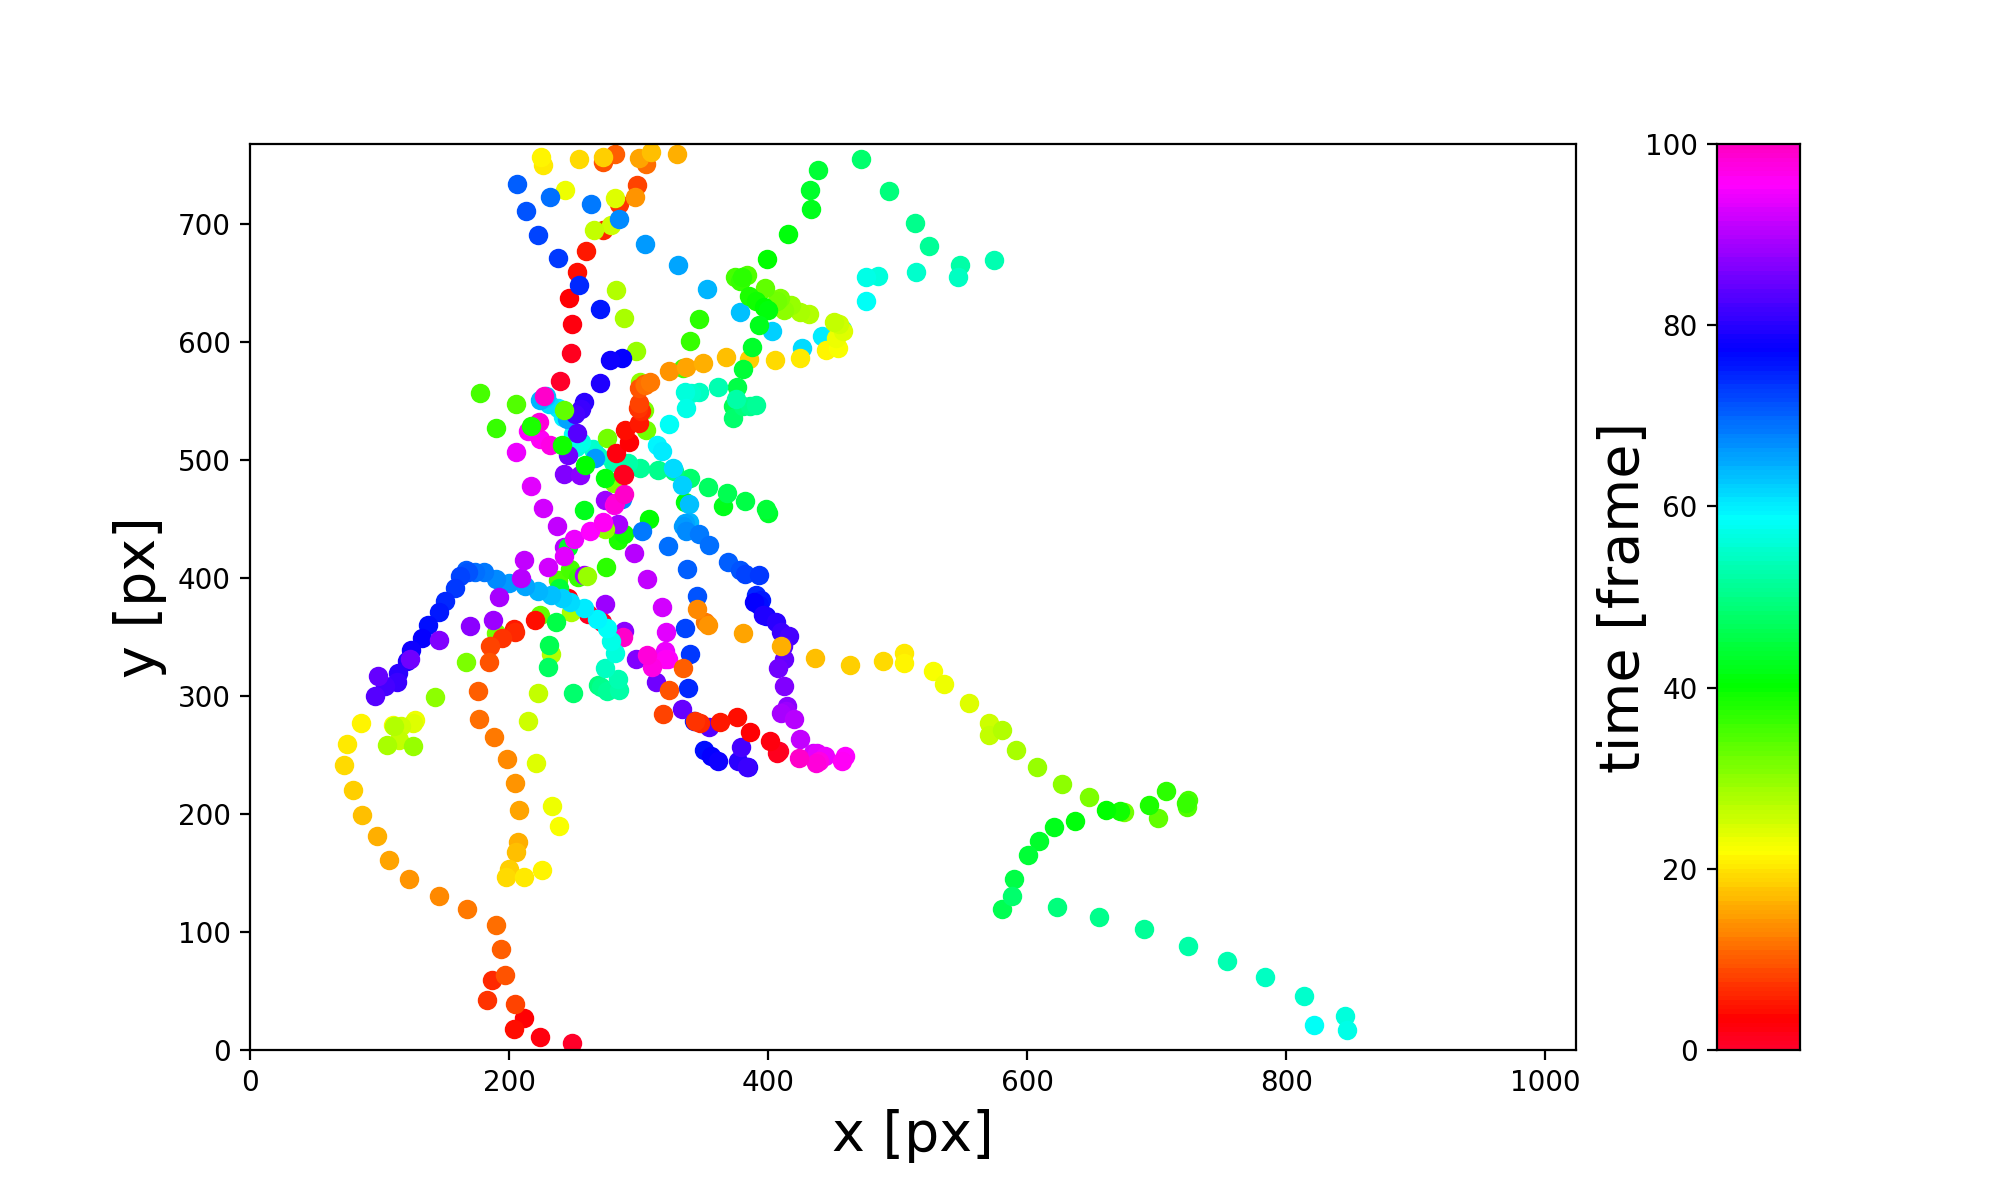
for文で1点ずつ打つので、若干時間がかかります。もっと賢いやり方があったら教えてください。
plt.scatter
Python
fig, axes = plt.subplots(1, 2, figsize=[10, 6], gridspec_kw={'width_ratios': [8, 0.5]})

axes[0].set_xlim([0, 1024])
axes[0].set_ylim([0, 768])
axes[0].set_xlabel("x [px]", fontsize=20)
axes[0].set_ylabel("y [px]", fontsize=20)

for i in range(len(colors)):
    try:
        point = p[p["frame"] == (colors["time"][i] + p["frame"][0])]
        axes[0].scatter(point["x"], point["y"], color=colors["color"][i])

    except IndexError: #一致するものがない
        pass

#カラーバー
max_x = 1

axes[1].set_xlim(0, max_x)
axes[1].set_ylim(0, max_frame)
axes[1].set_ylabel("time [frame]", fontsize=20)
axes[1].yaxis.set_label_coords(-0.8, 0.5)
axes[1].tick_params(bottom=False, labelbottom=False)

x = np.arange(0, max_x, 0.01)
n = len(color_code)

for i in range(n):
    y1 = [max_frame/n * i] * len(x)
    y2 = [max_frame/n * (i+1)] * len(x)

    axes[1].fill_between(x, y1, y2, facecolor=color_code[i])

plt.savefig("scatter.png", dpi=200)
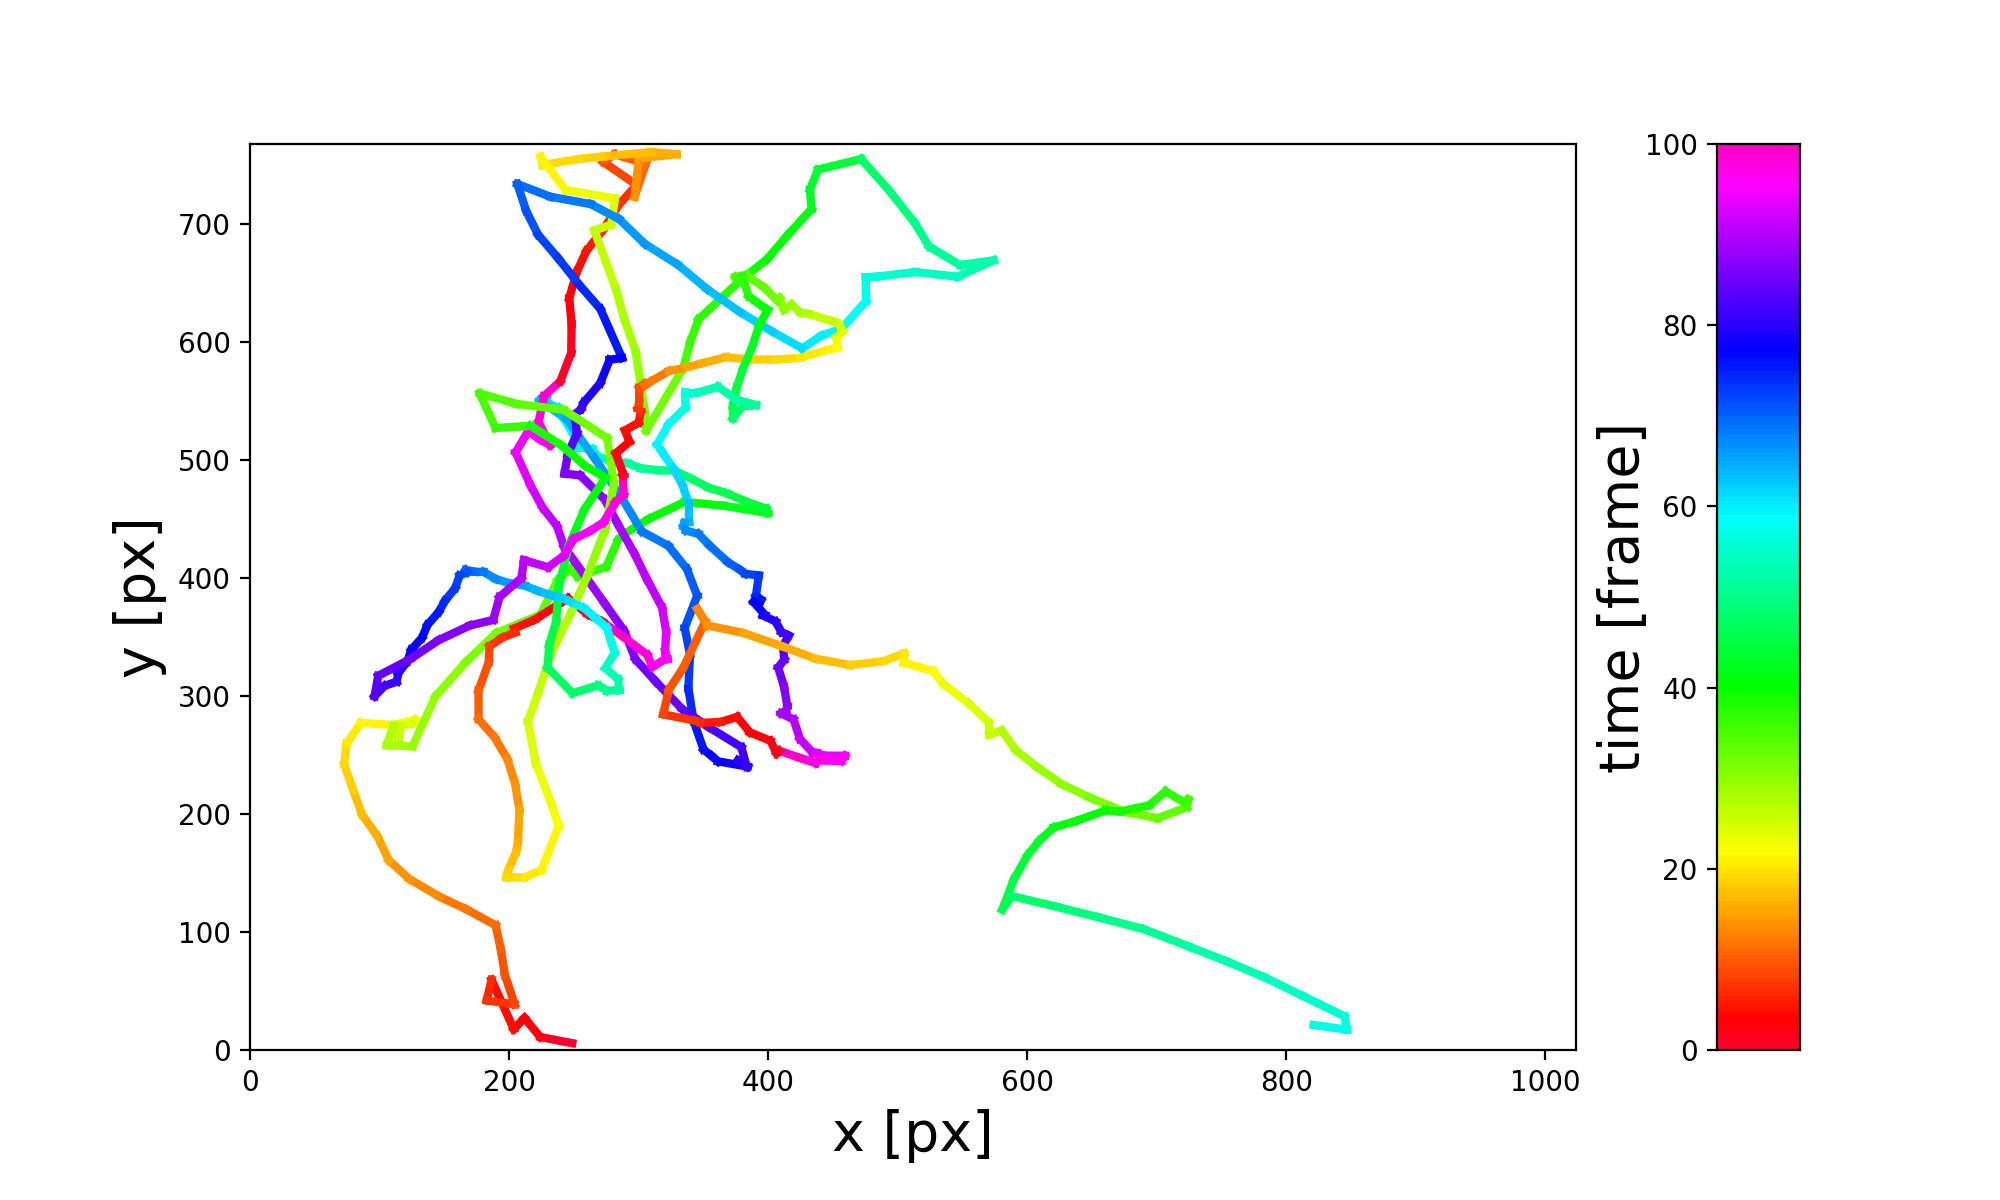
plt.plot
Python
fig, axes = plt.subplots(1, 2, figsize=[10, 6], gridspec_kw={'width_ratios': [8, 0.5]})

axes[0].set_xlim([0, 1024])
axes[0].set_ylim([0, 768])
axes[0].set_xlabel("x [px]", fontsize=20)
axes[0].set_ylabel("y [px]", fontsize=20)

#プロット
for i in range(len(colors)):
    try:
        point0 = p[p["frame"] == (colors["time"][i] + p["frame"][0])]
        idx = point0.index[0] #次のフレームを取得するためにindex取得
        point0 = point0.reset_index(drop=True) #[0]で要素取得するためにreset

        try:
            point1 = p[p.index == (idx+1)]
            point1 = point1.reset_index(drop=True)

            #プロット
            x = [point0["x"][0], point1["x"][0]]
            y = [point0["y"][0], point1["y"][0]]
            axes[0].plot(x, y, color=colors["color"][i], linewidth=3)

        except KeyError: #一致するものがない
            pass

    except IndexError: #一致するものがない
        pass

#カラーバー
max_x = 1

axes[1].set_xlim(0, max_x)
axes[1].set_ylim(0, max_frame)
axes[1].set_ylabel("time [frame]", fontsize=20)
axes[1].yaxis.set_label_coords(-0.8, 0.5)
axes[1].tick_params(bottom=False, labelbottom=False)

x = np.arange(0, max_x, 0.01)
n = len(color_code)

for i in range(n):
    y1 = [max_frame/n * i] * len(x)
    y2 = [max_frame/n * (i+1)] * len(x)

    axes[1].fill_between(x, y1, y2, facecolor=color_code[i])

plt.savefig("plot.png", dpi=200)
実際に使う時はpxを実長に、frameを実時間に変換してください。


