動機、概要
GeoDjangoなどで例えばここのような形で、DBのテーブル(PostGIS利用)から情報を取得してベクトルタイルサーバーとして動かせる機能があるらしい。
似たようなことをPythonのマイクロWebフレームワーク(ここではFastAPIを使用)で出来ないかと思い、色々調べたので自分用にメモ。
なお、理想的にはPostGISであったり、NoSQLであればMongoDBのGeospatial Query辺りを使ったシステムの構築を行い、配信形式もGeoJSONだけでなくより実用的なバイナリベクトルタイル形式(参考)などにも対応させるところまでやりたいが、いきなり全部対応するのは大変なのでここでは
- マイクロWebフレームワークを使ったタイルサーバーのエンドポイント生成
-
<url>/{z}/{x}/{y}.geojson形式でHTTPリクエスト(GET)を受け取り、適切な形式でレスポンス(GeoJSON or 404)を返すこと
-
に主眼を置いている。一方で、
- DB(PostgreSQLやMongoDBなど)との接続・連携
-
mvt(pbf)といったバイナリ形式での配信 - 上記の2つの機能を組み込んだ上でパフォーマンスの評価
- どのようなデータ・クエリならマシン負荷やレスポンス速度が現実的に出来そうか
といった辺りは現時点では出来ておらず、今後の課題となる。
(つまり、実用にはまだ遠い状況。。。可能であれば、今後調査して記事を追加などしていく予定)
実践
デモ
実行環境
- Ubuntu 20.04LTS
-
pyenv+miniconda3- conda仮想環境を利用
geospatial系のライブラリは依存関係やビルドなどが意外と面倒だった記憶があるので、ここではcondaを使って環境構築をしている。
conda仮想環境は例えば、
name: fastapi_geojsontileserver
channels:
  - conda-forge
  - defaults
dependencies:
  # core
  - python==3.7.*
  # FastAPI
  - fastapi
  - uvicorn
  - aiofiles
  # for handling GeoSpatial data
  - pandas>=1.1
  - geopandas>=0.8
  - gdal==3.0.*
  - shapely
のようなYAMLファイルを用意しておいて、
# YAMLファイルから仮想環境作成
conda env create -f conda_packages.yml

# 仮想環境をアクティブにする
conda activate <仮想環境名>
のようにする。
なお、YAMLファイルの仮想環境名(name:の部分)やインストールするライブラリ(dependencies:の部分)は必要に応じて適宜編集する。
ディレクトリ構造・ファイル
例えば以下のような感じ:
.
├── app
│   ├── __init__.py
│   ├── client
│   │   └── index.html
│   └── main.py
└── data
    └── test.geojson
-
app/main.pyでタイルサーバーの処理を実装している- なお、
__init__.pyは空ファイル
- なお、
- タイルサーバーの動作確認を目的とし、
app/client/下に可視化用のHTMLファイルなどを入れておく- ここでは主にLeafletを使う
- テストデータとして
data/test.geojsonに適当なGeoJSON形式のデータを入れておく- 本来はDBなどを用意しておくべきだが、今回は簡易的にGeoJSONをGeoPandasで読み込んで擬似的にクエリ操作などを再現する
app/main.pyおよび、app/client/index.htmlの例は以下で詳述。
app/main.py
"""
app main

GeoJSON VectorTileLayer Test
"""

import pathlib
import json
import math
from typing import Optional

from fastapi import (
    FastAPI,
    HTTPException,
)
from fastapi.staticfiles import StaticFiles
from fastapi.responses import RedirectResponse, HTMLResponse
import geopandas as gpd
import shapely.geometry

# const
PATH_STATIC = str(pathlib.Path(__file__).resolve().parent / "client")

EXT_DATA_PATH = "./data/"   # TMP

# test data
gdf_testdata = gpd.read_file(EXT_DATA_PATH + "test.geojson")


def create_app():
    """create app"""
    _app = FastAPI()

    # static
    _app.mount(
        "/client",
        StaticFiles(directory=PATH_STATIC, html=True),
        name="client",
    )

    return _app


app = create_app()


@app.get('/', response_class=HTMLResponse)
async def site_root():
    """root"""
    return RedirectResponse("/client")


@app.get("/tiles/test/{z}/{x}/{y}.geojson")
async def test_tile_geojson(
    z: int,
    x: int,
    y: int,
    limit_zmin: Optional[int] = 8,
) -> dict:
    """
    return GeoJSON Tile
    """

    if limit_zmin is not None:
        if z < limit_zmin:
            raise HTTPException(status_code=404, detail="Over limit of zoom")

    # test data
    gdf = gdf_testdata.copy()

    bbox_polygon = tile_bbox_polygon(z, x, y)

    # filtering
    intersections = gdf.geometry.intersection(bbox_polygon)
    gs_filtered = intersections[~intersections.is_empty]    # geoseries
    gdf_filtered = gpd.GeoDataFrame(
        gdf.loc[gs_filtered.index, :].drop(columns=['geometry']),
        geometry=gs_filtered,
    )

    # NO DATA
    if len(gs_filtered) == 0:
        raise HTTPException(status_code=404, detail="No Data")

    # return geojson
    return json.loads(
        gdf_filtered.to_json()
    )


def tile_coord(
    zoom: int,
    xtile: int,
    ytile: int,
) -> (float, float):
    """
    This returns the NW-corner of the square. Use the function
    with xtile+1 and/or ytile+1 to get the other corners.
    With xtile+0.5 & ytile+0.5 it will return the center of the tile.
    http://wiki.openstreetmap.org/wiki/Slippy_map_tilenames#Tile_numbers_to_lon..2Flat._2
    """
    n = 2.0 ** zoom
    lon_deg = xtile / n * 360.0 - 180.0
    lat_rad = math.atan(math.sinh(math.pi * (1 - 2 * ytile / n)))
    lat_deg = math.degrees(lat_rad)
    return (lon_deg, lat_deg)


def tile_bbox_polygon(
    zoom: int,
    xtile: int,
    ytile: int,
) -> shapely.geometry.Polygon:
    """
    create bbox for Tile by using shapely.geometry
    """
    z = zoom
    x = xtile
    y = ytile

    # get bbox
    nw = tile_coord(z, x, y)
    se = tile_coord(z, x+1, y+1)
    bbox = shapely.geometry.Polygon(
        [
            nw, (se[0], nw[1]),
            se, (nw[0], se[1]), nw
        ]
    )
    return bbox
- テストデータ(
test.geojson)はgeopandasでパスを指定して読み込んでいる- テストデータもgeopandasも暫定的に用意・使用しているものなので詳細はパス
- 関数:
def test_tile_geojsonが処理の本体で、{z}/{x}/{y}(zoom、位置)はPath Parameterとして受け取り、その他に必要なパラメータがあればQuery Parameterの形(URLの後に?=<***>のような形で指定)で受け取ることが出来る(ここではテスト用にzoomの最小値limit_zminを設定している)- 受け取った
{z}/{x}/{y}(それぞれ整数値)から緯度経度の矩形範囲(bbox)に変換、テストデータ(test.geojson)からbboxの範囲で切り取って(intersection)geojsonの形で返す。データ無しなどの場合は404を投げている(参考)。 -
{z}/{x}/{y}の各整数値から緯度経度座標への変換はヘルパー関数tile_coord、tile_bbox_polygonによって行っている- 処理は概ねdjango-geojsonのTiledGeoJSONLayerViewの処理を参考にしている(source)
- なお、
tile_coordに関してはほとんどopenstreetmap.org wikiに記載の処理そのまま
- 受け取った
- 可視化用のHTMLファイルはFastAPIにおけるStatic Filesとしてマウント、配信している
- タイルサーバー部分と同じドメインで配信しないとCORSエラーが起こるため
app/client/index.html
<!DOCTYPE html>
<html>

<head>
  <meta charset="UTF-8">
  <meta name="viewport" content="initial-scale=1.0, maximum-scale=1.0" />
  <title>Leaflet GeoJSON TileLayer(Polygon) Test</title>

  <link rel="stylesheet" href="https://unpkg.com/leaflet@1.6.0/dist/leaflet.css" />
  <script src="https://unpkg.com/leaflet@1.6.0/dist/leaflet.js"></script>
  <script src="https://unpkg.com/leaflet-hash@0.2.1/leaflet-hash.js"></script>

  <style>
    #map {
      position: absolute;
      top: 0;
      left: 0;
      bottom: 0;
      right: 0;
    }

    .leaflet-control-container::after {
      content: url(https://maps.gsi.go.jp/image/map/crosshairs.png);
      z-index: 1000;
      display: block;
      position: absolute;
      top: 50%;
      left: 50%;
      transform: translate(-50%, -50%);
    }

  </style>
</head>

<body>
  <div id="map"></div>
  <script>
    // Initalize map
    const map = L.map("map", L.extend({
      minZoom: 5,
      zoom: 14,
      maxZoom: 22,
      center: [35.5, 139.5],
    }, L.Hash.parseHash(location.hash)));
    map.zoomControl.setPosition("bottomright");
    L.hash(map);


    // GeoJSON VectorTileLayer
    const tile_geojson_sample = Object.assign(new L.GridLayer({
        attribution: "hoge",
        minZoom: 4,
        maxZoom: 22,
    }), {
        createTile: function(coords) {
            const template = "http://localhost:8000/tiles/test/{z}/{x}/{y}.geojson?limit_zmin=7";
            const div = document.createElement('div');
            div.group = L.layerGroup();
            fetch(L.Util.template(template, coords)).then(a => a.ok ? a.json() : null).then(geojson => {
                if (!div.group) return;
                if (!this._map) return;
                if (!geojson) return;
                div.group.addLayer(L.geoJSON(geojson, {
                    style: () => {
                        return {}
                    }
                }).bindPopup("test"));
                div.group.addTo(this._map);
            });
                return div;
            }
        }).on("tileunload", function(e) {
        if (e.tile.group) {
            if (this._map) this._map.removeLayer(e.tile.group);
            delete e.tile.group;
        }
    });

    // basemap layers
    const osm = L.tileLayer('http://tile.openstreetmap.jp/{z}/{x}/{y}.png', {
        attribution: "<a href='http://osm.org/copyright' target='_blank'>OpenStreetMap</a> contributors",
        // minZoom: 10,
        maxNativeZoom: 18,
        maxZoom: 22,
    });

    const gsi_std = L.tileLayer(
'https://cyberjapandata.gsi.go.jp/xyz/std/{z}/{x}/{y}.png',
        {
            attribution: "<a href='http://portal.cyberjapan.jp/help/termsofuse.html' target='_blank'>地理院タイル(標準地図)</a>",
            maxNativeZoom: 18,
            maxZoom: 22,
            opacity:1
        });

    const gsi_pale = L.tileLayer(
        'http://cyberjapandata.gsi.go.jp/xyz/pale/{z}/{x}/{y}.png',
        {
            attribution: "<a href='http://portal.cyberjapan.jp/help/termsofuse.html' target='_blank'>地理院タイル(淡色地図)</a>",
            maxNativeZoom: 18,
            maxZoom: 22,
        });

    const gsi_ort = L.tileLayer(
'https://cyberjapandata.gsi.go.jp/xyz/ort/{z}/{x}/{y}.jpg',
        {
            attribution: "<a href='http://portal.cyberjapan.jp/help/termsofuse.html' target='_blank'>地理院タイル(オルソ)</a>",
            maxNativeZoom: 17,
            maxZoom: 22,
            opacity:0.9
        });

    const gsi_blank = L.tileLayer(
'https://cyberjapandata.gsi.go.jp/xyz/blank/{z}/{x}/{y}.png',
        {
            attribution: "<a href='http://portal.cyberjapan.jp/help/termsofuse.html' target='_blank'>地理院タイル(白地図)</a>",
            maxNativeZoom: 14,
            maxZoom: 22,
            opacity:1,
        });


    L.control.scale({
        imperial: false,
        metric: true,
    }).addTo(map);

    const baseLayers ={
        "地理院タイル(標準地図)": gsi_std,
        "地理院タイル(淡色地図)": gsi_pale,
        "地理院タイル(オルソ)": gsi_ort,
        "地理院タイル(白地図)": gsi_blank,
        'osm': osm.addTo(map),
    };

    const overlays = {"GeoJSON TileLayer(sample)": tile_geojson_sample};

    L.control.layers(baseLayers, overlays, {position:'topright',collapsed:true}).addTo(map);
    const hash = L.hash(map);

  </script>
</body>

</html>
const tile_geojson_sample部分で、自作して動かしているタイルサーバーのURL+クエリストリングを指定して読み込んでいる。
あくまでもタイルサーバーがちゃんと動いているかどうかの確認がメインで、本質部分ではないのでこれ以上の詳細は省略。
上記のHTMLの作成には、
- https://qiita.com/frogcat/items/9062de8ff0782269e3db
- https://qiita.com/frogcat/items/97ab41c6675213b1a3f4
- https://qiita.com/frogcat/items/3d795c5cbe026c372bf4
- https://qiita.com/frogcat/items/d0579fbe1d7c375842b0
などを参考にした。
立ち上げ、実行
サーバー立ち上げには例えば以下のコマンドを叩けば良い:
uvicorn app.main:app
※開発時や運用時に必要or便利なオプションがあるので、適宜uvicorn公式などで起動オプションを確認
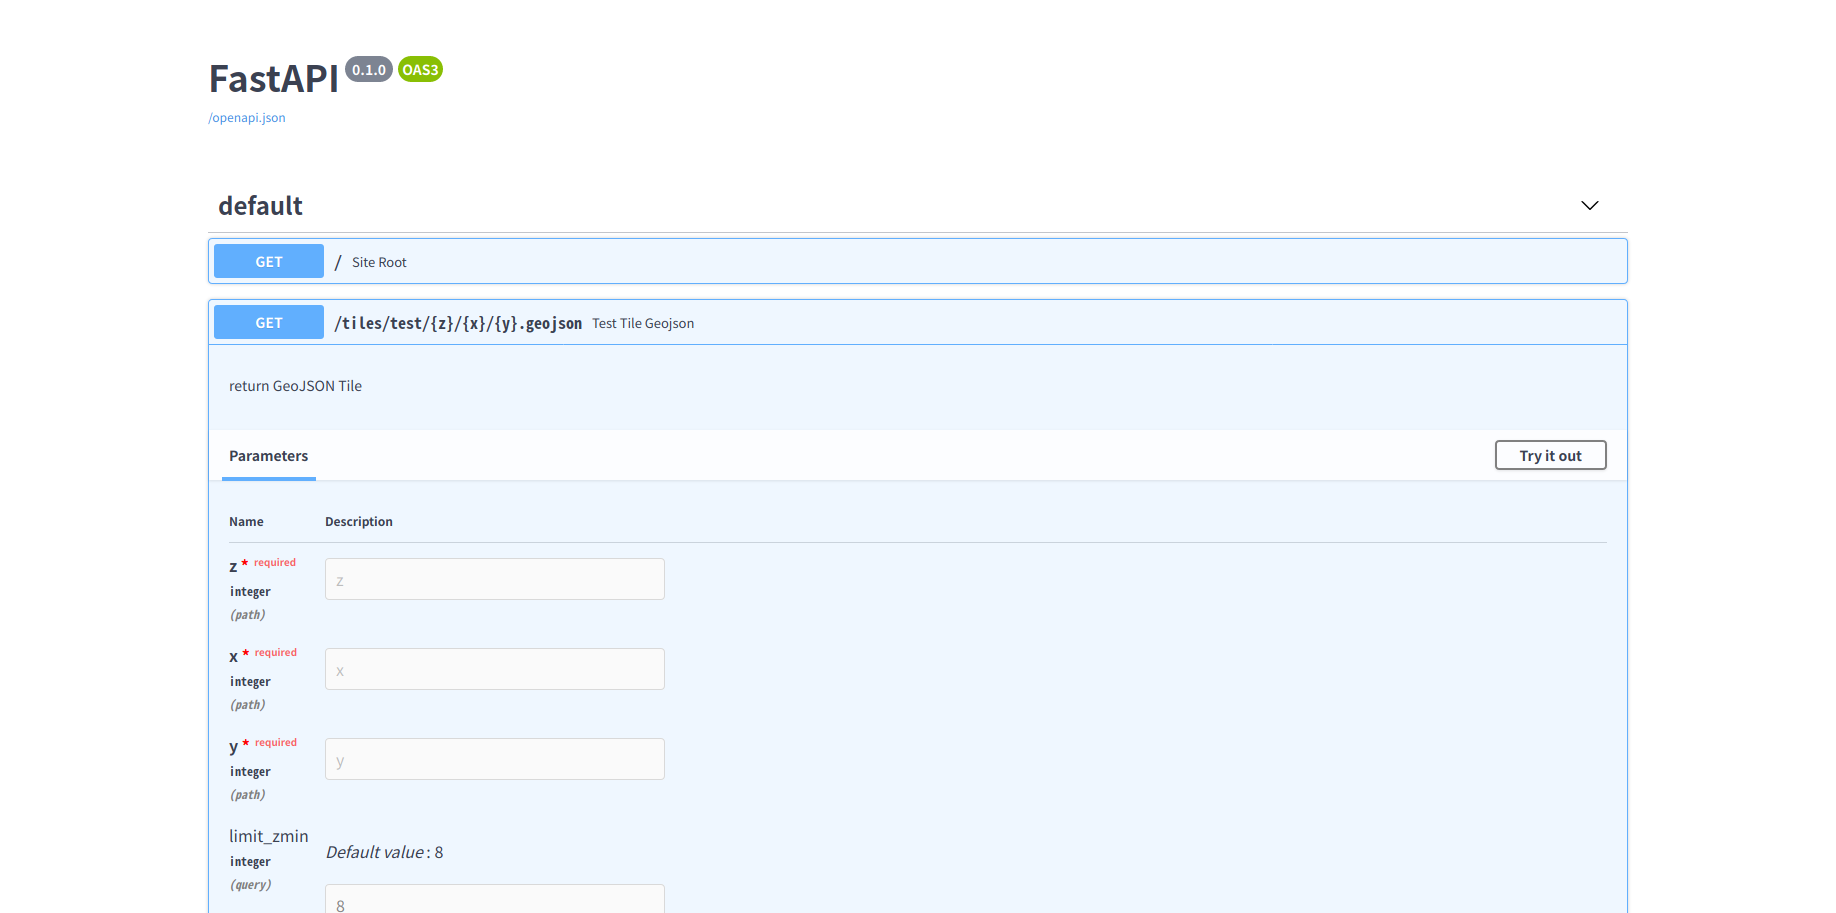
作ったタイルサーバーのAPIはSwagger(OpenAPI)として例えば http://localhost:8000 などから確認出来る
(ドキュメントの自動生成 + 簡単にその場で動作確認が出来る)
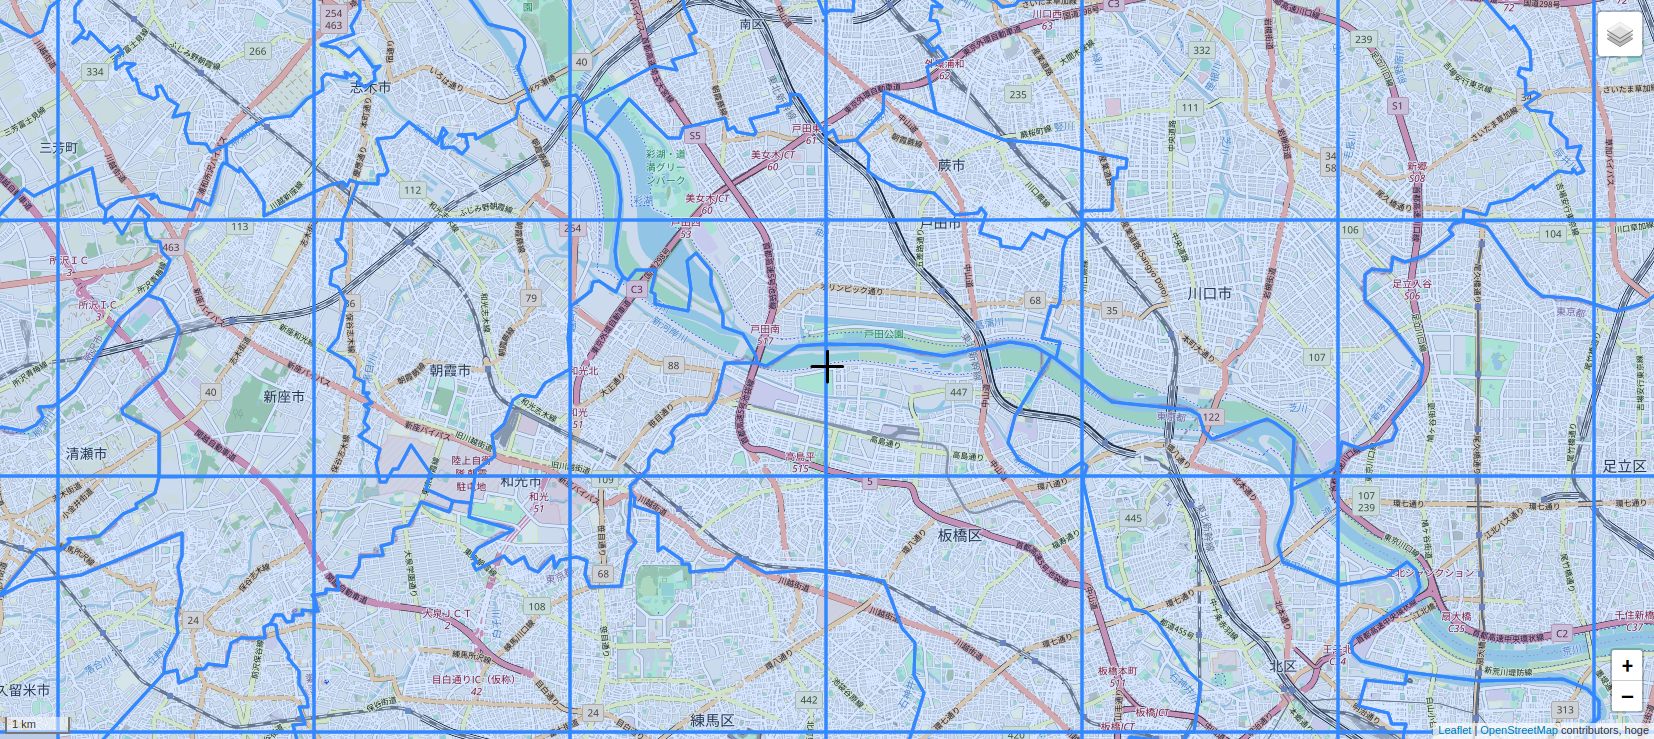
ローカルで立ち上げている場合、 http://localhost:8000/client などを開けば上記で作った可視化用のHTMLを確認出来る:
上記の実行例は市区町村界データ(Polygon, MultiPolygon)を使用しているが、データとしてはLineStringやPointを使ってもほぼ全く同じように実行することが出来る。
ちなみに変に欠けている部分はテストデータの中身の問題。(geopandasでintersection処理を行う際に、invalidなものを除去するなど予めデータ選択などを行っている)
なお、実行時にFastAPI(uvicorn)のコンソールログを見ると
INFO:     127.0.0.1:54910 - "GET /tiles/test/9/451/202.geojson?limit_zmin=7 HTTP/1.1" 200 OK
INFO:     127.0.0.1:54902 - "GET /tiles/test/9/456/202.geojson?limit_zmin=7 HTTP/1.1" 404 Not Found
INFO:     127.0.0.1:54908 - "GET /tiles/test/9/450/199.geojson?limit_zmin=7 HTTP/1.1" 200 OK
INFO:     127.0.0.1:54910 - "GET /tiles/test/9/457/199.geojson?limit_zmin=7 HTTP/1.1" 404 Not Found
INFO:     127.0.0.1:54896 - "GET /tiles/test/9/457/200.geojson?limit_zmin=7 HTTP/1.1" 404 Not Found
INFO:     127.0.0.1:54904 - "GET /tiles/test/9/450/201.geojson?limit_zmin=7 HTTP/1.1" 200 OK
INFO:     127.0.0.1:54906 - "GET /tiles/test/9/457/201.geojson?limit_zmin=7 HTTP/1.1" 404 Not Found
INFO:     127.0.0.1:54908 - "GET /tiles/test/9/457/202.geojson?limit_zmin=7 HTTP/1.1" 404 Not Found
INFO:     127.0.0.1:54904 - "GET /tiles/test/9/451/198.geojson?limit_zmin=7 HTTP/1.1" 200 OK
INFO:     127.0.0.1:54902 - "GET /tiles/test/9/450/202.geojson?limit_zmin=7 HTTP/1.1" 200 OK
INFO:     127.0.0.1:54896 - "GET /tiles/test/9/452/198.geojson?limit_zmin=7 HTTP/1.1" 200 OK
INFO:     127.0.0.1:54910 - "GET /tiles/test/9/450/198.geojson?limit_zmin=7 HTTP/1.1" 200 OK
INFO:     127.0.0.1:54906 - "GET /tiles/test/9/453/198.geojson?limit_zmin=7 HTTP/1.1" 200 OK
INFO:     127.0.0.1:54910 - "GET /tiles/test/9/454/198.geojson?limit_zmin=7 HTTP/1.1" 200 OK
INFO:     127.0.0.1:54902 - "GET /tiles/test/9/449/199.geojson?limit_zmin=7 HTTP/1.1" 404 Not Found
INFO:     127.0.0.1:54904 - "GET /tiles/test/9/449/200.geojson?limit_zmin=7 HTTP/1.1" 200 OK
INFO:     127.0.0.1:54908 - "GET /tiles/test/9/449/198.geojson?limit_zmin=7 HTTP/1.1" 404 Not Found
INFO:     127.0.0.1:54910 - "GET /tiles/test/9/448/200.geojson?limit_zmin=7 HTTP/1.1" 404 Not Found
INFO:     127.0.0.1:54906 - "GET /tiles/test/9/449/201.geojson?limit_zmin=7 HTTP/1.1" 200 OK
INFO:     127.0.0.1:54896 - "GET /tiles/test/9/448/199.geojson?limit_zmin=7 HTTP/1.1" 404 Not Found
INFO:     127.0.0.1:54906 - "GET /tiles/test/7/112/49.geojson?limit_zmin=7 HTTP/1.1" 200 OK
INFO:     127.0.0.1:54908 - "GET /tiles/test/9/448/198.geojson?limit_zmin=7 HTTP/1.1" 404 Not Found
INFO:     127.0.0.1:54902 - "GET /tiles/test/9/455/198.geojson?limit_zmin=7 HTTP/1.1" 200 OK
INFO:     127.0.0.1:54904 - "GET /tiles/test/9/448/201.geojson?limit_zmin=7 HTTP/1.1" 200 OK
INFO:     127.0.0.1:54906 - "GET /tiles/test/7/111/49.geojson?limit_zmin=7 HTTP/1.1" 404 Not Found
INFO:     127.0.0.1:54902 - "GET /tiles/test/7/114/49.geojson?limit_zmin=7 HTTP/1.1" 200 OK
INFO:     127.0.0.1:54896 - "GET /tiles/test/7/113/49.geojson?limit_zmin=7 HTTP/1.1" 200 OK
INFO:     127.0.0.1:54910 - "GET /tiles/test/7/113/48.geojson?limit_zmin=7 HTTP/1.1" 200 OK
INFO:     127.0.0.1:54902 - "GET /tiles/test/7/112/51.geojson?limit_zmin=7 HTTP/1.1" 200 OK
みたいな感じになる。
まとめ
使っているデータや処理は暫定的な部分が多いが、それっぽく動くタイルサーバーの構築が出来た。
冒頭での記述の通り、実は課題事項が多々あるものの、とりあえず地図タイル・ベクトルタイルやPythonのマイクロWebフレームワーク全般の良い勉強にはなった。
参考
先行研究
- https://qiita.com/R_28/items/2fe16a1f37e2e46b135c
- http://waigani.hatenablog.jp/entry/2017/12/22/060000
国土地理院ベクトルタイル提供実験
全般的にかなり参考になった
- タイル仕様
-
タイル座標確認ページ
- 地図上でどのエリアがどの
{z}/{x}/{y}になるのか分かるので、APIのデバッグなどにも便利
- 地図上でどのエリアがどの
ベクトルタイルのFormat情報
GeoJSON
- https://s.kitazaki.name/docs/geojson-spec-ja.html
- https://docs.geolonia.com/geojson/
- https://gis-oer.github.io/gitbook/book/materials/web_gis/GeoJSON/GeoJSON.html
protobuf
拡張子が.mvt or .pbfのもの。
今回は未実装だが以降の課題として
- https://docs.mapbox.com/vector-tiles/specification/
- https://gdal.org/drivers/vector/mvt.html
-
https://github.com/tilezen/mapbox-vector-tile#encoding
- 座標はそのままの緯度経度ではなく、各タイル内での相対座標(defaultではx, y方向で
[0, 4096)の整数値)
- 座標はそのままの緯度経度ではなく、各タイル内での相対座標(defaultではx, y方向で
その他
「動的なベクトルタイルサーバー」とは違う機能だが参考になるもの
staticなベクトルタイル
-
mapbox/tippecanoe
- 静的なバイナリベクトルタイル(
pbf/mvt)の生成が出来る - GeoJSONファイルなどをソースに変換を行い、
/path/to/{z}/{x}/{y}.pbfのようなディレクトリ・ファイル群が作られる
- 静的なバイナリベクトルタイル(
geobuf
動的なタイルサーバーは負荷やレスポンス時間の問題が考えられるため、場合によってはタイル化ではなくこの辺りの手法が現実的な場合が結構ありそう
- https://shimz.me/blog/leaflet-js/5574
- https://observablehq.com/@saifulazfar/geobuf-l-vectorgrid-slicer-with-leaflet
- https://observablehq.com/@saifulazfar/geobuf-with-leaflet?collection=@saifulazfar/map
- https://observablehq.com/@saifulazfar/geobuf-with-importable-map-control-from-tmcw-map?collection=@saifulazfar/map
- https://github.com/mapbox/geobuf


