はじめに
地名の最後の一文字だけで地図をつくると地形が見える :: デイリーポータルZ という素敵な記事があります。
これを Leaflet と 国土地理院ベクトルタイル提供実験(地図情報-注記) を使って実装してみましょう。
できあがり
このように動作するものが出来上がりました。日本全国閲覧可能です。
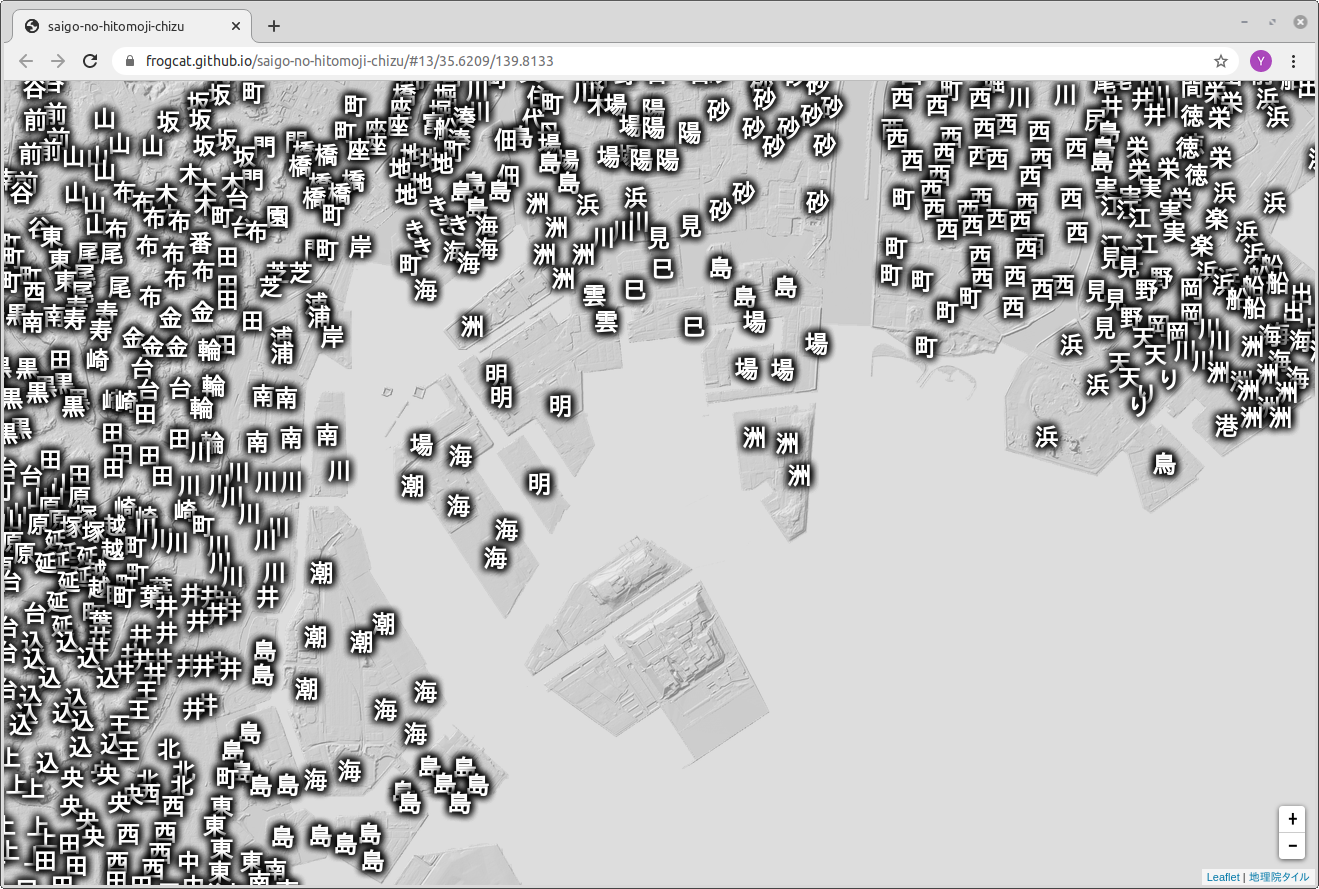
ワーキングデモはこちらからどうぞ。スマホでも PC(IE以外) でも動くと思います。
ソースコードはこちらに置いてますので fork して改造してみてください。
使用上の注意
- ズームレベルが 13 以上のときに「一文字」が表示されます (引いた状態では出ません)
- 「一文字」にマウスを載せるともともとの地名が表示されます
- それなりに通信が発生するので従量課金環境での閲覧はおすすめしません
解説
解説、といっても100行くらいの HTML+JS なのでそのまま貼っておきます。
<!DOCTYPE html>
<html>

<head>
  <meta charset="UTF-8">
  <title>saigo-no-hitomoji-chizu</title>
  <meta name="viewport" content="initial-scale=1.0, maximum-scale=1.0" />
  <link rel="stylesheet" href="https://unpkg.com/leaflet@1.6.0/dist/leaflet.css" />
  <script src="https://unpkg.com/leaflet@1.6.0/dist/leaflet.js"></script>
  <script src="https://unpkg.com/leaflet-hash@0.2.1/leaflet-hash.js"></script>
  <style>
    #map {
      position: absolute;
      top: 0;
      left: 0;
      bottom: 0;
      right: 0;
    }

    .knj {
      font-size: 18pt;
      font-weight: bold;
      color: white;
      text-shadow: 0 0 8px black, 0 0 8px black, 0 0 8px black, 0 0 8px black, 0 0 8px black;
    }
  </style>
</head>

<body>
  <div id="map"></div>
  <script>
    const map = L.map("map", L.extend({
      zoom: 13,
      maxZoom: 18,
      center: [35.6707, 139.7852]
    }, L.Hash.parseHash(location.hash)));

    L.tileLayer("https://cyberjapandata.gsi.go.jp/xyz/hillshademap/{z}/{x}/{y}.png", {
      attribution: "<a href='http://maps.gsi.go.jp/development/ichiran.html'>地理院タイル</a>",
      opacity: 0.4
    }).addTo(map);

    map.attributionControl.addAttribution("<a href='https://github.com/frogcat/saigo-no-hitomoji-chizu'>fork me on GitHub</a>");

    map.zoomControl.setPosition("bottomright");

    L.hash(map);

    const knjLayer = Object.assign(L.gridLayer({
      maxNativeZoom: 15,
      minNativeZoom: 15
    }), {
      onAdd: function(map) {
        this._group = L.featureGroup().addTo(map);
        L.GridLayer.prototype.onAdd.call(this, map);
      },
      onRemove: function(map) {
        if (this._group) {
          this._group.remove();
          delete this._group;
        }
        L.GridLayer.prototype.onRemove.call(this, map);
      },
      createTile: function(coords) {
        const div = document.createElement("div");
        div.layers = [];
        if (this._map.getZoom() < 13) return div;
        const url = L.Util.template("https://cyberjapandata.gsi.go.jp/xyz/experimental_anno/{z}/{x}/{y}.geojson", coords);
        fetch(url).then(a => a.ok ? a.json() : null).then(json => {
          if (json === null || !this._map || this._map.getZoom() < 13 || !this._group) return;
          json.features.filter(x => x.properties.annoCtg.match(/^居住/)).forEach(x => {
            const knj = x.properties.knj;
            const k = knj.replace(/(.+)$/, "").split("").pop();
            const p = x.geometry.coordinates;
            const m = L.marker([p[1], p[0]], {
              icon: L.divIcon({
                html: k,
                className: "knj"
              })
            }).bindTooltip(knj).addTo(this._group);
            div.layers.push(m)
          });
        });
        return div;
      }
    }).on("tileunload", function(e) {
      while (e.tile.layers.length > 0) {
        e.tile.layers.pop().remove();
      }
    });

    map.on("zoomend", function() {
      const z = this.getZoom();
      if (z < 13) {
        if (this.hasLayer(knjLayer)) this.removeLayer(knjLayer);
      } else {
        if (!this.hasLayer(knjLayer)) this.addLayer(knjLayer);
      }
    }).fire("zoomend");
  </script>
</body>

</html>
- Leaflet から GeoJSON のベクトルタイルを使用する方法は以前 https://qiita.com/frogcat/items/97ab41c6675213b1a3f4 に書きました。ここでは
L.TileLayer + emptyImageを使う代わりにObject.assignで直接GridLayerのインスタンスをいじっています。 - minNativeZoom と maxNativeZoom をそれぞれ 15 に指定することで、ズームレベルによらず z=15 のタイルを作ってくれます。ただ、z=15 で使用されるタイル数を基準とすると、z=14 では4倍、z=13 では16倍、さらに z=12 では64倍の GeoJSON タイルを読み込むことになり z=12 あたりから挙動が怪しくなってきます。そのため、z=12以下の環境では knjLayer を map から remove することで対処しています
まとめ
今のトレンドは mapbox-gl-js と 地理院地図VECTOR だとは思うのですが、どうもしっくりくるやり方が思いつきませんでした。ここでは Leaflet と地理院ベクトルタイル (GeoJSON) でやっつけてみました。