はじめに
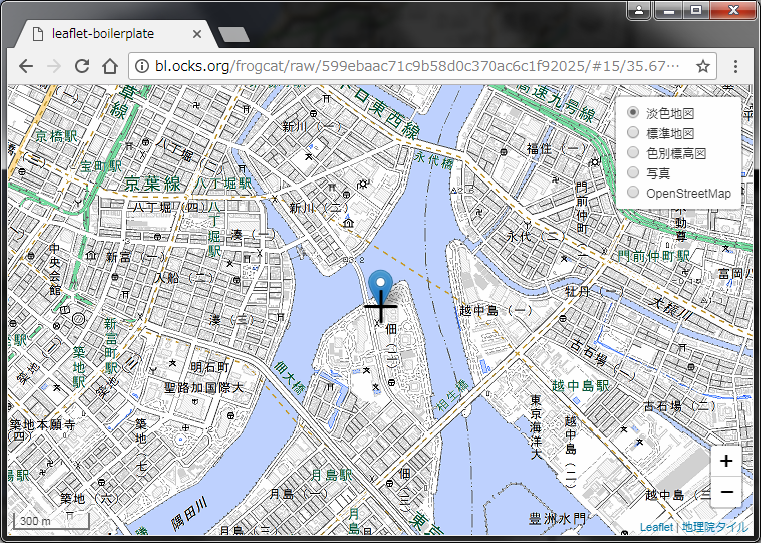
Leaflet でちょっとした何かを作ろうと思ったときに使えるボイラープレートを紹介します。とりあえず HTML をコピペすればこんな画面のものが簡単に動きますよ、というものです。デモは こちら からどうぞ。
ボイラープレート
<!DOCTYPE html>
<html>
<head>
<meta charset="UTF-8">
<title>leaflet-boilerplate</title>
<meta name="viewport" content="initial-scale=1.0, maximum-scale=1.0" />
<link rel="stylesheet" href="https://unpkg.com/leaflet@1.9.3/dist/leaflet.css" />
<script src="https://unpkg.com/leaflet@1.9.3/dist/leaflet.js"></script>
<script src="https://unpkg.com/leaflet-hash@0.2.1/leaflet-hash.js"></script>
<style>
.leaflet-control-container::after {
content: url(https://maps.gsi.go.jp/image/map/crosshairs.png);
z-index: 1000;
display: block;
position: absolute;
top: 50%;
left: 50%;
transform: translate(-50%, -50%);
}
</style>
</head>
<body>
<div id="map" style="position:absolute;top:0;left:0;bottom:0;right:0;"></div>
<script>
var map = L.map("map", L.extend({
zoom: 15,
center: [35.6707, 139.7852]
}, L.Hash.parseHash(location.hash)));
L.control.layers({
"淡色地図": L.tileLayer("https://cyberjapandata.gsi.go.jp/xyz/pale/{z}/{x}/{y}.png", {
attribution: "<a href='http://maps.gsi.go.jp/development/ichiran.html'>地理院タイル</a>"
}).addTo(map),
"標準地図": L.tileLayer("https://cyberjapandata.gsi.go.jp/xyz/std/{z}/{x}/{y}.png", {
attribution: "<a href='http://maps.gsi.go.jp/development/ichiran.html'>地理院タイル</a>"
}),
"色別標高図": L.tileLayer("https://cyberjapandata.gsi.go.jp/xyz/relief/{z}/{x}/{y}.png", {
attribution: "<a href='http://maps.gsi.go.jp/development/ichiran.html'>地理院タイル</a>"
}),
"写真": L.tileLayer("https://cyberjapandata.gsi.go.jp/xyz/seamlessphoto/{z}/{x}/{y}.jpg", {
attribution: "<a href='http://maps.gsi.go.jp/development/ichiran.html'>地理院タイル</a>"
}),
"OpenStreetMap": L.tileLayer("https://{s}.tile.openstreetmap.org/{z}/{x}/{y}.png", {
attribution: "© <a href='https://www.openstreetmap.org/copyright'>OpenStreetMap</a> contributors"
})
}).addTo(map);
map.zoomControl.setPosition("bottomright");
    L.control.scale({
      imperial: false,
      metric: true
    }).addTo(map);
L.hash(map);
L.marker(map.getCenter()).addTo(map);
</script>
</body>
</html>
解説
ズームボタンの位置を変更したい
GoogleMaps なんかは地図のズームボタンが右下にあることが多いのですが、Leaflet のデフォルトは左上です。
以下のコードで右下に変更しています。
map.zoomControl.setPosition("bottomright");
参考: https://leafletjs.com/reference.html#control
スケールバーをつけたい
上の画像の例では左下に 300m のようなスケールバーが表示されています。これはデフォルトでは表示されないので以下のコードで追加しています。
L.control.scale({
imperial: false,
metric: true
}).addTo(map);
参考: https://leafletjs.com/reference.html#control-scale
ここでオプションとして {imperial:false,metric:true} を渡しているのですが、imperial を true にするとマイル単位のスケールバーが、metric を true にするとメートル単位のスケールバーが表示されます(両方を同時に表示することも可能です)。日本語圏だとたいがいメートル法でしょうから、ここではメートルだけにしています。
地図の切り替えコントロールをつけたい
用途に応じていろんな地図に切り替えたい場合があると思います。これを実現しているのが以下のコードです。
L.control.layers({
"淡色地図": L.tileLayer("https://cyberjapandata.gsi.go.jp/xyz/pale/{z}/{x}/{y}.png", {
attribution: "<a href='http://maps.gsi.go.jp/development/ichiran.html'>地理院タイル</a>"
}).addTo(map),
"標準地図": L.tileLayer("https://cyberjapandata.gsi.go.jp/xyz/std/{z}/{x}/{y}.png", {
attribution: "<a href='http://maps.gsi.go.jp/development/ichiran.html'>地理院タイル</a>"
}),
"色別標高図": L.tileLayer("https://cyberjapandata.gsi.go.jp/xyz/relief/{z}/{x}/{y}.png", {
attribution: "<a href='http://maps.gsi.go.jp/development/ichiran.html'>地理院タイル</a>"
}),
"写真": L.tileLayer("https://cyberjapandata.gsi.go.jp/xyz/seamlessphoto/{z}/{x}/{y}.jpg", {
attribution: "<a href='http://maps.gsi.go.jp/development/ichiran.html'>地理院タイル</a>"
}),
"OpenStreetMap": L.tileLayer("https://{s}.tile.openstreetmap.org/{z}/{x}/{y}.png", {
attribution: "© <a href='http://osm.org/copyright'>OpenStreetMap</a> contributors"
})
}).addTo(map);
参考: https://leafletjs.com/reference.html#control-layers
- 最初の4つは国土地理院の地図タイルサービス のタイルです。これら以外にもいろんな地図があるのでどうぞ。基本的には登録申請不要でアクセス制限もなく利用できますが、詳しくは 地理院タイルのご利用について をよく確認しましょう。
- 最後の1つは https://www.openstreetmap.org/ の提供するタイルです。登録などは不要ですが、大量の負荷を与えるようなアクセスは NG なので実験試作用くらいに考えておきましょう。こちらも Tile Usage Policy をよく確認しましょう。
中心線を置きたい
地図のまんなかに十字をみかけることがあると思います。プラグインなどいろんなやりかたがありますが、ここでは CSS だけで 地理院地図 の中心線を持ってきて実現してます。中心線自体いらなかったら CSS を削除してしまいましょう。
    .leaflet-control-container::after {
      content: url(https://maps.gsi.go.jp/image/map/crosshairs.png);
      z-index: 1000;
      display: block;
      position: absolute;
      top: 50%;
      left: 50%;
      transform: translate(-50%, -50%);
    }
緯度経度ズームを URL に反映したい
地図サービスではビューを移動したりズームを変更すると URL の一部に緯度経度とズームを反映したり、また、URL の緯度経度ズームを読み込んで地図の初期ビューを設定することがよくあると思います。上のデモでも実際にそんなことをやっています。
Leaflet の公式にこういう機能はありませんが、leaflet hash というプラグインでこの機能を実現できます。使い方は簡単です。
このようにプラグインをインポートして
<script src="https://unpkg.com/leaflet-hash@0.2.1/leaflet-hash.js"></script>
地図を初期化したあとに以下のメソッドを実行するだけです。
    var map = L.map(...);
    L.hash(map);
ちなみに L.hash を実行した際に、もし URL のフラグメントパートに http://bl.ocks.org/frogcat/raw/599ebaac71c9b58d0c370ac6c1f92025/#15/35.6707/139.7852 こんなかんじのズーム/緯度/経度が入っていれば、自動的にそのビューを再現してくれます。
なお、普通に L.hash を使うと
- L.map が指定の緯度経度で初期化される
- 初期化された際の緯度経度・ズームに応じた地図画像群が読み込まれる
- L.hash によって緯度経度・ズームが変更される(条件によってはアニメーション発生)
- 変更後の緯度経度・ズームに応じた地図画像群が読み込まれる
といった流れで、2 の地図画像ロードが無駄になったり、3 で急激なズーム変更アニメーションが起きたりしてすこしストレスがあります。L.map を以下のように実行することで、最初から URL のフラグメントパートを読むことで無駄なロードやズームパンを抑制しています。
    var map = L.map("map", L.extend({
      zoom: 15,
      center: [35.6707, 139.7852]
    }, L.Hash.parseHash(location.hash)));
