はじめに
下記記事の続き
https://qiita.com/iwasaki_kenichi/items/3144e923b0a573eac6e1
https://qiita.com/iwasaki_kenichi/items/e2f0c6777263a93c7230
https://qiita.com/iwasaki_kenichi/items/ec16e9f30f63cd0fc7a4
本投稿の目的は、NYCの近隣による樹冠の平均密度が近隣の樹木の数と相関しているかどうかを評価し、結果の適切なプロットを作成することです。
近隣別の樹木密度を計算する(I)
樹木密度を知るためには、樹木本数と面積を知る必要があります。
本項では、近隣別の木の本数を計算します。
ニューヨーク市の近隣別のすべての木の数を計算し、合計の木の列を持つ1つのデータフレームを作成します。結果は、ジオメトリのないデータフレームになります。
plot(st_geometry(trees))
# Compute the counts of all trees by hood
tree_counts <- count(trees, hood)

# Take a quick look
head(tree_counts)

# Remove the geometry
tree_counts_no_geom <- st_set_geometry(tree_counts,NULL)

# Rename the n variable to tree_cnt
tree_counts_renamed <- rename(tree_counts_no_geom, tree_cnt = n)

# Create histograms of the total counts
hist(tree_counts_renamed$tree_cnt)
最初のplotでは、treesを表示させています。

tree_counts_no_geom <- st_set_geometry(tree_counts,NULL)では、ジオメトリ列を削除しています。
hist(tree_counts_renamed$tree_cnt)では、ヒストグラムを生成しております。

近隣地域別の木の数がわかりました。次の演習では、近隣地域の面積を計算します。
近隣別の樹木密度を計算する(II)
これで(前の演習で得た)木の数がわかりました。この演習では、近傍領域を計算し、それを近傍sfオブジェクトに追加してから、前の演習で使用した非空間的な木の数のデータフレームに結合します。
# Compute areas and unclass
areas <- unclass(st_area(neighborhoods))

# Add the areas to the neighborhoods object
neighborhoods_area <- mutate(neighborhoods, area = areas)

# Join neighborhoods and counts
neighborhoods_counts <- left_join(neighborhoods_area,
                            tree_counts_renamed, by = "hood")

# Replace NA values with 0
neighborhoods_counts <- mutate(neighborhoods_counts,
                            tree_cnt = ifelse(is.na(tree_cnt),
                                              0, tree_cnt))

# Compute the density
neighborhoods_counts <- mutate(neighborhoods_counts,
                               tree_density = tree_cnt/area)
sf関数st_area()を使って木の密度変数を計算することができました。次の演習では、樹冠の平均値を計算して比較します。
近隣別の平均樹冠を計算する
木の数を使って近隣別の木の密度を計算しました。この演習では、結果が似ているかどうかを比較できるように、近隣別の平均樹冠をパーセンテージで計算します。
# Confirm that you have the neighborhood density results
head(neighborhoods)

# Transform the neighborhoods CRS to match the canopy layer
neighborhoods_crs <- st_transform(neighborhoods, crs = st_crs(canopy, asText = T))

# Convert neighborhoods object to a Spatial object
neighborhoods_sp <- as(neighborhoods_crs, "Spatial")

# Compute the mean of canopy values by neighborhood
canopy_neighborhoods <- extract(canopy, neighborhoods_sp, fun = mean)

# Add the mean canopy values to neighborhoods
neighborhoods_avg_canopy <- mutate(neighborhoods, avg_canopy = canopy_neighborhoods)
neighborhoods_crs <- st_transform(neighborhoods, crs = st_crs(canopy, asText = T))は、canopyのCRSに変換しています。
as(neighborhoods_crs, "Spatial")は、neighborhoods_crsをSpatial型に変換しています。
extract(canopy, neighborhoods_sp, fun = mean)で、平均を計算しています。
ggplot2を使ってプロットを作成
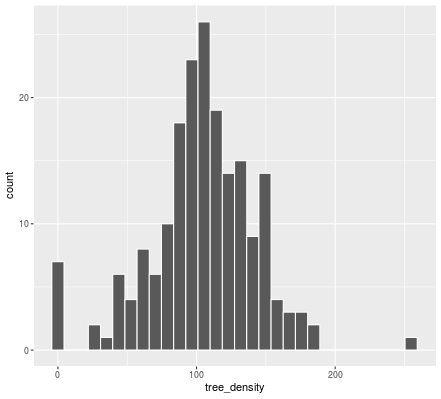
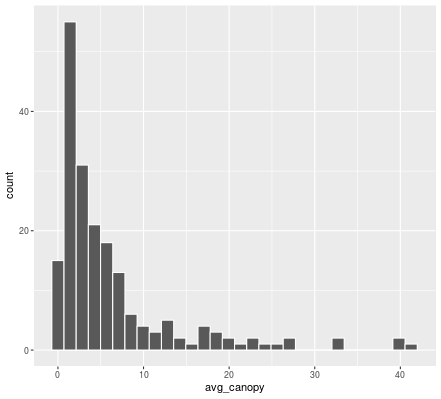
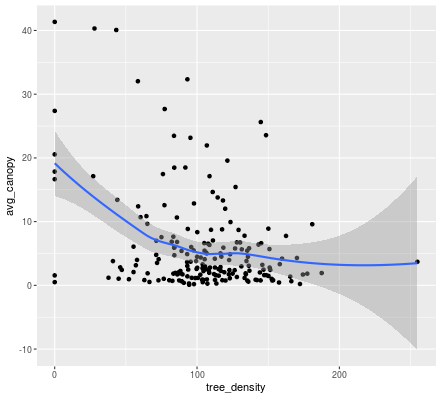
作成したデータの相関関係を計算し、ggplot2を使用してヒストグラムと散布図を作成します。
# Load the ggplot2 package
library(ggplot2)

# Create a histogram of tree density (tree_density)
ggplot(neighborhoods, aes(x = tree_density)) +
  geom_histogram(color = "white")

# Create a histogram of average canopy (avg_canopy)
ggplot(neighborhoods, aes(x = avg_canopy)) +
  geom_histogram(color = "white")

# Create a scatter plot of tree_density vs avg_canopy
ggplot(neighborhoods, aes(x = tree_density, y = avg_canopy)) +
    geom_point() +
    stat_smooth()

# Compute the correlation between density and canopy
cor(neighborhoods$tree_density, neighborhoods$avg_canopy)
相関係数は下記の通りです。
> cor(neighborhoods$tree_density, neighborhoods$avg_canopy)
[1] -0.3414462
ggplot2を使用してマップを作成
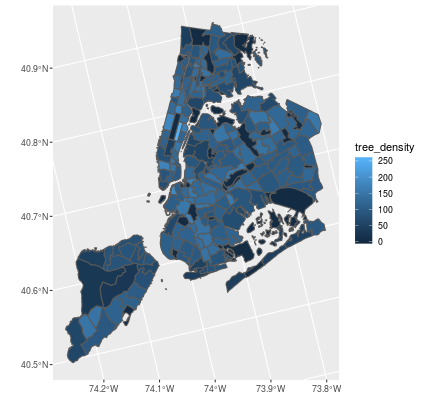
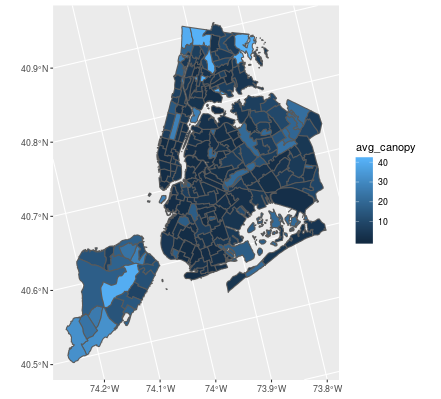
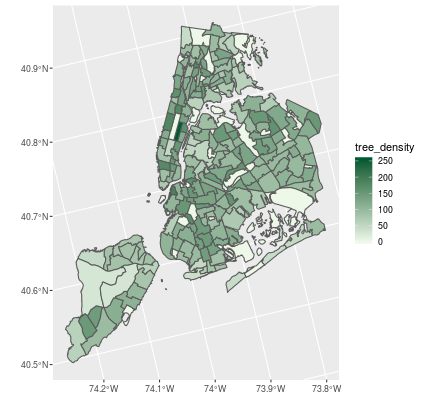
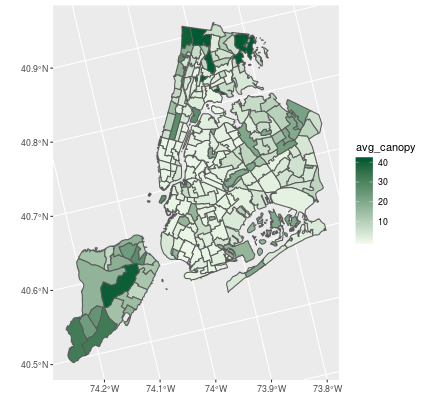
geom_sf()関数を使うことにより、 ggplot2の他のレイヤーと同じように動作し、aes()関数を使っプロットすることができます。これは例えば、変数に基づいてポリゴンを色分けすることでコロプレックスマップを作成することを意味しているかもしれません。geom_sf() はジオメトリのみをマッピングします。
# Plot the tree density with default colors
ggplot(neighborhoods) +
  geom_sf(aes(fill = tree_density))

# Plot the tree canopy with default colors
ggplot(neighborhoods) +
  geom_sf(aes(fill = avg_canopy))

# Plot the tree density using scale_fill_gradient()
ggplot(neighborhoods) +
  geom_sf(aes(fill = tree_density)) +
  scale_fill_gradient(low = "#edf8e9", high = "#005a32")

# Plot the tree canopy using the scale_fill_gradient()
ggplot(neighborhoods) +
  geom_sf(aes(fill = avg_canopy)) +
  scale_fill_gradient(low = "#edf8e9", high = "#005a32")
ggplotにより表示した図は下記です。
新しいレイヤータイプの geom_sf() は ggplot2 でマップを作成するのに大きな助けになります。色を変更することで、マップがより読みやすくなりました。これをtmapでやってみてはどうでしょうか?次の演習を見てください。
tmapを使ってマップを作成する
tmapパッケージは、マップを作成するための優れたツールである。これを使えば、データ値を結合して素敵なマップを作成するプロセスが単純化され、異なるレイヤーを簡単につなぎ合わせることができることがわかるだろう。
tmapはggplot2と似たように動作し、関数(この場合はtm_shape())でマップをセットアップし、その後にレイヤーやその他の命令が+で区切られて続くという点で似ている。
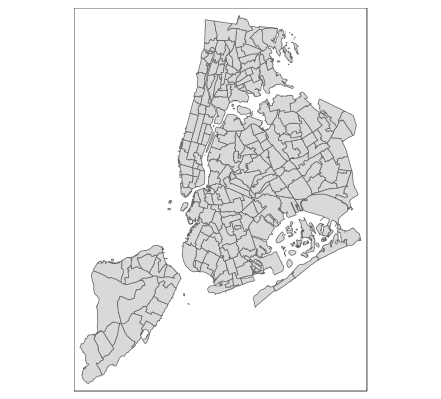
# Create a simple map of neighborhoods
tm_shape(neighborhoods) +
    tm_polygons()

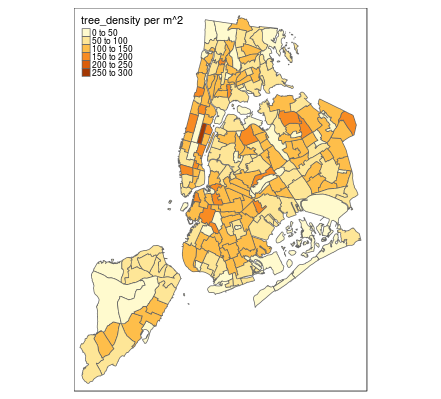
# Create a color-coded map of neighborhood tree density
tm_shape(neighborhoods) +
    tm_polygons("tree_density")

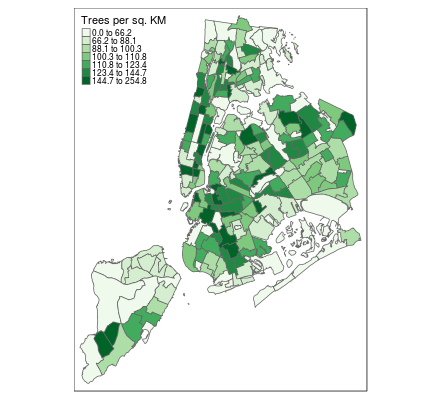
# Style the tree density map
tm_shape(neighborhoods) +
    tm_polygons("tree_density", palette = "Greens",
        style = "quantile", n = 7,
        title = "Trees per sq. KM")

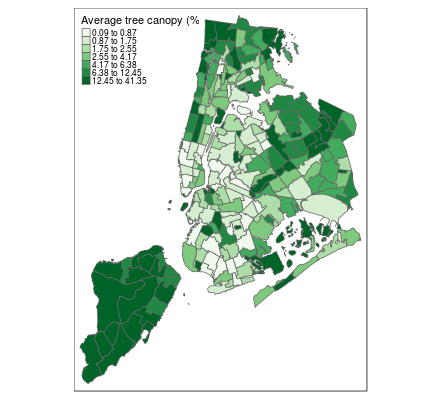
# Create a similar map of average tree canopy
tm_shape(neighborhoods) +
    tm_polygons("avg_canopy", palette = "Greens",
        style = "quantile", n = 7,
        title = "Average tree canopy (%)")
tmapは比較的簡単にRで素敵な地図を作ることができ、必要に応じてプロットを変更できる柔軟性を提供してくれます。
tmapを使って最終的なきれいなマップを作成します。
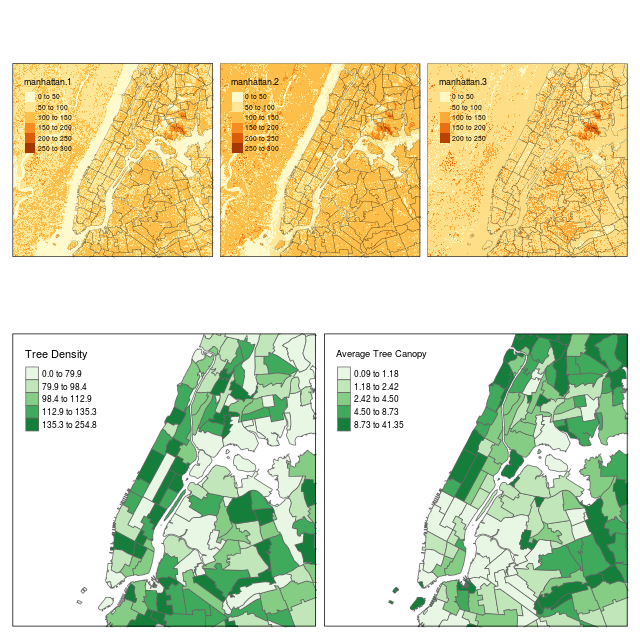
最後に、tmapを使用して3つのマップビューを持つ最終的なマップを作成し、航空写真で見た緑と、近隣別に計算した樹木密度および平均樹冠の結果を比較します。ここで問題となるのは、樹木密度と平均樹冠のどちらが航空写真で見たものとよりよく一致しているかということです。
# Combine the aerial photo and neighborhoods into one map
map1 <- tm_shape(manhattan) +
    tm_raster() +
    tm_shape(neighborhoods) +
    tm_borders(col = "black", lwd = 0.5, alpha = 0.5)

# Create the second map of tree measures
map2 <- tm_shape(neighborhoods, bbox = bbox(manhattan)) +
    tm_polygons(c("tree_density", "avg_canopy"),
                style = "quantile",
                palette = "Greens",
                title = c("Tree Density", "Average Tree Canopy"))

# Combine the two maps into one
tmap_arrange(map1, map2, asp = NA)
tmap_arrange(map1, map2, asp = NA)により、map1とmap2を組み合わせています。また、asp = NAを使用して、境界ボックスに一致するように高さ/幅をマップします。
以上より、ニューヨーク市の街路樹センサスのデータに基づいて、平均的な樹冠が木の密度よりも緑地をよりよく表現していることを共有できる素敵な最終マップを作成しました。
おわりに
ようやく第4回が終わりました。
本記事を持って、Spatial Analysis with sf and raster in Rが終わりました。
GISソフトを使った方が簡単な部分もありますが、大量のデータに対して同じ処理をするときや、GISソフトだと対応できないものなどが有ると思います。そういったときにはsfやrasterパッケージ等を使って処理させていければと思いました。
