はじめに
下記記事の続き
https://qiita.com/iwasaki_kenichi/items/3144e923b0a573eac6e1
ベクトルおよびラスター座標系
複数のレイヤーで空間解析を実行するには、レイヤーで同じ座標参照システム(CRS)を使用している必要があります。(QGIS等でも、CRSが異なっていて空間解析がうまく行かないこととか、よくありました。)
最初のステップは、データの座標参照システムを決定することです。 これを行うには、sfのst_crs()およびラスター関数crs()を使用します。
sfで読み込んだ地理データに既にCRSが定義されている場合、sfとラスターの両方がそれを認識して保持します。 CRSが定義されていない場合、EPSG番号またはproj4stringを使用してCRSを自分で定義する必要があります。
使用する関数名:st_crs,crs()
# Determine the CRS for the neighborhoods and trees vector objects
st_crs(neighborhoods)
st_crs(trees)

# Assign the CRS to trees
crs_1 <- "+proj=longlat +ellps=WGS84 +no_defs"
st_crs(trees) <- crs_1

# Determine the CRS for the canopy and manhattan rasters
crs(canopy)
crs(manhattan)

# Assign the CRS to manhattan
crs_2 <- "+proj=utm +zone=18 +ellps=GRS80 +datum=NAD83 +units=m +no_defs"
crs(manhattan) <- crs_2
ベクターデータはst_crs()
ラスターデータはcrs()
間違えそうになるので気をつける必要がありますね。「st」って何の略ですかね。
結果は下記です。
# Determine the CRS for the neighborhoods and trees vector objects
st_crs(neighborhoods)
st_crs(trees)

# Assign the CRS to trees
crs_1 <- "+proj=longlat +ellps=WGS84 +no_defs"
st_crs(trees) <- crs_1

# Determine the CRS for the canopy and manhattan rasters
crs(canopy)
crs(manhattan)

# Assign the CRS to manhattan
crs_2 <- "+proj=utm +zone=18 +ellps=GRS80 +datum=NAD83 +units=m +no_defs"
crs(manhattan) <- crs_2
csr(),st_csr()を使用して、CRSが何を使用しているのか調べることができます。もし、CRSが存在しない場合、2つの関数を使用してCRSを定義することができます。
レイヤーを一般的なCRSに変換する
st_crs()とcrs()をを実行したとき、CRSがレイヤーごとに異なっていました。
ベクターレイヤのCRS:+proj=longlatで始まり、
ラスターレイヤのCRS:+proj=utmまたは+proj=aeaではじまりました。
空間解析では、これらのレイヤーを一緒に使用するには、同じCRSを使用する必要があります。
空間解析をする前に、1つのCRSを共有するように各オブジェクトを変換します。一般に、CRSが投影されているレイヤーで空間解析を実行するのが最適です。オブジェクトに投影されたCRSがあるかどうかを判断するには、st_crs()またはcrs()の結果の最初の部分をみることで判断できます。
+proj=longlatで始まる場合、CRSは投影されません。
使用する関数名:st_crs,crs(),st_transform(),projectRaster(),head()
# Get the CRS from the canopy object
the_crs <- crs(canopy, asText = TRUE)

# Project trees to match the CRS of canopy
trees_crs <- st_transform(trees, crs = the_crs)

# Project neighborhoods to match the CRS of canopy
neighborhoods_crs <- st_transform(neighborhoods, crs = the_crs)

# Project manhattan to match the CRS of canopy
manhattan_crs <- projectRaster(manhattan, crs = the_crs, method = "ngb")

# Look at the CRS to see if they match
st_crs(trees_crs)
st_crs(neighborhoods_crs)
csr(manhattan_crs)
結果は下記
> # Get the CRS from the canopy object
> the_crs <- crs(canopy, asText = TRUE)
>
> # Project trees to match the CRS of canopy
> trees_crs <- st_transform(trees, crs = the_crs)
>
> # Project neighborhoods to match the CRS of canopy
> neighborhoods_crs <- st_transform(neighborhoods, crs = the_crs)
>
> # Project manhattan to match the CRS of canopy
> manhattan_crs <- projectRaster(manhattan, crs = the_crs, method = "ngb")
>
> # Look at the CRS to see if they match
> st_crs(trees_crs)
Coordinate Reference System:
  No EPSG code
  proj4string: "+proj=aea +lat_1=29.5 +lat_2=45.5 +lat_0=23 +lon_0=-96 +x_0=0 +y_0=0 +ellps=GRS80 +towgs84=0,0,0,0,0,0,0 +units=m +no_defs"
> st_crs(neighborhoods_crs)
Coordinate Reference System:
  No EPSG code
  proj4string: "+proj=aea +lat_1=29.5 +lat_2=45.5 +lat_0=23 +lon_0=-96 +x_0=0 +y_0=0 +ellps=GRS80 +towgs84=0,0,0,0,0,0,0 +units=m +no_defs"
> crs(manhattan_crs)
CRS arguments:
 +proj=aea +lat_1=29.5 +lat_2=45.5 +lat_0=23 +lon_0=-96 +x_0=0 +y_0=0
+ellps=GRS80 +towgs84=0,0,0,0,0,0,0 +units=m +no_defs
>
※
canopyは、crs()でCRS情報を取得
trees_crsは、st_transform()でcanopyのCRS情報にする。
neighborhoods_crsは、st_transform()でcanopyのCRS情報にする。
manhattan_crsは、projectRasterで、CRS情報をcanopyのCRS情報にする。
ラスターデータは、projectRasterにしてCRSを書き換えるということに注意する。
| ベクターデータ | ラスターデータ | |
|---|---|---|
| CRSを確認 | crs関数 | st_crs関数 |
| CRSを書き換える | st_transform関数 | projectRaster関数 |
空間分析で一番最初に行う必要のある処理。あまりおもしろくないが、これができていないと、分析できないので、覚えておいたほうがよい。
ベクトルとラスターを一緒にプロット
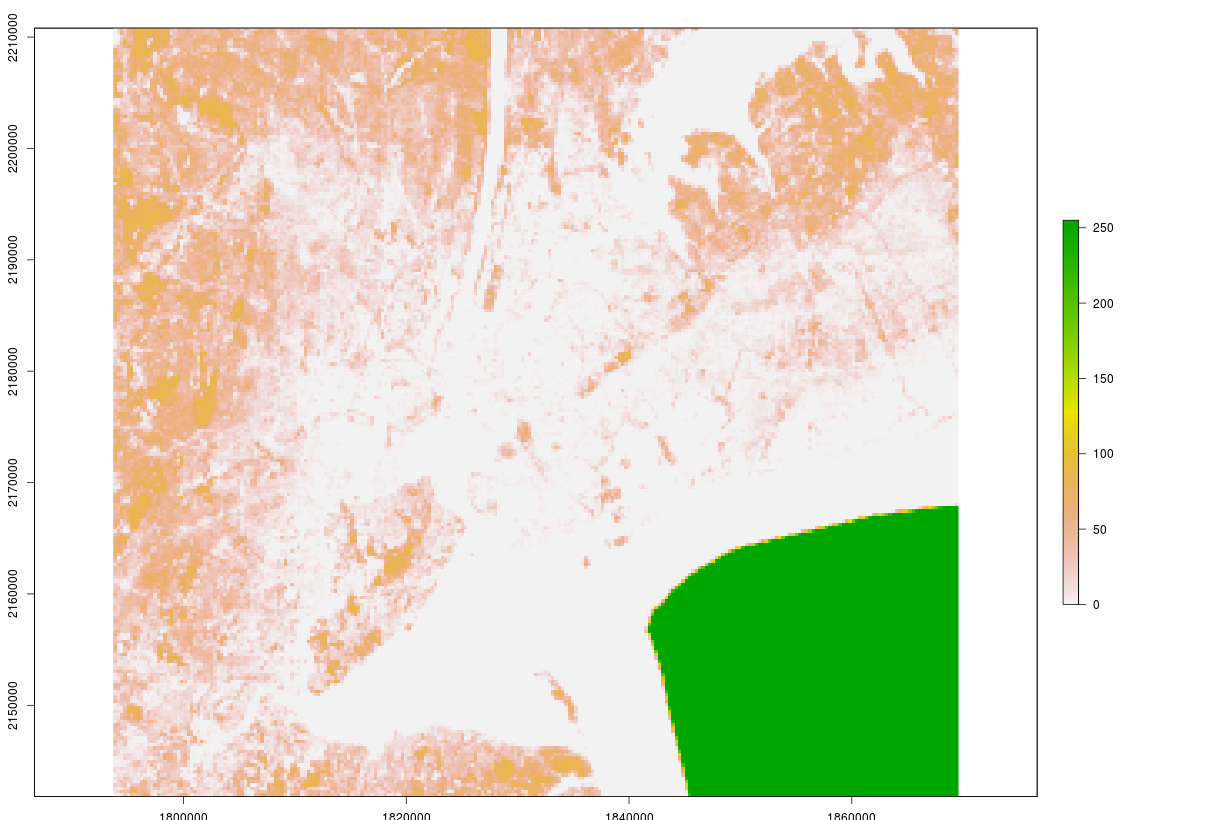
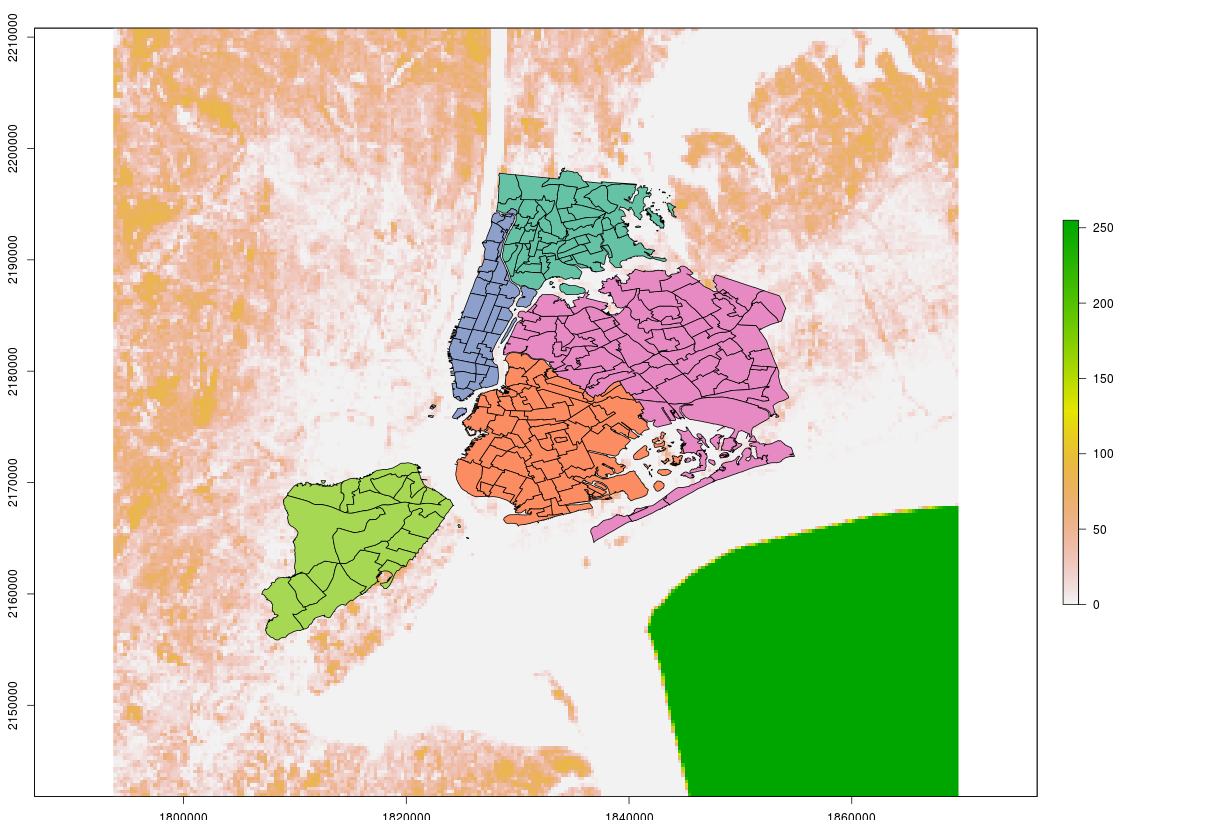
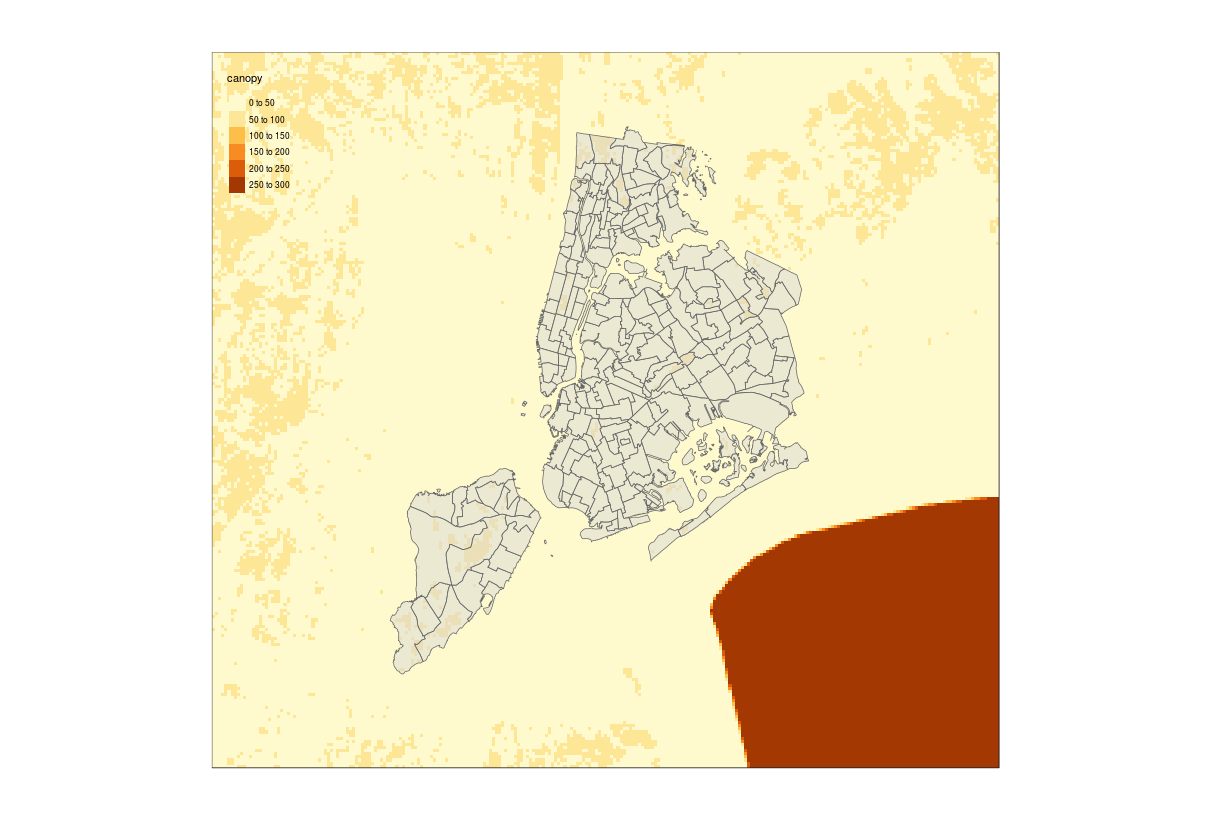
レイヤーが共通のCRSを使用してしない場合、プロット上で表示されない場合があります。 それを確認してみる。まずplot()を使用してマップを作成し、同じCRSを共有しない2つのレイヤーを追加してみます。 次に、1つのレイヤーのCRSを他のレイヤーと一致するように変換し、plot()関数とtmapパッケージの関数の両方でこれをプロットします。
plot()関数を使用すると、plot()を複数回呼び出すことにより、同じマップ上に複数のレイヤーをプロットできます。 最初の呼び出しの後にplot()のすべての呼び出しに引数add = TRUEを追加する必要があり、行ごとではなくすべてのレイヤーに対してコードを一度に実行する必要があります。
使用する関数名:st_crs,crs(),st_transform(),projectRaster(),head(),tm_shape()
# Plot canopy and neighborhoods (run both lines together)
# Do you see the neighborhoods?
plot(canopy)
plot(neighborhoods, add = TRUE)

# See if canopy and neighborhoods share a CRS
st_crs(neighborhoods)
crs(canopy)

# Save the CRS of the canopy layer
the_crs <- crs(canopy, asText = TRUE)

# Transform the neighborhoods CRS to match canopy
neighborhoods_crs <- st_transform(neighborhoods, crs = the_crs)

# Re-run plotting code (run both lines together)
# Do the neighborhoods show up now?
plot(canopy)
plot(neighborhoods_crs, add = TRUE)

# Simply run the tmap code
tm_shape(canopy) +
    tm_raster() +
    tm_shape(neighborhoods_crs) +
    tm_polygons(alpha = 0.5)
同じCRSではない場合、レイヤーを一緒に重ねて表示することはできませんでした。
そのため、使用するレイヤーは共通のCRSを設定する必要があることが理解できました。
データフレームからジオメトリをドロップする
sfの大きな特徴は、空間オブジェクトの格納にデータフレームを使用していることです。これにより、非空間データの場合と同じ方法で空間データをスライスおよびダイスすることができます。これは、dplyrの関数をsfオブジェクトに適用できることを指しています。
空間データを使用する場合と使用しない場合のdplyrの重要な違いの1つは、明示的にドロップしない限り、結果のデータフレームにジオメトリ変数が含まれることです。ジオメトリを強制的に削除する場合は、sf関数のst_set_geometry()を使用し、ジオメトリをNULLに設定します。
使用する関数名:count(),head(),st_set_geometry()
# Create a data frame of counts by species
species_counts <- count(trees, species, sort = TRUE)

# Use head to see if the geometry column is in the data frame
head(species_counts)

# Drop the geometry column
species_no_geometry <- st_set_geometry(species_counts, NULL)

# Confirm the geometry column has been dropped
head(species_no_geometry)
以下結果
> # Create a data frame of counts by species
> species_counts <- count(trees, species, sort = TRUE)
>
> # Use head to see if the geometry column is in the data frame
> head(species_counts)
Simple feature collection with 6 features and 2 fields
geometry type: MULTIPOINT
dimension: XY
bbox: xmin: -74.25443 ymin: 40.49894 xmax: -73.70104 ymax: 40.91165
epsg (SRID): 4326
proj4string: +proj=longlat +ellps=WGS84 +no_defs
# A tibble: 6 x 3
species n geometry
<fct> <int> <MULTIPOINT [arc_degree]>
1 London planet~ 8709 (-74.25408 40.50763, -74.25372 40.50783, -74.2508 40.509~
2 honeylocust 6418 (-74.25426 40.50604, -74.25134 40.50514, -74.24226 40.50~
3 Callery pear 5902 (-74.25443 40.50647, -74.25218 40.50545, -74.25217 40.50~
4 pin oak 5355 (-74.25329 40.50837, -74.25325 40.50536, -74.25242 40.50~
5 Norway maple 3373 (-74.25443 40.507, -74.25422 40.50699, -74.25256 40.5055~
6 littleleaf li~ 3043 (-74.25032 40.51409, -74.2501 40.5142, -74.24657 40.5066~
>
> # Drop the geometry column
> species_no_geometry <- st_set_geometry(species_counts, NULL)
>
> # Confirm the geometry column has been dropped
> head(species_no_geometry)
# A tibble: 6 x 2
species n
<fct> <int>
1 London planetree 8709
2 honeylocust 6418
3 Callery pear 5902
4 pin oak 5355
5 Norway maple 3373
6 littleleaf linden 3043
※st_set_geometry(data、NULL)を使用していらない列を削除することができました。また、dplyrのcount()を使うことで、データ数をカウントしています。
空間データと非空間データを結合する
inner_join()を使用して、空間データと非空間データを結合します。
使用する関数名:select(),st_set_geometry(),distinct(),inner_join()
# Limit to the fields boro_name, county_fip and boro_code
boro <- select(neighborhoods, boro_name, county_fip, boro_code)

# Drop the geometry column
boro_no_geometry <- st_set_geometry(boro, NULL)

# Limit to distinct records
boro_distinct <- distinct(boro_no_geometry)

# Join the county detail into the trees object
trees_with_county <- inner_join(trees, boro_distinct, by = c("boroname" = "boro_name"))

# Confirm the new fields county_fip and boro_code exist
head(trees_with_county)
以下結果です。
> # Limit to the fields boro_name, county_fip and boro_code
> boro <- select(neighborhoods, boro_name, county_fip, boro_code)
>
> # Drop the geometry column
> boro_no_geometry <- st_set_geometry(boro, NULL)
>
> # Limit to distinct records
> boro_distinct <- distinct(boro_no_geometry)
>
> # Join the county detail into the trees object
> trees_with_county <- inner_join(trees, boro_distinct, by = c("boroname" = "boro_name"))
>
> # Confirm the new fields county_fip and boro_code exist
> head(trees_with_county)
Simple feature collection with 6 features and 9 fields
geometry type:  POINT
dimension:      XY
bbox:           xmin: -74.13116 ymin: 40.62351 xmax: -73.80057 ymax: 40.77393
epsg (SRID):    4326
proj4string:    +proj=longlat +ellps=WGS84 +no_defs
  tree_id  nta longitude latitude stump_diam      species      boroname
1  558423 QN76 -73.80057 40.67035          0  honeylocust        Queens
2  286191 MN32 -73.95422 40.77393          0 Callery pear     Manhattan
3  257044 QN70 -73.92309 40.76196          0  Chinese elm        Queens
4  603262 BK09 -73.99866 40.69312          0       cherry      Brooklyn
5   41769 SI22 -74.11773 40.63166          0       cherry Staten Island
6   24024 SI07 -74.13116 40.62351          0    red maple Staten Island
  county_fip boro_code                   geometry
1        081         4 POINT (-73.80057 40.67035)
2        061         1 POINT (-73.95422 40.77393)
3        081         4 POINT (-73.92309 40.76196)
4        047         3 POINT (-73.99866 40.69312)
5        085         5 POINT (-74.11773 40.63166)
6        085         5 POINT (-74.13116 40.62351)
>
※sfを使用すると、dplyrの一般的な結合やマージ機能を使用して空間データと非空間データを組み合わせることができました。今回はdplyrを使っていますが、Rにもともと入っているmerge()も使えます。QGISにも、似たようなことができる機能がありますね。
近隣の境界を簡素化
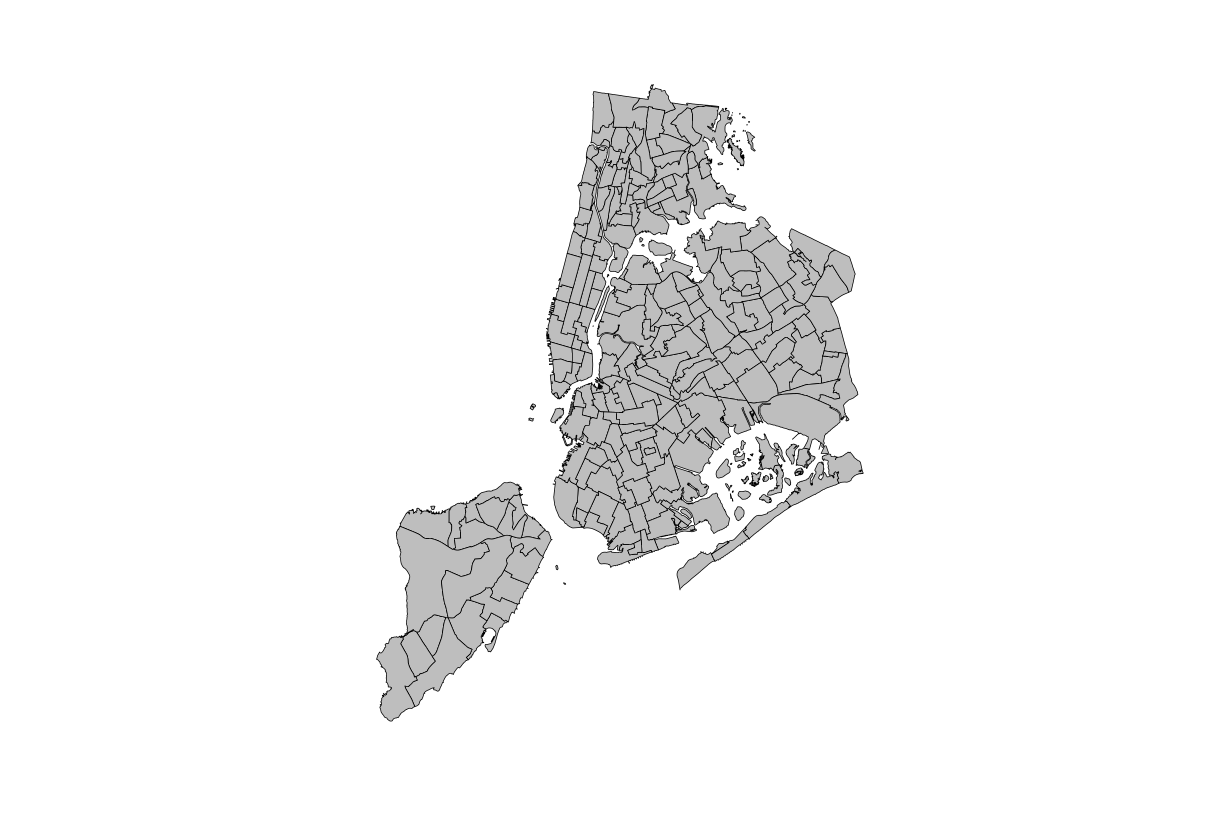
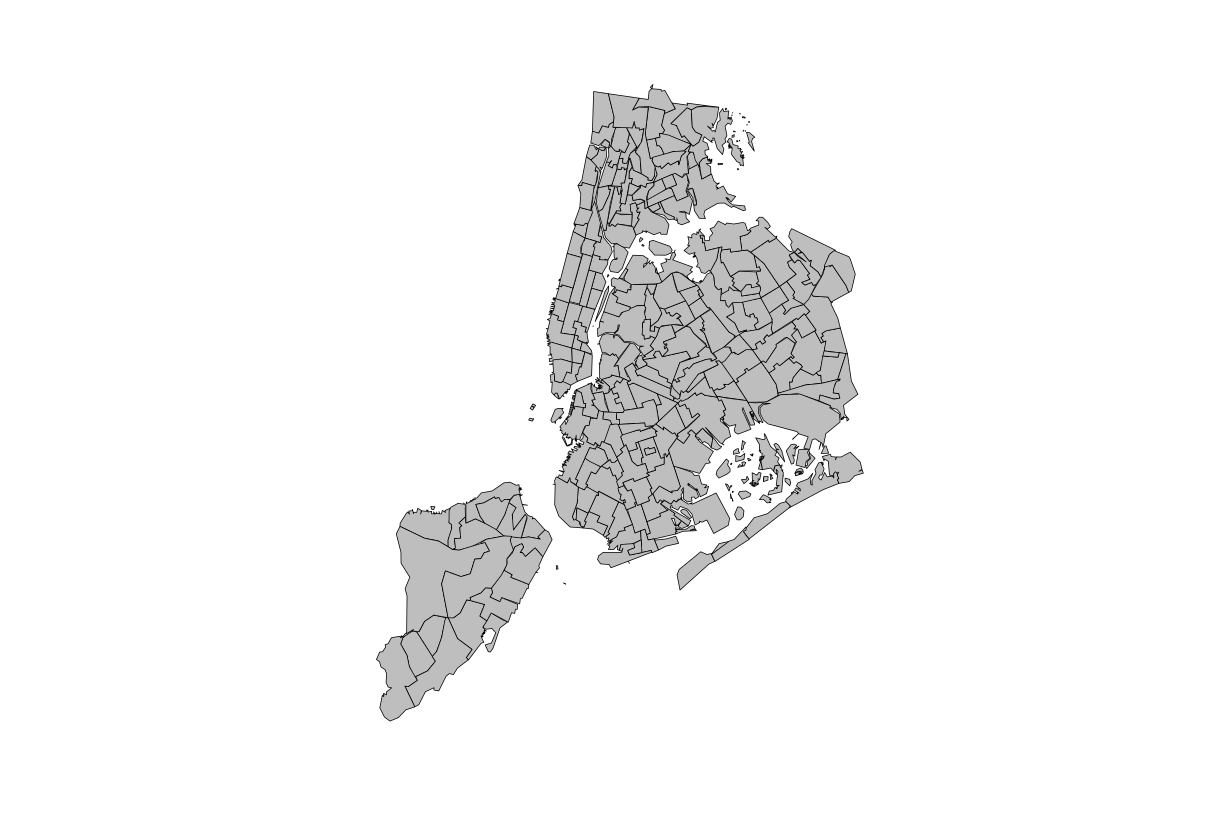
sfでは、st_simplify()を使用して、ラインとポリゴンの複雑な形状を簡素化することができます。st_simplify()により、ラインやポリゴンといったジオメトリを簡素化したものを出力します。
pryrのobject_size()を使用してサイズをメガバイト単位で計算し、頂点の数(ラインまたはポリゴンの輪郭を描くのに必要なポイントの数)をカウントします。
使用する関数名:plot(),st_simplify(),st_cast(),sapply(),sum()
# Plot the neighborhoods geometry
plot(st_geometry(neighborhoods), col = "grey")

# Measure the size of the neighborhoods object
st_simplify(neighborhoods)

# Compute the number of vertices in the neighborhoods object
pts_neighborhoods <- st_cast(neighborhoods$geometry, "MULTIPOINT")
cnt_neighborhoods <- sapply(pts_neighborhoods, length)
sum(cnt_neighborhoods)

# Simplify the neighborhoods object
neighborhoods_simple <- st_simplify(neighborhoods,
                            preserveTopology = TRUE,
                            dTolerance = 100)

# Measure the size of the neighborhoods_simple object
object_size(neighborhoods_simple)

# Compute the number of vertices in the neighborhoods_simple object
pts_neighborhoods_simple <- st_cast(neighborhoods_simple, "MULTIPOINT")
cnt_neighborhoods_simple <- sapply(pts_neighborhoods_simple, length)
sum(cnt_neighborhoods_simple)

# Plot the neighborhoods_simple object geometry
plot(st_geometry(neighborhoods_simple), col = "grey")
以下、結果です。
> # Plot the neighborhoods geometry
> plot(st_geometry(neighborhoods), col = "grey")
>
> # Measure the size of the neighborhoods object
> object_size(neighborhoods)
1.83 MB
>
> # Compute the number of vertices in the neighborhoods object
> pts_neighborhoods <- st_cast(neighborhoods$geometry, "MULTIPOINT")
> cnt_neighborhoods <- sapply(pts_neighborhoods, length)
> sum(cnt_neighborhoods)
[1] 210736
>
> # Simplify the neighborhoods object
> neighborhoods_simple <- st_simplify(neighborhoods,
                              preserveTopology = TRUE,
                              dTolerance = 100)
>
> # Measure the size of the neighborhoods_simple object
> object_size(neighborhoods_simple)
216 kB
>
> # Compute the number of vertices in the neighborhoods_simple object
> pts_neighborhoods_simple <- st_cast(neighborhoods_simple$geometry, "MULTIPOINT")
> cnt_neighborhoods_simple <- sapply(pts_neighborhoods_simple, length)
> sum(cnt_neighborhoods_simple)
[1] 8616
>
> # Plot the neighborhoods_simple object geometry
> plot(st_geometry(neighborhoods_simple), col = "grey")
>
※1.83MB、210736ポイントのデータをst_simplify()を適用させることで、216kB、8616ポイントのデータにまで削減することができました。プロットの違いはほとんどありません。サイズは8倍小さくなり、ポイント数は20倍小さくなっています。web上で表示する際に、オブジェクトサイズを縮小するのに適した方法であることがわかります。
sfオブジェクトからspオブジェクトへの変換
sfをspに変換するには、as()を使用することで変換することが可能です。sfに戻すときはst_as_sf()を使用することで、戻すことができます。
※spオブジェクトとは?本サイトにわかりやすい説明を記載している方がいました。
また、本サイトの24ページにspとsfの比較をしている表がありました。
| sp | sf |
|---|---|
| 2003年~ | 2017年~ |
| S4クラス | data.frameを拡張 |
| 多くのGISを関連パッケージが依存 | dplyr,ggplot2が対応中 |
| 地理データの標準仕様に未対応 | 地理データの標準使用に対応 |
使用する関数名:st_read(),as(),class(),st_as_sf()
# Read in the trees data
trees <- st_read("trees.shp")

# Convert to Spatial class
trees_sp <- as(trees, Class = "Spatial")

# Confirm conversion, should be "SpatialPointsDataFrame"
class(trees_sp)

# Convert back to sf
trees_sf <- st_as_sf(trees_sp)

# Confirm conversion
class(trees_sf)
以下、結果です。
> # Read in the trees data
> trees <- st_read("trees.shp")
Reading layer `trees' from data source `/home/repl/trees.shp' using driver `ESRI Shapefile'
Simple feature collection with 65217 features and 7 fields
geometry type:  POINT
dimension:      XY
bbox:           xmin: -74.2546 ymin: 40.49894 xmax: -73.70078 ymax: 40.91165
epsg (SRID):    4326
proj4string:    +proj=longlat +ellps=WGS84 +no_defs
>
> # Convert to Spatial class
> trees_sp <- as(trees, Class = "Spatial")
>
> # Confirm conversion, should be "SpatialPointsDataFrame"
> class(trees_sp)
[1] "SpatialPointsDataFrame"
attr(,"package")
[1] "sp"
>
> # Convert back to sf
> trees_sf <- st_as_sf(trees_sp)
>
> # Confirm conversion
> class(trees_sf)
[1] "sf"         "data.frame"
>
今後はsfが主流になるので、as(),st_as_sf()はどんどん使用しなくなると思います。
座標への変換および座標からの変換
座標のデータフレームをsfに変換するには、st_as_sf()を使用します。
座標変数の名前(最初にリストされているX座標/経度座標)でcoords引数を指定します。オプションで、座標のCRSがわかっている場合はcrs引数を指定できます。 CRSは、proj4文字列またはEPSGコードとして指定できます。
sfポイントオブジェクトの座標を持つデータフレームに変換する場合は、隠し引数でst_write()を使用します(これらはGDALと呼ばれる外部ユーティリティに関連付けられているため、Rヘルプにはありません)
sfに座標を出力ファイルに含めるように強制します。
必要な引数はlayer_options = "GEOMETRY = AS_XY"です。
使用する関数名:read.csv(),st_as_sf(),st_geometry(),st_write()
# Read in the CSV
trees <- read.csv("trees.csv")

# Convert the data frame to an sf object
trees_sf <- st_as_sf(trees, coords = c("longitude", "latitude"), crs = 4326)

# Plot the geometry of the points
plot(st_geometry(trees_sf))

# Write the file out with coordinates
st_write(trees_sf, "new_trees.csv",  layer_options = "GEOMETRY=AS_XY", delete_dsn = TRUE)

# Read in the file you just created and check coordinates
new_trees <- read.csv("new_trees.csv")
head(new_trees)
以下、結果です。
> # Read in the CSV
> trees <- read.csv("trees.csv")
>
> # Convert the data frame to an sf object
> trees_sf <- st_as_sf(trees, coords = c("longitude", "latitude"), crs = 4326)
>
> # Plot the geometry of the points
> plot(st_geometry(trees_sf))
>
> # Write the file out with coordinates
> st_write(trees_sf, "new_trees.csv",  layer_options = "GEOMETRY=AS_XY", delete_dsn = TRUE)
Deleting source `new_trees.csv' using driver `CSV'
Writing layer `new_trees' to data source `new_trees.csv' using driver `CSV'
options:        GEOMETRY=AS_XY
Writing 100 features with 5 fields and geometry type Point.
>
> # Read in the file you just created and check coordinates
> new_trees <- read.csv("new_trees.csv")
> head(new_trees)
          X        Y tree_id  nta stump_diam      species      boroname
1 -73.80057 40.67035  558423 QN76          0  honeylocust        Queens
2 -73.95422 40.77393  286191 MN32          0 Callery pear     Manhattan
3 -73.92309 40.76196  257044 QN70          0  Chinese elm        Queens
4 -73.99866 40.69312  603262 BK09          0       cherry      Brooklyn
5 -74.11773 40.63166   41769 SI22          0       cherry Staten Island
6 -74.13116 40.62351   24024 SI07          0    red maple Staten Island
>
※CSVファイルを読み込んだデータはst_as_sf()を使ってsfにする必要があることがわかりました。また、その際にcoordsとcrsを設定シて上げる必要があると理解できました。QGISでいうところの、「ディリミテッドテキストレイヤの追加」にあたる部分ですね。
座標をsfオブジェクトに変換したり、データフレームに書き込むことは、座標を操作する上では空間分析の重要なスキルだと理解できました。
集計を使用してラスターグリッドのセルサイズを変更する
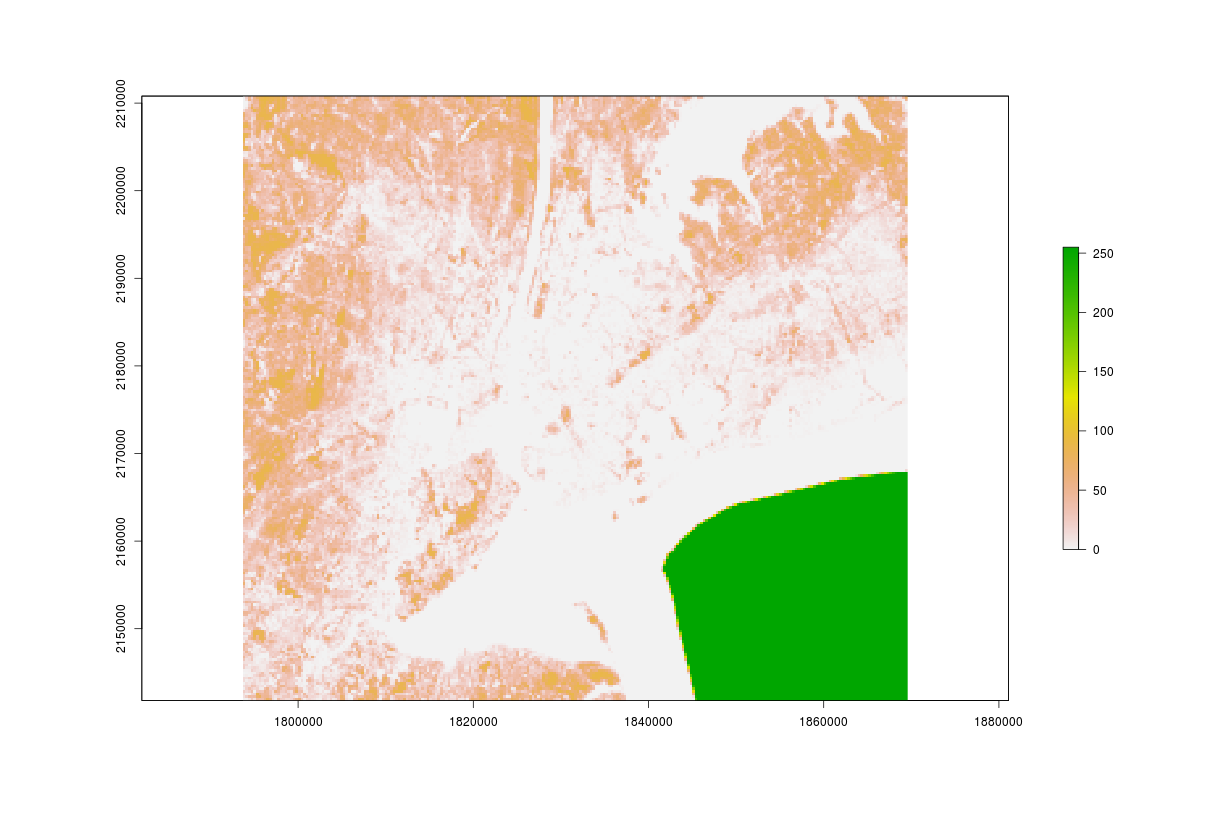
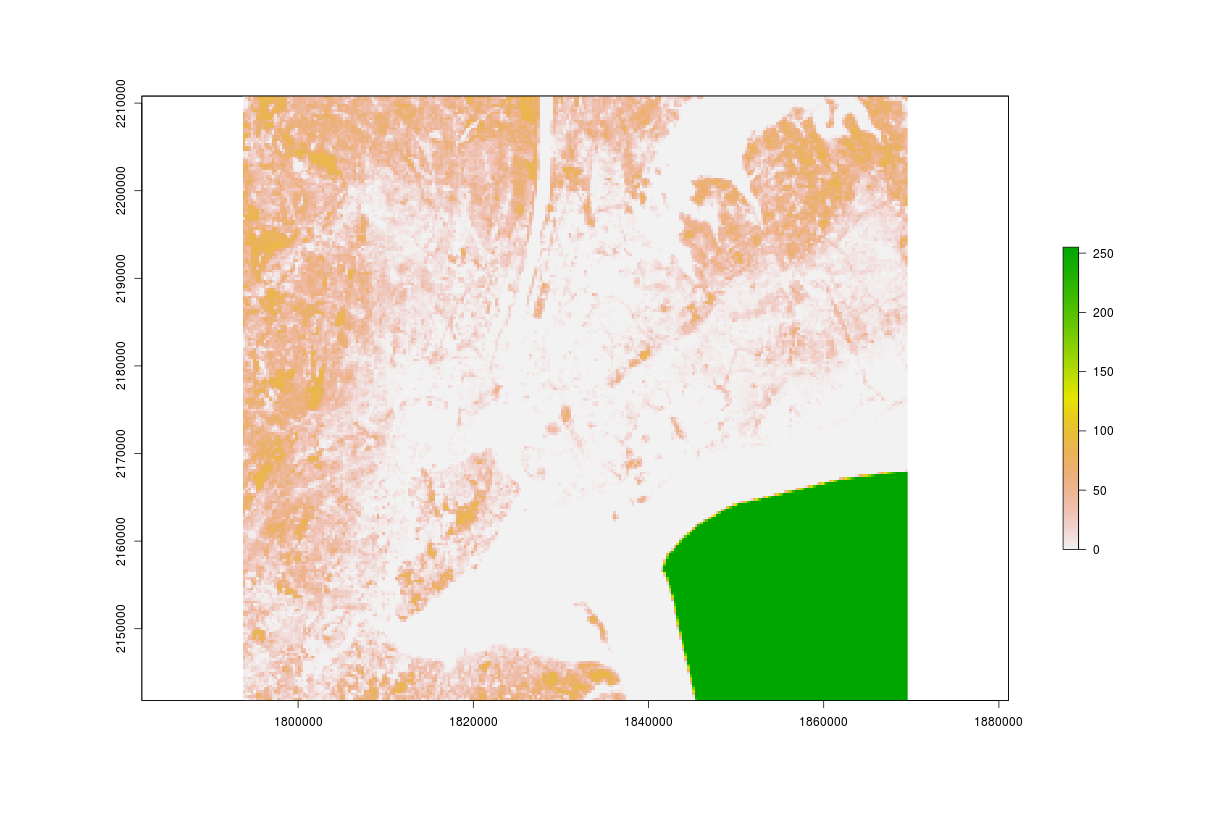
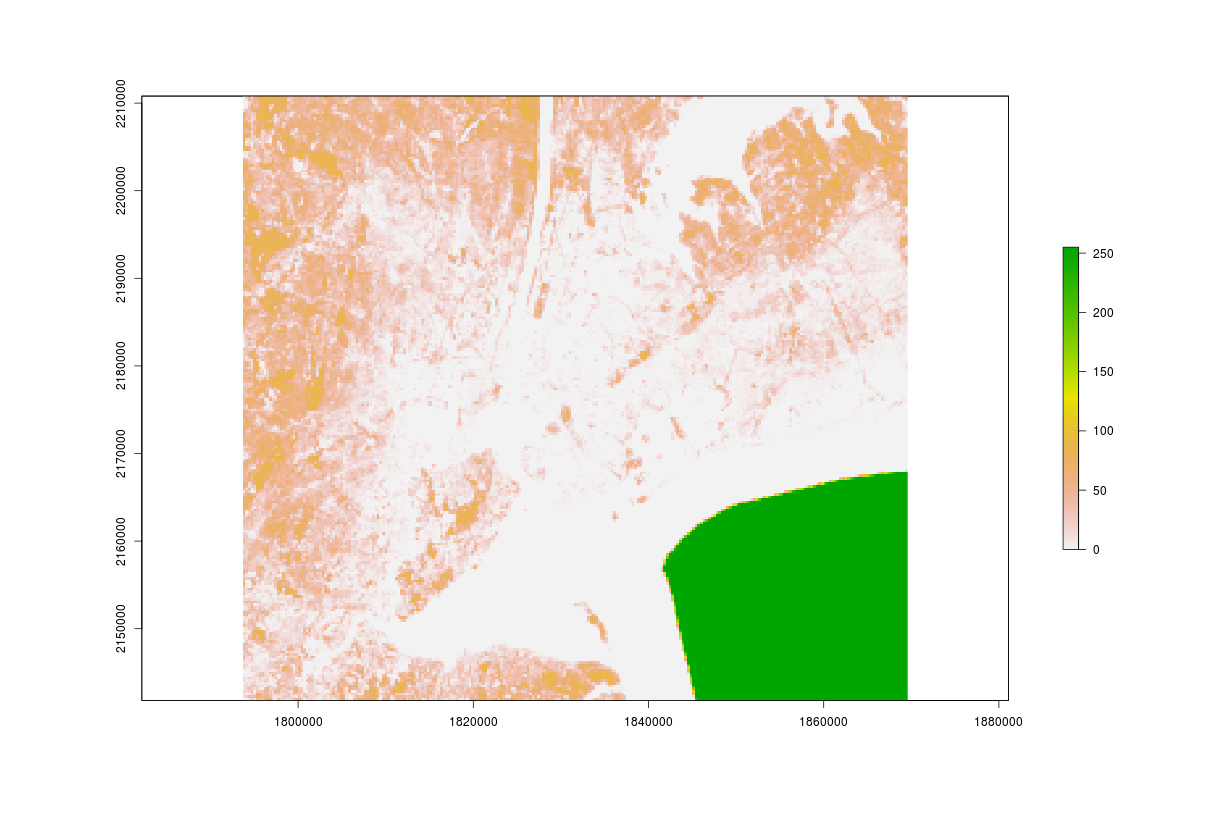
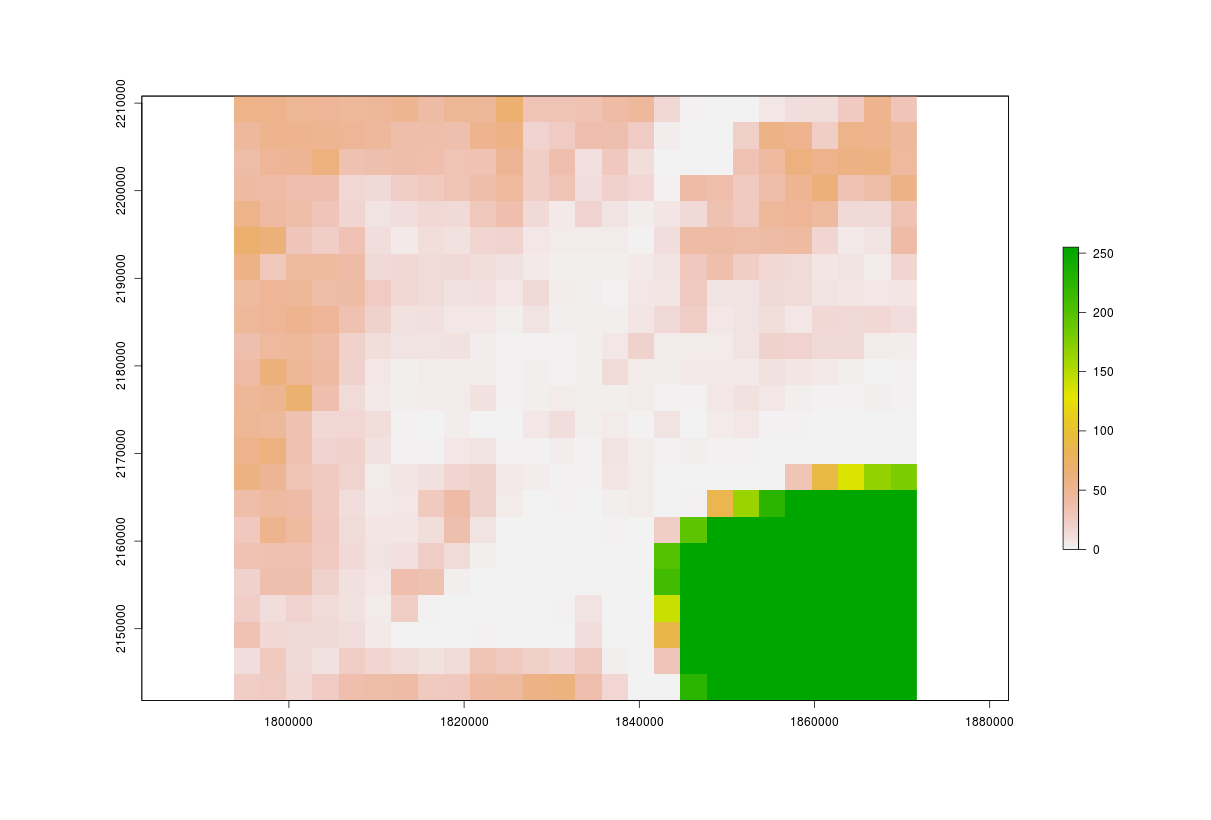
ラスターデータで解像度を下げるには、ユーザーが定義した関数(たとえば、平均や最大等)を使用して、グリッドセルをより大きなグリッドセルに集約するというやり方が一般的だと思われます。Rでいうところのaggregate()を使うことで、実現できます。 集計の量はfact(デフォルトは2)によって決まります。
使用する関数名:raster(),res(),ncell(),aggregate()
# Read in the canopy layer
canopy <- raster("canopy.tif")

# Plot the canopy raster
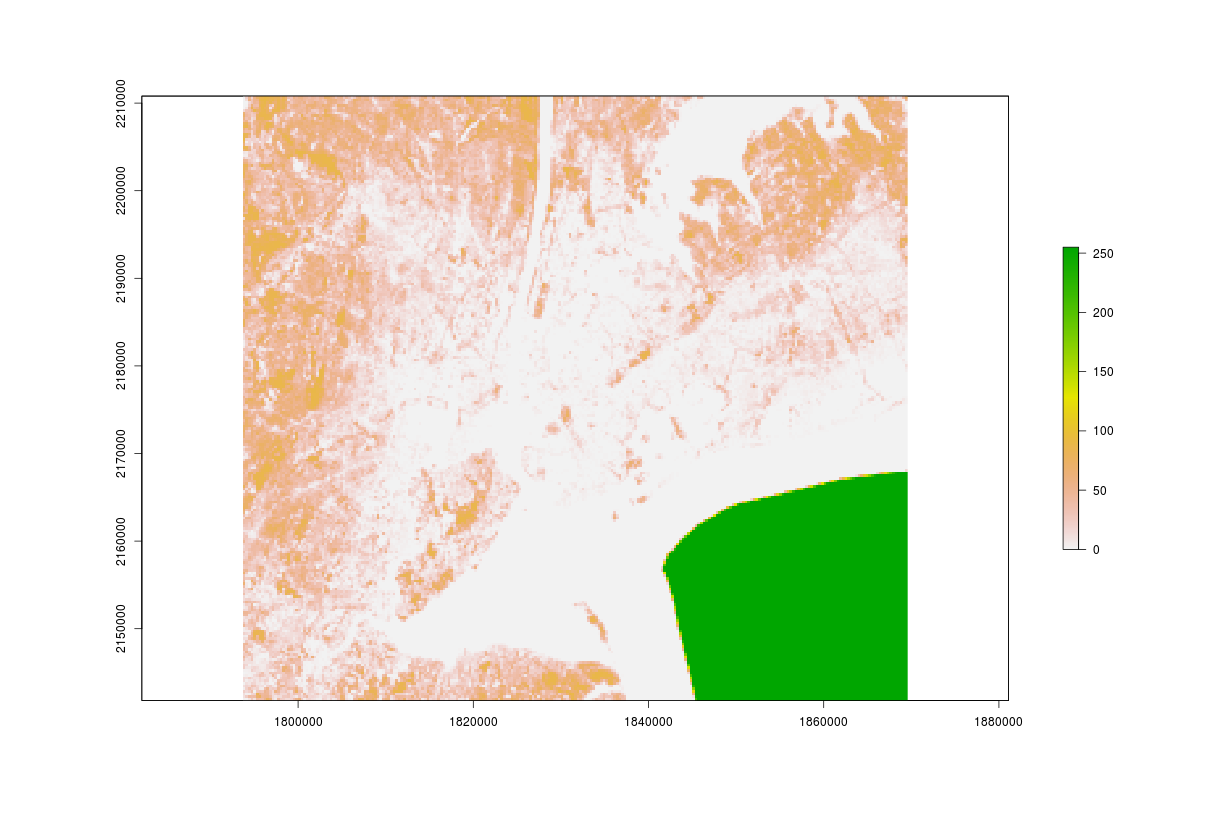
plot(canopy)

# Determine the raster resolution
res(canopy)

# Determine the number of cells
ncell(canopy)

# Aggregate the raster
canopy_small <- aggregate(canopy, fact = 10)

# Plot the new canopy layer
plot(canopy_small)

# Determine the new raster resolution
res(canopy_small)

# Determine the number of cells in the new raster
ncell(canopy_small)
結果は、下記の通りです。
> # Read in the canopy layer
> canopy <- raster("canopy.tif")
>
> # Plot the canopy raster
> plot(canopy)
>
> # Determine the raster resolution
> res(canopy)
[1] 300 300
>
> # Determine the number of cells
> ncell(canopy)
[1] 58190
>
> # Aggregate the raster
> canopy_small <- aggregate(canopy, fact = 10)
>
> # Plot the new canopy layer
> plot(canopy_small)
>
> # Determine the new raster resolution
> res(canopy_small)
[1] 3000 3000
>
> # Determine the number of cells in the new raster
> ncell(canopy_small)
[1] 598
>
解像度を落とすことで、メモリの節約と計算リソースを節約することができます。大きなラスターは非常にサイズが大きいため、このような手法を知っておくことは後々使えるかもしれません。
値を変更し、ラスターの欠損値を処理する
ラスターデータの値を変更シなければいけないことが起きたりします。
たとえば、外れ値をNAに変更したりすることです。
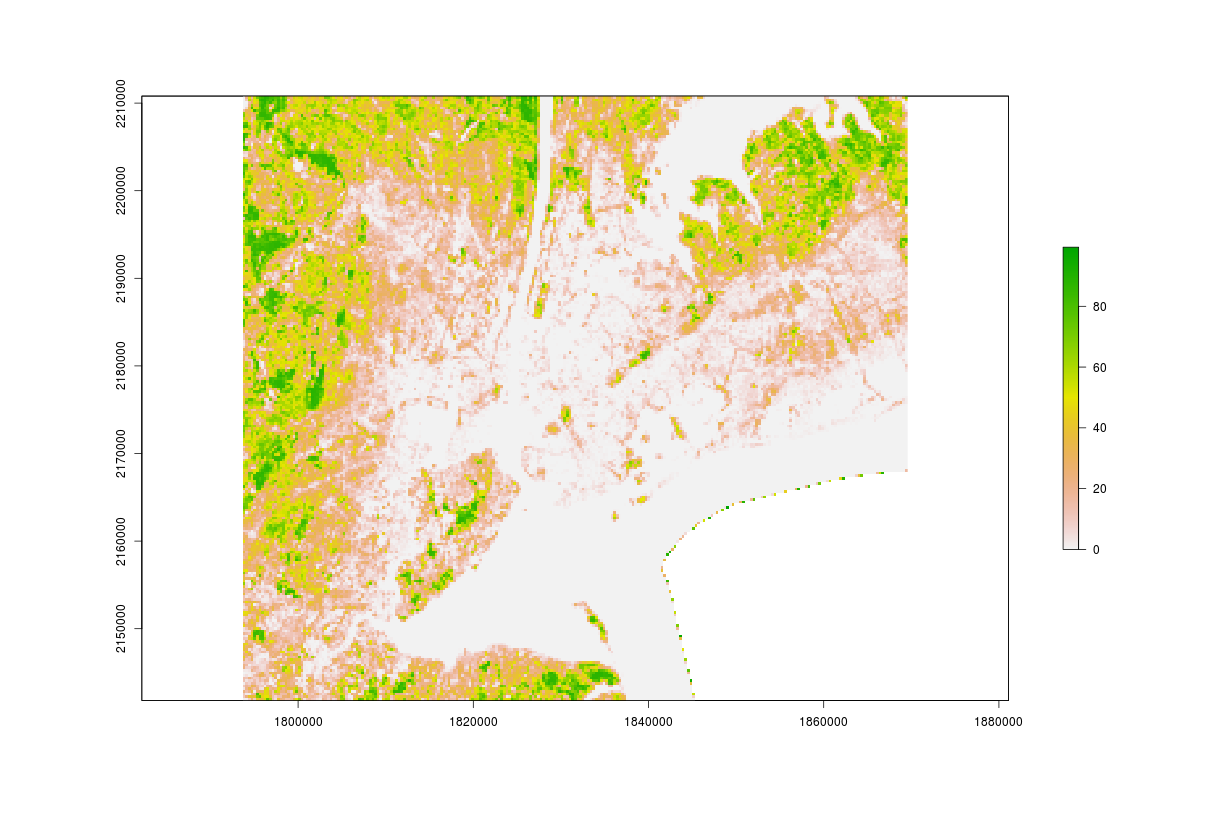
ラスターパッケージでは、再分類はreclassify()関数を使用して実行できます。
使用する関数名:plot(),cbind(),reclassify(),plot()
# Plot the canopy layer to see the values above 100
plot(canopy)

# Set up the matrix
vals <- cbind(100, 300, NA)

# Reclassify
canopy_reclass <- reclassify(canopy, rcl = vals)

# Plot again and confirm that the legend stops at 100
plot(canopy_reclass)
以下、結果です。
ラスタを再分類する方法を知っていると便利だということがわかりました。今回は、rcl引数の指定方法をmatrixであるvalsを指定していましたが、他の方法もたくさんあるみたいです。
おわりに
前回はデータ読み込みやdplyrの機能を使ってデータクレンジング、ラスターデータの表示など、基本的な処理方法がわかりました。
今回は、座標変換やベクタデータとラスターデータの重ね合わせ、空間データと非空間データのデータ結合といったデータ処理方法がわかりました。
また引き続き、備忘録を作成していきたいと思います。
